What "Stop-and-Frisk" Really Means: Discrimination & Use of Force
By Rose Lenehan,
August 17, 2017
Press release
I would do stop-and-frisk. I see what’s going on here, I see what’s going on in Chicago, I think stop-and-frisk. In New York City it was so incredible, the way it worked.
—Donald Trump, September 2016
President Donald Trump has expressed support for stop-and-frisk repeatedly, even before he endorsed the practice as a presidential candidate. But he’s wrong: stop and frisk does not work. While it was policy in New York, the crime rate declined—but it also declined in many other cities that sensibly avoided stopping citizens without good reason: Los Angeles, Atlanta, Dallas, and San Diego.
The question of whether a policy like stop-and-frisk is effective is moot if it systematically violates citizens’ rights. As a federal judge pointed out in the 2013 case against stop-and-frisk in New York City, “Many police practices may be useful for fighting crime — preventive detention or coerced confession, for example—but because they are unconstitutional they cannot be used, no matter how effective” [emphasis added]. The judge found that stop-and-frisk in New York City had been racially discriminatory, violating both the Fourth Amendment and the equal protection clause of the 14th Amendment.
By now it’s well known that stop-and-frisk disproportionately targets Black and Latino communities. But the policy is even more destructive than you think. To see how stop-and-frisk was implemented, we looked at the raw NYPD data on stop-and-frisk in 2011. That was the peak year for stop-and-frisk in New York City, when police made 685,724 stops—almost 2,000 stops every single day. Our analysis shows that the police used physical force in almost a quarter of stops—and that their use of force is also racially discriminatory.
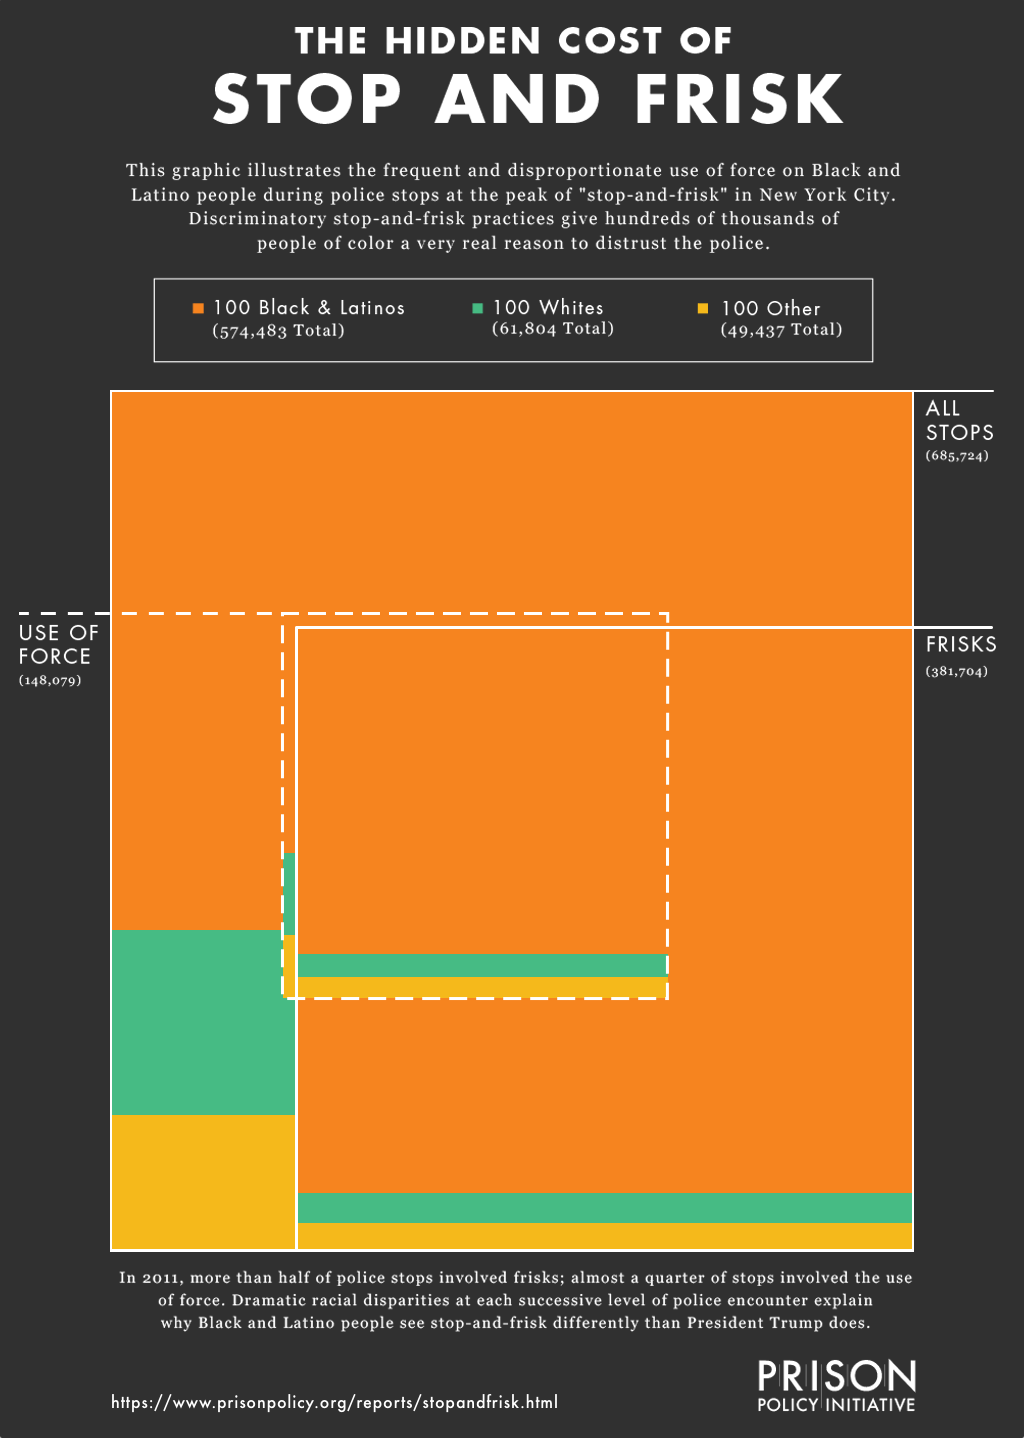
In 2011, the police stopped Black and Latino people 574,483 times and used physical force against them almost 130,000 times. “Physical force” includes pushing people to the ground, forcing them against a wall or a car, pointing guns at them, and using batons or pepper spray. The police reported using force in 23% of stops of Blacks and Latinos, but in only 16% of stops of Whites. And for what? The police found weapons—mostly knives—in about 1% of stops of Blacks and Latinos. They found weapons on Whites they stopped nearly twice as often.
Flawed police form encourages flawed stops
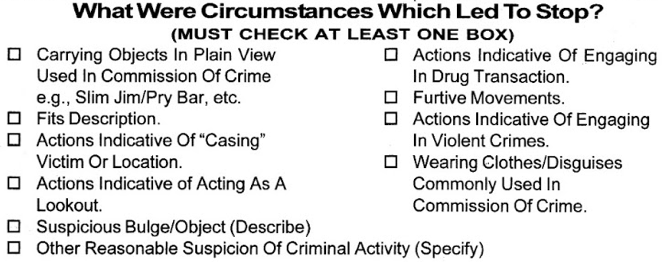 After a stop, police were required to document the reason for the stop on this form. The most common reason? “Furtive movements,” which is so vague it can mean almost anything. (See the full UF-250 form .)
The police seem to employ very different thresholds of suspicion when deciding to stop Blacks & Latinos versus Whites. Three data points support this conclusion. First are the differing success rates: Officers are more likely to arrest Whites they stop and more likely to find a weapon. Second, a higher proportion of stops of Whites originate in radio calls, meaning the stop isn’t entirely a matter of the officer’s discretion. Third is the difference in the reasons given for the stop. Anytime officers stop someone, they have to report the reason for the stop, choosing from among several options (above).
The most commonly cited rationale is “furtive movements,” which could mean almost anything. Officers testifying in Floyd v. City of New York gave examples like “walking in a certain way” and “changing direction.” Unsurprisingly, “furtive movements” was more often cited as the reason for the stop for Blacks and Latinos than for Whites. This all suggests that when officers are dealing with White people their police work is much more careful. It apparently takes a lot less for an officer to consider Black or Latino people “suspicious”.
How did officers decide to stop members of different racial groups?
| Whites | Blacks & Latinos | |
|---|---|---|
| What percentage of stops were purely a matter of officers’ discretion (i.e., were not radio runs)? | 65.9% | 75.4% |
| How often was the reason for the stop “furtive movements”? | 44.5% | 52.4% |
How likely were they to find someone who might be dangerous?
| Whites | Blacks & Latinos | |
|---|---|---|
| What was the arrest rate? | 6.8% | 5.9% |
| How often was a weapon (including knives) found? | 1.9% | 1.1% |
The racial disparities inherent in policies like stop-and-frisk help explain why different racial groups see the police differently. According to a Pew study from September 2016, 75% of Whites but only 33% of Blacks believe the police use the right amount of force for each situation. 75% of Whites but only 35% of Blacks believe police treat racial and ethnic groups equally. 42% of Whites but only 14% of Blacks say they have a lot of confidence in the police department in their community. When people don’t trust the police, they don’t assist them, they don’t report crime, and they don’t call for help.
What do White vs. Black people say about their confidence in the police?
| Whites | Blacks | |
|---|---|---|
| The police use the right amount of force for each situation | 75% agree | 33% agree |
| The police treat racial and ethnic groups equally | 75% agree | 35% agree |
| I have a lot of confidence in the police department in my community | 42% agree | 14% agree |
Trump has claimed he wants to help Black and Latino communities, but for them, policies like stop-and-frisk are a total disaster. Instead of making cities safer, a return to stop-and-frisk is far more likely to produce thousands of forceful and terrifying experiences with police, as well as create and exacerbate distrust of the police within communities they are supposed to be serving.
~ ~ ~
About the author
Rose Lenehan, a PhD candidate in Philosophy at MIT, is a member of the Prison Policy Initiative’s Young Professionals Network. She prepared the bulk of this report during the organization’s Alternative Spring Break Program.
About the Prison Policy Initiative
The non-profit non-partisan Prison Policy Initiative was founded in 2001 to expose the broader harm of mass criminalization and spark advocacy campaigns to create a more just society. The organization is most well-known for its big-picture publication Mass Incarceration: The Whole Pie that helps the public more fully engage in criminal justice reform.
Acknowledgements:
The author wishes to thank Bob Machuga for help with the design of the visualization, Peter Wagner and Wendy Sawyer for editorial help, and Katia Vavova and Alejandro Pérez Carballo for housing her while she was writing this report during the Prison Policy Initiative’s Alternative Spring Break program.
About the data
The visualization and the first two tables in this report use data collected by the New York City Police Department for each police stop to analyze who is stopped, why they are stopped, and the outcomes of each stop.
The data comes with a major caveat: the NYPD requires police officers to fill out a form called the UF-250. The race recorded on the form is whatever the officer chooses to put on the form based on his or her perceptions. And, as the report discusses, the form asks officers to disclose the reasons for the stop, offering some choices that are so vague as to be meaningless. But because we had no other choice, we had to use this data as collected. The NYPD has since improved the form.
We made several choices in analyzing and presenting the data that require some explanation:
- Aggregation of racial groups: The NYPD collects data on six racial groups: White, Black, White Hispanic, Black Hispanic, Asian/Pacific Islander and American Indian/Alaska Native. We aggregated “Black”, “White Hispanic”, and “Black Hispanic” as “Blacks & Latinos” because it made our visual simpler and we discovered no significant differences between the three groupings. We aggregated “Asian/Pacific Islander” and “American Indian/Alaskan Native” as “Other” because we did not see an clear story in the data from representing them separately and because the visualization method we choose would not allow us to focus on just the clear disparity in the treatments of Blacks and Latinos as compared to Whites. We do think that that more research should be done into the treatment of Asian/Pacific Islanders and American Indian/Alaskan Natives by the NYPD, and that research should include an investigation as to whether officers’ race determinations match self-identities.
- Although stop and frisk continues (in a very different form) today, we focused on the peak year — 2011 — to explore the effects of the law at the time when it was being used most aggressively.
- The basis of our visual is one person per pixel when the image is displayed at full resolution. (Readers on smartphones and very small computer screens may see the image somewhat reduced.) Because the shapes in our visualization are rectangles, the display of some racial/ethnic groups in certain combinations of stop-and-frisk outcomes sometimes involves a very slight rounding, never higher than 2.2% and generally less than 0.5%. We experimented with pixel-perfect non-rectangular shapes and concluded that that extra detail made the graph much harder to interpret.
Recommended Reading:

50 state incarceration profiles
All of our recent reports about prison/jail growth, racial disparities, and more, re-organized by state.

The rapid & unregulated growth of e-messaging in prisons
It can strengthen connections, but instead has been used to sap money from incarcerated people.

Incarceration and supervision by states
Probation and parole are the leading forms of mass punishment in America.

Prison Gerrymandering Project
We are leading the movement to protect our democracy from the Census Bureau's prison miscount.