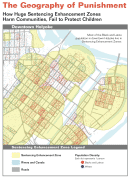
The Geography of Punishment:
How Huge Sentencing Enhancement Zones Harm Communities, Fail to Protect Children
by Aleks Kajstura, Peter Wagner, and William Goldberg
Prison Policy Initiative
July 2008
Section:
Appendix A. County demographics.
| White | Black | Latino | In poverty | In poverty (under 5 years old) | Without a high school diplomar or GED (25 years or older) | |
|---|---|---|---|---|---|---|
| Barnstable County | 93.4% | 1.7% | 1.3% | 6.9% | 9.2% | 8.2% |
| Berkshire County | 94.1% | 1.9% | 1.7% | 9.5% | 15.9% | 14.9% |
| Bristol County | 89.4% | 1.8% | 3.6% | 10.0% | 15.3% | 26.8% |
| Dukes County | 90.0% | 2.3% | 1.0% | 7.3% | 11.1% | 9.6% |
| Essex County | 83.1% | 2.0% | 11.0% | 8.9% | 12.6% | 15.4% |
| Franklin County | 94.4% | 0.8% | 2.0% | 9.4% | 12.8% | 12.0% |
| Hampden County | 74.4% | 7.5% | 15.2% | 14.7% | 26.8% | 20.8% |
| Hampshire County | 89.5% | 1.8% | 3.4% | 9.4% | 9.7% | 10.6% |
| Middlesex County | 83.6% | 3.2% | 4.6% | 6.5% | 6.9% | 11.5% |
| Nantucket County | 86.9% | 8.2% | 2.2% | 7.5% | 2.4% | 8.4% |
| Norfolk County | 87.9% | 3.1% | 1.8% | 4.6% | 4.7% | 8.7% |
| Plymouth County | 87.6% | 4.3% | 2.4% | 6.6% | 8.9% | 12.4% |
| Suffolk County | 52.1% | 20.8% | 15.5% | 19.0% | 24.5% | 21.9% |
| Worcester County | 86.5% | 2.4% | 6.8% | 9.2% | 12.3% | 16.5% |
| Massachusetts | 81.9% | 5.0% | 6.8% | 9.3% | 12.4% | 15.2% |
Recommended Reading:

Advocacy Toolkit
Resources, tips, and best practices to help advocates working to end mass incarceration.

50 state incarceration profiles
All of our recent reports about prison/jail growth, racial disparities, and more, re-organized by state.

Mass Incarceration: The Whole Pie
The U.S. incarcerates nearly 2 million people. Where are they locked up and why? Read our report.
