Visualizing the racial disparities in mass incarceration
Racial inequality is evident in every stage of the criminal justice system - here are the key statistics compiled into a series of charts.
by Wendy Sawyer, July 27, 2020
Recent protests calling for radical changes to American policing have brought much-needed attention to the systemic racism within our criminal justice system. This extends beyond policing, of course: Systemic racism is evident at every stage of the system, from policing to prosecutorial decisions, pretrial release processes, sentencing, correctional discipline, and even reentry. The racism inherent in mass incarceration affects children as well as adults, and is often especially punishing for people of color who are also marginalized along other lines, such as gender and class.
Because racial disparity data is often frustratingly hard to locate, we’ve compiled the key data available into a series of charts, arranged into five slideshows focused on policing, juvenile justice, jails and pretrial detention, prisons and sentencing, and reentry. These charts provide a fuller picture of racial inequality in the criminal justice system, and make clear that a broad transformation will be needed to uproot the racial injustice of mass incarceration.
Following the slideshows, we also address five frequently asked questions about criminal justice race/ethnicity data.
There are racial disparities in policing and arrests:


There are racial disparities in the arrest and confinement of youth:


There are racial disparities in local jails and pretrial detention:


There are racial disparities in prisons, extreme sentences, and solitary confinement:


There are racial disparities in homelessness, unemployment, and poverty after release:


Frequently asked questions about race and ethnicity in criminal justice data
Q: Why are terms used inconsistently, such as “Hispanic” and “Latino/a”?
A: Sharp-eyed readers will notice some inconsistency in the terms used in the charts above, and across the literature more generally. For example, the Census Bureau and most national criminal justice data uses the category “American Indian or Alaska Native” to describe indigenous people in the U.S., but the juvenile justice system data uses the term “American Indian.” Likewise, “Hispanic” is used most frequently in various national data sets to refer to those with Spanish-speaking ancestry, but some sources use Latino/a (or Latinx), which specifically refers to those with Latin American ancestry. In these charts (and in most of our publications), we use the terminology of the original data sources.
Q: Why are some racial/ethnic categories not represented in the data?
A: The question of how accurately race and ethnicity data reflect justice-involved populations goes beyond inconsistent labels. Most obviously, not all racial or ethnic groups are consistently represented in the data; less populous Census-identified groups, such as Native Hawaiian or other Pacific Islander, Asian, and American Indian or Alaska Native – as well as the sizable but less specific “Two or more races” and “Some other race” – are very often excluded in publications, even when they are collected. Moreover, all of these categories are so broad that they lump together groups with very different experiences with the U.S. justice system. They disregard tribal differences, sweep people of East Asian and South Asian origins into one category, and somehow ignore Arab Americans entirely. As a result, our observations of racial and ethnic discrimination are limited to these broad categories and lack any real nuance.
Q: Where can I find data about racial disparities in my state’s criminal justice system?
A: Unfortunately, the more specific you want to get with race/ethnicity data, the harder it is to find an answer, especially one that’s up-to-date. State-level race and ethnicity data can be hard to find if you are looking to federal government sources like the Bureau of Justice Statistics (BJS). BJS does publish state-level race and ethnicity data in its annual Prisoners series (Appendix Table 2 in 2018), but only every 6-7 years in its Jail Inmates series (most recently the 2013 Census of Jails report, Table 7). The Vera Institute of Justice has attempted to fill this gap with its Incarceration Trends project, by gathering additional data from individual states. Individual state Departments of Correction sometimes collect and/or publish more up-to-date and specific data; it’s worth checking with your own state’s agencies.
Q: Where can I find criminal justice race/ethnicity data disaggregated by sex?
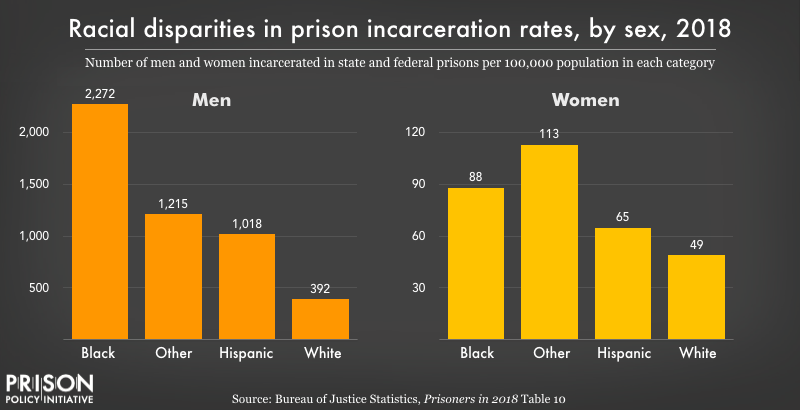
A: Disaggregating racial/ethnic data by sex is unfortunately not the norm in reports produced by the federal government (i.e. BJS). For people able to access and analyze the raw data, such analyses are often possible, but most people rely on the reports published by government agencies like BJS. As you can see in the chart showing prison incarceration rates by sex and race/ethnicity, BJS does sometimes offer this level of detail. But again, the same level of detail is not available for jails, and an analysis of both race/ethnicity and sex by state is all but unheard-of – even though it is precisely this level of detail that is most useful for advocates trying to help specific populations in their state.
Q: How are the data collected, and how accurate are the data?
A: Finally, the validity of any data depends on how the data are collected in the first place. And in the case of criminal justice data, race and ethnicity are not always self-reported (which would be ideal). Police officers may report an individual’s race based on their own perception – or not report it at all – and the surveys that report the number of incarcerated people on a given day rely on administrative data, which may not reflect how individuals identify their own race or ethnicity. This is why surveys of incarcerated people themselves are so important, such as the Survey of Inmates in Local Jails and the Survey of Prison Inmates, but those surveys are conducted much less frequently. In fact, it’s been 18 years since the last Survey of Inmates in Local Jails, which we use to analyze pretrial jail populations, and 16 years since the last published data from the Survey of Inmates were collected.
How to link to specific images
Because some readers might want to link to specific images in this briefing out of the context of these slideshows, we’ve created these special URLs so you can link directly to a specific image:
- Black people are disproportionately stopped on the street by police, while white people are much more likely to call the police for help
- https://www.prisonpolicy.org/blog/2020/07/27/disparities/#slideshows/slideshow1/1
- Among individuals who have any contact with police, people of color disproportionately experience the use of force
- https://www.prisonpolicy.org/blog/2020/07/27/disparities/#slideshows/slideshow1/2
- Black people are disproportionately likely to be arrested, and to be arrested repeatedly in the same year
- https://www.prisonpolicy.org/blog/2020/07/27/disparities/#slideshows/slideshow1/3
- Black youth are arrested far out of proportion to their share of all youth in the U.S.
- https://www.prisonpolicy.org/blog/2020/07/27/disparities/#slideshows/slideshow2/1
- The juvenile justice system confines Black youth at over 4 times the rate of white youth
- https://www.prisonpolicy.org/blog/2020/07/27/disparities/#slideshows/slideshow2/2
- For the lowest level offenses, Black and American Indian youth are confined at rates over 3 times the rate of white youth
- https://www.prisonpolicy.org/blog/2020/07/27/disparities/#slideshows/slideshow2/3
- Racial disparities in local jail incarceration rates
- https://www.prisonpolicy.org/blog/2020/07/27/disparities/#slideshows/slideshow3/1
- Pretrial populations, disproportionately Black and Hispanic, have more than doubled over 15 years
- https://www.prisonpolicy.org/blog/2020/07/27/disparities/#slideshows/slideshow3/2
- People detained pretrial because they can’t pay bail are much poorer than their peers – and the income gaps are widest for Black people
- https://www.prisonpolicy.org/blog/2020/07/27/disparities/#slideshows/slideshow3/3
- Racial disparities in prison incarceration rates, by sex, 2018
- https://www.prisonpolicy.org/blog/2020/07/27/disparities/#slideshows/slideshow4/1
- Most people in prison are poor, and the poorest are women and people of color
- https://www.prisonpolicy.org/blog/2020/07/27/disparities/#slideshows/slideshow4/2
- Black people are disproportionately serving sentences of life, life without parole, or “virtual life”
- https://www.prisonpolicy.org/blog/2020/07/27/disparities/#slideshows/slideshow4/3
- Black people are overrepresented on death row, while white people are underrepresented
- https://www.prisonpolicy.org/blog/2020/07/27/disparities/#slideshows/slideshow4/4
- Black men and women are overrepresented in solitary confinement, when compared to total prison populations
- https://www.prisonpolicy.org/blog/2020/07/27/disparities/#slideshows/slideshow4/5
- The “prison penalty” in unemployment disproportionately punishes formerly incarcerated Black men and women
- https://www.prisonpolicy.org/blog/2020/07/27/disparities/#slideshows/slideshow5/1
- Formerly incarcerated people have very high rates of homelessness, especially women and people of color
- https://www.prisonpolicy.org/blog/2020/07/27/disparities/#slideshows/slideshow5/2
- Incarceration and wealth accumulation, by race and ethnicity
- https://www.prisonpolicy.org/blog/2020/07/27/disparities/#slideshows/slideshow5/3


