Why did prison and jail populations grow in 2022 — and what comes next?
Recently published data from the Bureau of Justice Statistics show growing prison and jail populations, but this has little to do with crime. Instead, the trend reflects court systems’ slow return to “business as usual” and lawmakers’ resurrection of ineffective “tough on crime” strategies.
by Wendy Sawyer, December 19, 2023
The Bureau of Justice Statistics (BJS) recently released its annual reports on prison and jail populations in 2022, noting that the combined state and federal prison populations had increased for the first time in almost a decade and that jail populations had reached 90% of their pre-pandemic level. But what’s behind these trends? Do they just reflect another year of post-pandemic “rebound” or longer-term changes in crime or punishment? And what do these trends suggest about the road ahead for those working to end mass incarceration?
To answer these questions, we looked closely at the annual BJS data as well as 2022 crime and victimization data and criminal court case processing to get a better idea of the reasons behind the new numbers. We also looked at some more recent 2023 jail and prison data to see whether the 2022 uptick appears to have continued in 2023 (spoiler: it does). Finally, we looked at reports from over 20 states to see how states themselves understand these trends, and where they foresee their correctional populations heading in the future.
Ultimately, we conclude that these populations are increasing and can be expected to continue to climb in the next few years, not because of changes in crime but because (a) courts have largely recovered from the slowdowns caused by the pandemic and (b) many states have rolled back sensible criminal legal system reforms — or worse, have enacted legislation that will keep more people behind bars longer, despite decades of evidence that such policies don’t enhance public safety.
Upward trends in prison and jail populations in 2022
Prisons
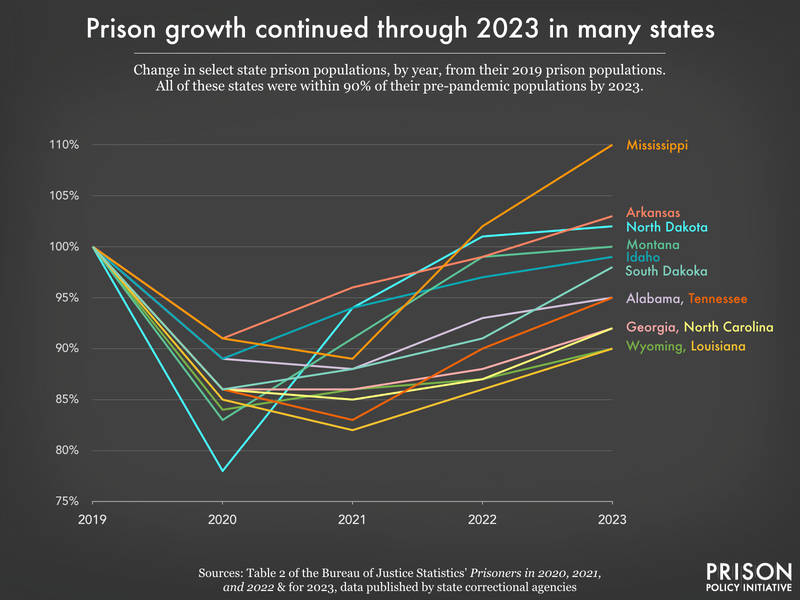
The new BJS data show that the total national prison population grew by over 2%, with 42 states and the federal Bureau of Prisons (BOP) incarcerating more people at the end of 2022 than 2021. In 14 states, the prison population grew by 5% or more,1 with just 9 states (mostly in the South) and the BOP accounting for 91% of all prison growth nationwide.2 The number of imprisoned women grew proportionally more than the number of imprisoned men (up 5% compared to 2%). At the end of 2022, 16 states held 90% or more of their pre-pandemic (2019) prison populations.
Just like the prison population changes we saw during the early and mid-pandemic (2020 and 2021), these increases were driven by changes in admissions more than anything else: 11% more people — about 48,000 more — were sent to prison in 2022 than in 2021. One narrow silver lining from this update: The number of people released from prisons increased for the first time since 2015; unfortunately, this was only a tiny increase of 1% compared to 2021. (As we recently reported, parole boards have been approving fewer people on discretionary parole in recent years, and compassionate release systems are woefully under-utilized.)
Local jails
Local jail populations grew at an even faster pace than prisons in 2022; jails held 4% more people at the end of June 2022 than at the end of June 2021.3 The women’s jail incarceration rate grew 9% compared to 3% for men, and Black, American Indian or Alaska Native, and Native Hawaiian or Pacific Islander4 rates all rose proportionally more than white and Hispanic jail rates.
As with prisons, jail growth was driven by a nearly 7% increase in admissions over last year. The pretrial population was almost back to its full pre-pandemic size (at 97%); more than 70% of people in jail had not been convicted of a crime. Another contributing factor to jail growth: the use of jail detention as a response to probation violations, up 5% compared to 2021. During the pandemic, many jurisdictions reduced their use of jails for punishing these typically low-level, noncriminal violations, but it appears that costly practice is “back to normal.”
A preliminary look at 2023 and beyond: Prison and jail populations continue to grow
In an effort to see whether the growth trend in jail and prison populations has continued since the BJS collected data in 2022, we looked for more recent data. While the data we found are neither complete nor perfectly comparable to those published by the BJS,5 we were able to look at year-to-date 2023 jail data from the Jail Data Initiative and at 2023 prison population data published by 42 states and the federal Bureau of Prisons (BOP). (For the 2023 prison data we found, see the Appendix table.)
What we found was troubling but not surprising:
- The jail data, collected from 942 jails across the U.S., show another modest (0.7%) increase in the average daily population in 2023 compared to 2022.6
- In two-thirds (28) of the 43 prison systems for which we found more recent prison data, it appears that even more people were incarcerated in 2023, with at least six states again showing increases of 5% or more over their 2022 populations.7
- At least two of the eight states where prison populations shrank in 2022 showed increases in 2023 prison populations; in Massachusetts and Arizona, the growth in 2023 erased the population drops in 2022.

Explaining recent prison and jail growth
It wasn’t crime
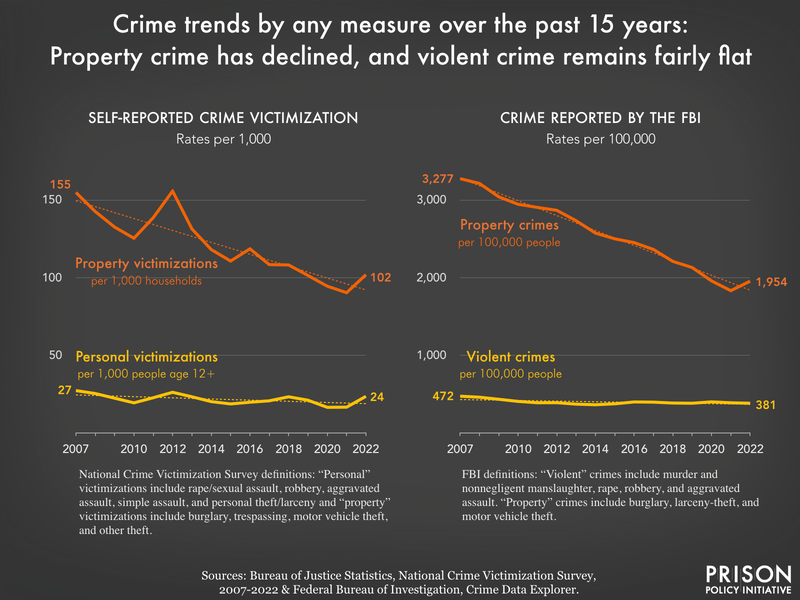
There’s been a lot of ink spilled about relatively modest changes in crime trends over the past few years, but nationally, total crime has remained near historic lows. While the specific factors that influence changes in prison and jail populations vary from place to place and from year to year, we conclude that “rising crime” is among the worst explanations for the growth of incarcerated populations over the past couple of years.
In considering this possibility, we looked at national crime victimization data as well as officially reported crime data.8 We see that the rate at which people reported any personal victimization in 2022 (23.5 per 1,000 people aged 12 or older) was almost exactly what it was five years ago, before the pandemic. Similarly, when we look at crime statistics reported by the FBI over a timeframe longer than one or two years, the rate of violent crime has held remarkably steady (and actually declined). In general, the fluctuations that have made headlines are within the range of what we have observed for the past 15 years or so. We see a similar story with property crime (with the exception of auto theft), which has also remained near its historic low, and is trending more steeply downward overall:

Because we are attempting to uncover trends beyond 2022 in this briefing, we also considered preliminary 2023 crime data released by the FBI in advance of its official annual estimates. For this, we turned to crime analyst Jeff Asher’s recent analysis of the available data. Asher concludes:
“Murder plummeted in the United States in 2023, likely at one of the fastest rates of decline ever recorded. What’s more, every type of [FBI] Uniform Crime Report Part I crime with the exception of auto theft is likely down a considerable amount this year…. The quarterly data in particular suggests 2023 featured one of the lowest rates of violent crime in the United States in more than 50 years.”
We won’t know how accurate Asher’s analysis is for almost another year, when the FBI releases the 2023 year-end data, but we agree that all signs point to crime continuing to trend downward. Of course, incarceration trends do not track directly with crime trends, anyway; they have more to do with how law enforcement, prosecutors, and judges choose to police and punish certain people, places, and behaviors — and how efficiently they can do so.
Changes in court processes
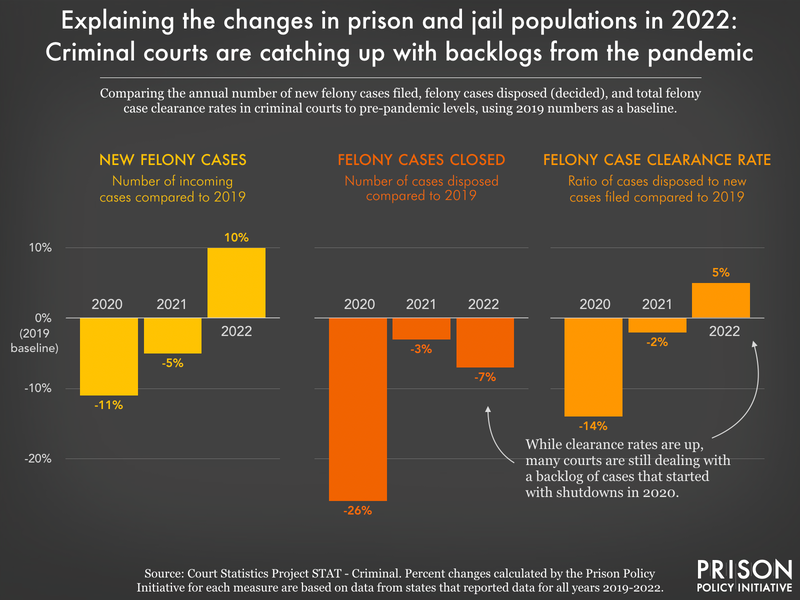
The 2022 increase in incarceration is actually exactly what we have been anticipating since the dramatic drops we observed early in the pandemic. When populations shrank in 2020 and 2021, we noted that court data showed what happened when courts suspended jury trials and other operations to slow the spread of COVID-19: The number of incoming (new) cases dropped, dispositions (decisions) dropped, and overall case clearance rates (the ratio of new to disposed cases) dropped, creating massive backlogs in the court system. This was a major reason that prison admissions fell so dramatically in the early pandemic.
To see if these data could explain the increase in admissions in 2022, we revisited the same data source, and found that all of those measures have more or less recovered from the slowdowns. Many court systems are still not fully caught up, but by 2022, they had resolved much of the backlog, which in turn caused the shift of many people from pretrial status to disposition, sentencing, and ultimately, admission to jail or prison.

Indeed, when we looked through individual states’ own interpretations of their 2022 population changes, most cited slowdowns and backlogs in the court system:
- Virginia: “From mid-March to mid-May 2020, an emergency order issued by the Chief Justice of the Supreme Court of Virginia suspended all non-essential and nonemergency proceedings in the state’s courts. During that time, significantly fewer sentencing hearings were held, resulting in fewer offenders being sentenced to a prison term. Reports suggest that court caseloads have not returned to pre-COVID levels.” (October 2022)
- Wisconsin: “Populations have grown significantly in the past several months as courts are working to address the backlog of cases incurred during the pandemic.” (June 2023)
- Michigan: “…[I]t is projected the prison population will continue rebounding through 2024 due to processing of the court backlog.” (November 2023)
- Rhode Island: “[The Rhode Island Judiciary spokesperson] noted that ‘over the last year the courts were still hearing cases that were delayed or carried over due to COVID-19 procedures and protocols….’” (December 2023)
- Minnesota: “Now, as courts catch up, the prisons are filling to levels not seen in about four years.” (March 2023)
State prison systems and the BOP predict future growth
We also found documents showing that at least 22 states and the federal Bureau of Prisons (BOP) have calculated projections for their prison populations, and they almost uniformly predict further growth. Nineteen states and the BOP expect to incarcerate more people in the years ahead. Only California, Hawaii, and New Mexico expect to incarcerate fewer people in the foreseeable future — and even then, New Mexico anticipates a slight increase in its incarcerated women’s population. (For a list of reports with projections, see the Projections Appendix table.)

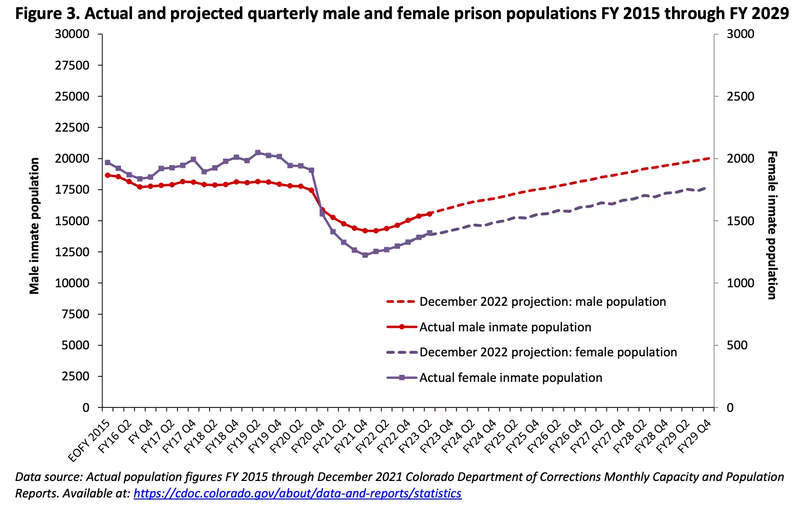
This example of a prison system’s population projections, from Colorado, shows that correctional authorities expect the male prison population to return to its pre-pandemic (2019) size by 2026; the report also shows the total population is expected to return to its pre-pandemic size by 2027.
The explanations offered by the states that predict further prison growth share a common theme: in addition to courts catching up with any lingering backlogs, they point to recent changes in legislation that will lead to longer sentences. New laws enacted in the past couple of years have increased penalties for some offenses, created new felony offenses, and made it harder to shorten excessively long sentences.
A Wisconsin report puts this plainly: “one additional potential factor that may influence the population projection… is 2021 enacted legislation, which increased penalties and created additional crimes.” The Oregon Office of Economic Analysis was more specific, pointing to a law passed in 2019 that made it easier to convict defendants of unlawful use of a vehicle, which had resulted in an additional 92 people in the annual prison population so far. While we couldn’t find projections for Tennessee, advocates offered similar explanations for the state’s current prison growth: the “Truth in Sentencing” bill enacted in 2022 put the possibility of parole or early release out of reach for many people, even though the Sentencing Commission determined sentence lengths “with the understanding that people would be paroled.” As a result, people are now serving sentences much longer than intended in the original sentencing laws.
Of course, projections are often wrong, but these reports give us some insight into how state correctional and budgetary agencies are contending with the specter of “tough on crime” politics and policy changes. Having seen the results in the 1980s and 90s, these projections may not be far off.
Returning to ‘business as usual’
The increase in incarceration in 2022 was the predictable outcome of (a) the criminal legal system return to “business as usual” and (b) the return of 1980s- and 90s-style “tough on crime” legislation. It was not caused by a crime wave. We can expect further growth in prison and jail populations unless states and localities redouble their efforts to safely reduce incarceration through criminal legal system reforms such as abolishing cash bail, eliminating incarceration for lower-level crimes (including non-criminal violations of probation and parole), shortening sentence lengths and making those changes retroactive, and expanding access to earned early release and discretionary parole. State and local governments must also make greater investments in strategies that we know protect people from criminal legal system contact: reinvesting in communities impacted by crime, with a focus on jobs, housing, education, and access to community-based mental health and substance use treatment.
Appendix tables
Prison population projections and sources
State and federal prison populations 2019-2023 and sources
Footnotes
-
The states where prison populations grew by 5% or more in 2022 include: Mississippi (14%), Montana (9%), Colorado (8%), Tennessee (8%), Minnesota (8%), North Dakota (8%), Rhode Island (the “unified” prison and jail population grew by 7%), Kentucky (6%), Connecticut (the “unified” population grew by 6%), Maine (6%), Vermont (the “unified” population grew by 6%), Alabama (5.5%), Florida (5%), and Louisiana (5%). Texas’ prison system grew by 4% but this represented the largest number of additional incarcerated people (almost 5,900) in any one state in 2022. ↩
-
The federal Bureau of Prisons accounted for 8% of all prison growth in 2022. Nine states accounted for 83% of all growth: Texas (accounting for 23% of the total increase), Florida (17%), Mississippi (10%), Tennessee (7%), Georgia (6%), Alabama (6%), Colorado (5%), Louisiana (5%), and Kentucky (5%). ↩
-
The Bureau of Justice Statistics’ annual prison and jail data collections use different reference dates. The prison data typically reflect counts at year-end, or December 31, while the jail data use counts collected at mid-year, on the last weekday in June (typically June 30). Therefore the 2022 prison data cover the 2022 calendar year, while the jail data cover the 12-month period from July 1, 2021 to June 30, 2022. ↩
-
Concerningly, the Native Hawaiian/Pacific Islander jail incarceration rate increased by 51% in just one year, and surpassed the white rate for the first time since at least 2010 (we couldn’t locate rates for earlier years). ↩
-
We were only able to locate 2023 data from 42 states and the federal BOP, and the reference dates for these data vary quite a bit. Additionally, none are “year-end” data that would be comparable to what the BJS collects. The exact populations included in these counts may also vary from the “jurisdictional” population counts that we compared them to, published by the BJS. ↩
-
We examined daily jail populations collected by the Jail Data Initiative, which uses web-scraping to collect and aggregate daily jail information from online jail rosters. We compared year-to-date 2023 data with data for the same period in 2022 (covering the period of January 1 to November 30 for each year), from the same sample of 942 jails that had available data for those dates. As a point of comparison, the BJS jail data and estimates are based on a sample of about 900 jails as well. We were not able to create estimates of the total national jail population that would be comparable to the Bureau of Justice Statistics’ estimates, due to the limited data provided in jail rosters, but instead compared the raw numbers from this sample for each year to get an idea of the relative (percent) change. ↩
-
As of November 2023, the prison populations of Mississippi and South Dakota had grown about 8% since 2022; as of October, Tennessee’s prison population had grown 5%; and as of December, the prison populations of North Carolina, Wisconsin, and New York had also grown by 5%. ↩
-
We used both indicators of crime — self-reported victimization data and the more frequently-referenced FBI measures of reported crime — for two main reasons. First, the FBI’s data collection method has changed in recent years, and as a result fewer law enforcement agencies have submitted data (83% in 2022 compared to 95% or more before the change to the new system). That has made the annual FBI crime estimates less reliable in the last few years. Secondly, many crimes go unreported to police. Using data from a nationally representative survey that asks people about their experiences of crime victimization in the past year helps to fill that under-reporting gap. This is not a perfect substitute, since it necessarily excludes homicides and doesn’t capture crime that targets businesses or public property, for example. But for the types of crime that capture headlines (i.e., interpersonal violence, theft, burglary, etc.), the victimization data offer a much more reliable picture of people’s experiences. ↩


