States of Incarceration: The Global Context 2016
By Peter Wagner and Alison Walsh
June 16, 2016
Press Release
This report is has been updated with a new version for 2024.
Louisiana has been called “the world’s prison capital. The state imprisons more of its people, per head, than any of its U.S. counterparts. First among Americans means first in the world.”1 But in the global context, how far behind are the other 49 states, really? This report finds that the disturbing answer is “Not very far.”
Rates calculated per 100,000 people. Read more about the data.
Figure 1. This graph shows the number of people in state prisons, local jails, and federal prisons from each state and D.C. per 100,000 people in that state or territory and the incarceration rate per 100,000 in all countries with at least a half million in total population. This graph shows that the District of Columbia has a slightly higher incarceration rate than Louisiana and that every state in this country is more likely to incarcerate its residents than almost every other nation on the planet.
Around the globe, governments respond to illegal activity and social unrest in different ways. Here in the United States, policymakers in the 1970s made the decision to start incarcerating Americans at globally unprecedented rates. The decades that followed have revealed that the growth in the U.S. prison population can be more closely attributed to ideological policy choices than actual crime rates.2 The record also shows that our country’s experiment with mass incarceration has not managed to significantly enhance public safety, but instead has consistently and disproportionately stunted the social and economic wellbeing of poor communities and communities of color for generations.3
In the above graphic, we charted the comparative incarceration rates of every U.S. state and territory alongside the world’s nations.4 While there are certainly important differences between how U.S. states handle incarceration, placing each state in a global context reveals that incarceration policy in every region of this country is out of step with the rest of the world.
Making comparisons
The U.S. incarcerates 693 people for every 100,000 residents, more than any other country. In fact, our rate of incarceration is more than five times higher than most of the countries in the world. Although our level of crime is comparable to that of other stable, internally secure, industrialized nations,5 the U.S. has an incarceration rate that far exceeds every other country.
Nearly all of the countries with relatively high incarceration rates share the experience of recent large-scale internal conflict. But the United States, which has enjoyed a long history of political stability and hasn’t had a civil war in over a century and a half, tops the list.
If we compare the incarceration rates of individual U.S. states and territories with that of other nations, for example, we see that 32 states have incarceration rates higher than that of Turkmenistan, which is the nation with the second highest incarceration rate in the world after the United States. The U.S. State Department criticizes the human rights rights record of Turkmenistan’s “authoritarian government”, but the District of Columbia — where the U.S. State Department is based — has an incarceration rate more than twice that of Turkmenistan.
Thirty-eight states lock up greater portions of their populations than El Salvador, a country that recently endured a civil war and now has one of the highest homicide rates in the world.6
Washington and Connecticut have slightly higher incarceration rates than Thailand, a country that underwent a military coup in 2014.
New Hampshire, the “Live Free or Die” state, has a comparatively low incarceration rate within the U.S., but its rate is just slightly higher than that of the Russian Federation. At one time, in the wake of collapse of the Soviet Union, the Russian Federation rivaled the U.S. for the highest incarceration rate in the world. An epidemic of tuberculosis in the overcrowded prisons, however, encouraged the Russian government to launch a major amnesty in 1999 that significantly lowered that country’s incarceration rate.7
New York and New Jersey have been actively working on reducing their prison populations, but those two states are almost tied with Rwanda, the nation with the 7th highest incarceration rate. Rwanda incarcerates so many people (434 per 100,000) because thousands are sentenced or awaiting trial in connection with the 1994 genocide that killed an estimated 800,000 people.8
Six of the U.S. states with the lowest incarceration rates — Utah, Minnesota, Rhode Island, Maine, Vermont, and Massachusetts — have higher incarceration rates than countries that have experienced major 20th century social traumas, including several former Soviet republics and South Africa. The two U.S. states that incarcerate the least are Vermont and Massachusetts, but if those states became independent nations, they would rank as the 11th and 12th greatest users of incarceration on the planet.
Conclusion
These data reveal that even the U.S. states that incarcerate the smallest portion of their own citizens are out of step with the larger community of nations. As U.S. states continue to reevaluate their own hefty reliance on incarceration, we recommend that they look to the broader global context for evidence that incarceration need not be the default response to larger social problems.
Read about the data and methodology
This report relies on two unique datasets:
- For the 50 U.S. states and the District of Columbia, we calculated incarceration rates per 100,000 total population that include people in federal prison from that state, people in state prison in that state, and people in local jails in that state. The raw data for the states and D.C. are made available in a data appendix and the individual sources were as follows:
- Federal prisons: While federal prosecutions are nominally the result of federal policy, we attributed federal convictions to individual states in part because federal prosecutions are of state residents and in part because federal prosecutions are often coordinated with state prosecutors and state law enforcement.
This data — prepared for our report Correctional Control: Incarceration and supervision by state — has been years in the making. We developed a ratio of the state of legal residence for the Bureau of Prisons population as of April 3, 2010 and applied it to the total Bureau of Prisons population as provided on the Bureau of Prisons population statistics website on April 26, 2016. The raw data behind our ratio of the state of legal residence is from April 3, 2010 because we originally collected this data in the context of our research on prison gerrymandering. The data was received from the Bureau of Prisons via a Freedom of Information Act request made with the assistance of U.S. Senator Roland Burris. When developing the ratio of state of legal residence, we ignored those convicted in U.S. territories such as Puerto Rico, and we applied the known state and D.C. ratios to the group of defendants for whom the state of legal residence was unknown. For the total Bureau of Prisons population, we included those under BOP custody and those in privately managed facilities and excluded those in “other types of facilities.” We used January 1, 2016 population estimates for calculating the rates. - State prisons: Prisoners in 2014, Table 2 reporting data for December 31, 2014. We used January 1, 2015 population estimates for calculating the rates.
- Local jails: We used the sum of the confined population from the Annual Survey of Jails reporting data for June 30, 2014. We used July 1, 2014 population estimates for calculating the rates. To avoid double counting people held in local jails on behalf of state and federal prison systems, we removed state and federal prisoners being held in local jails using Prisoners in 2014, Table 9 reporting data for December 31, 2014.
Population data: In order to calculate rates per 100,000 total population we used or made population estimates that were as close to the date of our source data as possible. For example, for June 30 correctional population figures, we used July 1 Census Bureau estimates. For December 31 correctional population figures, we created January 1 estimates by averaging the nearest July 1 estimates, and for January 1, 2016 estimates, we added the population change during 2014 to our January 1, 2015 population estimate. As a benefit to other researchers, we have made this data available in a population appendix.
- Federal prisons: While federal prosecutions are nominally the result of federal policy, we attributed federal convictions to individual states in part because federal prosecutions are of state residents and in part because federal prosecutions are often coordinated with state prosecutors and state law enforcement.
- For the incarceration rates of countries, we used the most recent data available from the Institute for Criminal Policy Research’s World Prison Brief on June 9th, 2016. For this report, we decided to accept the World Prison Brief’s definition of country, choosing to exclude countries only for reasons of population size as described below. (We will explore, for future versions of this report, the feasibility of collecting data for Puerto Rico that would be fully compatible with that of the 50 U.S. states and the District of Columbia.)
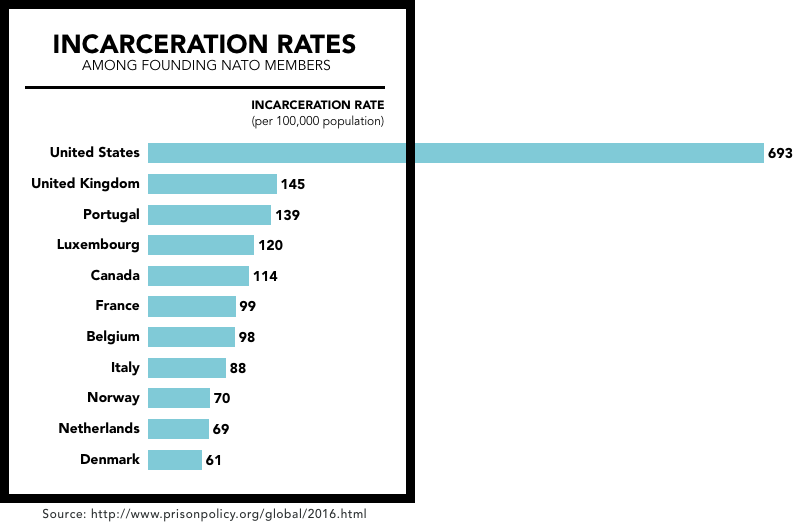
To make the comparisons more meaningful, we’ve chosen to only include nations with a total population of at least 500,000 people. The United Kingdom figure in the graph about incarceration rates among NATO founding members is calculated from the total incarcerated and total population as reported on June 13, 2016 in the World Prison Brief for the individual nations of England & Wales, Northern Ireland and Scotland.
See the footnotes
Cindy Chang, “Louisiana is the world’s prison capital,” The Times-Picayune, May 13, 2012. Accessed June 14, 2016 from: http://www.nola.com/crime/louisiana_is_the_worlds_prison.html. ↩
For an in-depth discussion of the limited relationship between crime rates and incarceration rates, see The Crime Drop in America, Alfred Blumstein and Joel Wallman, eds. (New York: Cambridge University Press), 2000. ↩
See, eg. Invisible Punishment: The Collateral Consequences of Mass Imprisonment, Marc Mauer and Meda Chesney-Lind, eds. (New York: The New Press, 2002); Bruce Western and Becky Pettit, Collateral Costs: Incarceration’s Effect of Economic Mobility, (D.C.: Pew Charitable Trusts), 2010. Accessed June 14, 2016 from: http://www.pewtrusts.org/~/media/legacy/uploadedfiles/pcs_assets/2010/collateralcosts1pdf.pdf. ↩
To make the comparisions more meaningful, we’ve chosen to only include nations with a total population of at least 500,000 people. ↩
Jan van Dijk, John van Kesteren, Paul Smith, Criminal Victimisation in International Perspective: Key findings from the 2004-2005 ICVS and EU ICS (The Hague: Book Juridische uitgevers), 2007. Accessed June 14, 2016 from: http://www.unicri.it/services/publications/ICVS2004_05report.pdf See especially Chapter 2. ↩
World Bank, "Intentional homicides (per 100,000 people)" webpage. Accessed June 13, 2016 from: http://data.worldbank.org/indicator/VC.IHR.PSRC.P5?order=wbapi_data_value_2013+wbapi_data_value+wbapi_data_value-last&sort=desc ↩
See BBC News, Amnesty for Russian prisoners, May 26, 2000 and see ITAR-TASS Russian MPs to consider amnesty bill in final reading, December 13, 2013 for the fact that there have been 18 successive amnesties in recent Russian history. (Accessed on June 14, 2016.) ↩
Genocide statistic from United Human Rights Council, “Genocide in Rwanda” webpage. Archived version of May 21, 2016 accessed on June 14, 2016 from: http://web.archive.org/web/20160521031549/http://www.unitedhumanrights.org/genocide/genocide_in_rwanda.htm. ↩
The Institute for Criminal Policy Research’s World Prison Brief (see methodology) provides incarceration rates for the individual nations of England & Wales, Northern Ireland and Scotland. Because the multi-country United Kingdom is a NATO member, we aggregated the Institute for Criminal Policy Research's figures for the prison and national populatons for each member country to calculate the United Kingdom-wide figure for this comparison. ↩
Iceland is a founding member of NATO but is excluded from this report, along with all other nations that have a total population of under 500,000 people. For the record, however, Iceland's incarceration rate is 45 per 100,000, lower than even Denmark’s. ↩
Acknowledgements
This report was made possible thanks to the generous support of individuals across the country who support justice reform and all of the researchers, writers and designers who went before us. Specifically, this report follows in the model of our 2014 report of the same name that was written and designed by Peter Wagner, Leah Sakala, and Josh Begley. This report relies on state incarceration data prepared for Correctional Control: Incarceration and supervision by state by Bernadette Rabuy and Peter Wagner, and the national incarceration rate data collected and published in the Institute for Criminal Policy Research's World Prison Brief. This project could not have existed without these supporters and datasets, but responsibility for any errors or omissions is solely the responsibility of the authors of this report.
About the authors
Peter Wagner is an attorney and the Executive Director of the Prison Policy Initiative. Some of his recent work includes Mass Incarceration: The Whole Pie 2016 and Tracking State Prison Growth in 50 States. He is @PWPolicy on Twitter.
Alison Walsh is the Policy & Communications Associate at the Prison Policy Initiative and a graduate of Vassar College, where she participated in the Greenhaven Prison Program. She has previously worked with the Fair Housing Council of Oregon and the Massachusetts Fair Housing Center.


