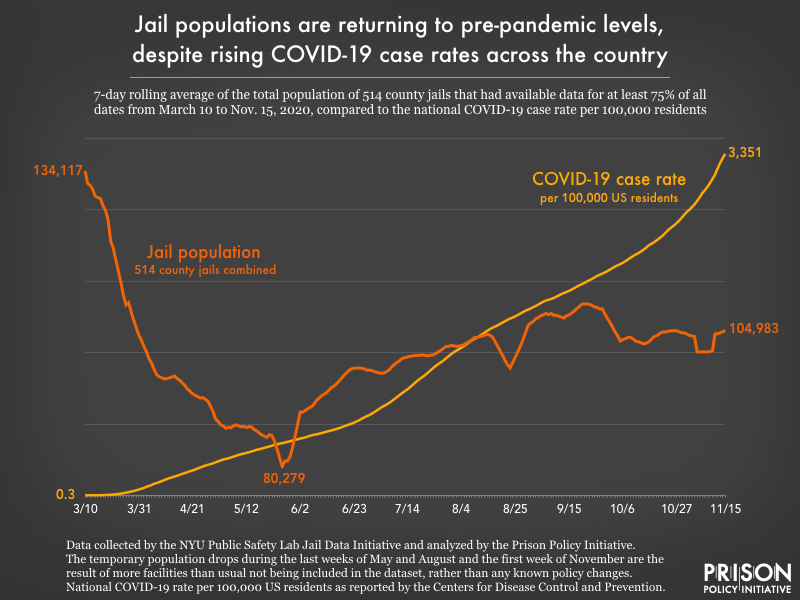
Data Source: Data collected by the NYU Public Safety Lab Jail Data Initiative and analyzed by the Prison Policy Initiative. The temporary population drops during the last weeks of May and August and the first week of November are the result of more facilities than usual not being included in the data set, rather than any known policy changes. National COVID-19 rate per 100,000 U.S. residents as reported by the Centers for Disease Control and Prevention. (Graph: Emily Widra, 2020)
This graph originally appeared in As COVID-19 continues to spread rapidly, state prisons and local jails have failed to mitigate the risk of infection behind bars.
Events
- April 15-17, 2025:
Sarah Staudt, our Director of Policy and Advocacy, will be attending the MacArthur Safety and Justice Challenge Network Meeting from April 15-17 in Chicago. Drop her a line if you’d like to meet up!
Not near you?
Invite us to your city, college or organization.


