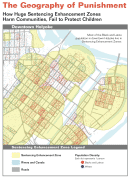
The Geography of Punishment:
How Huge Sentencing Enhancement Zones Harm Communities, Fail to Protect Children
by Aleks Kajstura, Peter Wagner, and William Goldberg
Prison Policy Initiative
July 2008
Section:
Methodology
Collection of spatial data
Massachusetts General Laws Chapter 94C, Section 32J declares an enhanced sentence for certain drug offenses that take place within 1,000 feet of the “real property comprising a public or private accredited preschool, accredited headstart facility, elementary, vocational, or secondary school” and within 100 feet of a “public park or playground.” In order to analyze the populations affected by the statute, we had to identify the properties that fit the above criteria in the summer of 2006 and find their property lines. We then drew the lines of 100 or 1,000 feet around each location and used 2000 Census data, the most recent available, to determine the population inside and outside the zones.
The electronic publications of the Office of Geographic and Environmental Information (MassGIS), Commonwealth of Massachusetts Executive Office of Environmental Affairs provided an important starting point for much of our work. MassGIS publishes a point file for all of the schools in the state. At the time of our research, the schools layer was as of 2004, so we used information from each town’s website to remove closed schools and add new schools so that our database would reflect the schools in existence in the summer of 2006.
Parks were identified by a combination of the MassGIS Protected and Recreational Open Space layer, an Arrow Street Western Massachusetts Atlas and Google Maps. Each potential facility was examined for ownership and intended use before a decision was made to include that park in our analysis. As a starting point for identifying the location of parks, we used “Protected and Recreational Open Space” layer files from MassGIS.[33] We used color orthophotography images from MassGIS[34] to check the reported open spaces. We also used a variety of town websites, atlases and online maps (such as Google Maps and Mapquest) when the MassGIS files did not provide the necessary information for our purposes.
We created a map of Head Start facilities from a list of street addresses published by the U.S. Department of Health and Human Services[35]. The statute does not specify who must accredit day care centers, so we mapped only group and school age child care centers accredited by the largest private accreditation organization, the National Association for the Education of Young Children. However, if other accreditation organizations are active in Massachusetts besides NAEYC, we would not have known to include them in our research. While the legislature likely meant for the law to apply to the larger universe of state “licensed” facilities, we decided to use only facilities that met the legislature's stricter definition. We initially mapped all licensed facilities in the state, and found that, consistent with the “urban effect” discussed in this report, the inclusion of these facilities would have magnified our findings of racial disproportionality. While we thought it reasonable to include these facilities, given the ambiguities in the statute we decided to err towards under-inclusion.
We used a variety of sources to develop polygon shapefiles of each protected place. The property lines of many schools were reflected in the MassGIS Protected and Recreational Open Space Layer. The cities of Holyoke and West Springfield generously shared a polygon file of each parcel of property in the city. The cities of Springfield and Westfield make property line data available in online GIS systems, and we were able to recreate the property lines shown in our Arcview 9.1 system. Where parcel ownership data was available, we were able to confirm whether adjoining parcels were owned by the school and were able to include them in our analysis as being subject to the Massachusetts school zone statute. As a last resort, we used the high-resolution aerial photography published by MassGIS to develop our property line database.
Census data, our terminology on urban, rural, race and ethnicity, and corrections made to U.S. Census data
Several methodological quirks in how the U.S. Census counts the population complicated our analysis of how enhancement zones disproportionately impact minority communities.
First, the Census Bureau considers Hispanic/Latino to be an ethnicity and not a race, so Latinos are also counted as Black, White, or any other race. Second, the Census Bureau has recently allowed people to identify as more than one race. Because we did not want to overestimate the impact of the zone laws (for example, counting a Black Latino as two separate people) we used the following terms and data sources, inspired by the U.S. Office of Management and Budget’s Directive 15, which offered guidance on how to aggregate race and ethnicity data for civil-rights enforcement purposes.
Where this report uses the term “White,” we used Census Bureau data for “Not-Hispanic Whites Alone,” published in Summary File 1, Table P4. Where this report uses the term Black, we used the Census Bureau data for “Not Hispanic: Black or African American alone or in combination with one or more other races,” published in Summary File 1, Table P10. Our data for Latinos comes from Table P4 and total population from Table P1, which are both in Summary File 1.
The Census Bureau classifies each person as living in an urban or rural area in Summary File 1, Table P2. Urban areas are “densely populated” areas with at least 2,500 people. As shown in Appendix D, 9 cities or towns were at least 90% urban, and 9 cities or towns were at least 90% rural. We used this Census method of classification, rather than the number of people who live per square mile, because the latter method skews the results of both rural and urban places with large uninhabitable areas, such as military runways and parks.
Our educational attainment data was drawn from the U.S. Census Summary File 3, Table P37 and reflects adults 25 years and older. So that people who stopped their education prior to high school were properly included as lacking a high school diploma or GED, we aggregated all educational levels below a high school diploma/GED and all genders. Our poverty data is based on income in 1999 and published by the U.S. Census in Summary File 3, Table P87.
Despite the Massachusetts definition of “inhabitant” prohibiting such a designation, the Census Bureau counts incarcerated people as if they were legal residents of the place where they are incarcerated. People in prison are not part of the communities where they are incarcerated, and given the disproportionate incarceration of Blacks and Latinos in Massachusetts, the enumeration of prisoners in the House of Corrections has the potential to skew this study. We therefore removed the correctional populations from the underlying Census data.
The Census Bureau publishes counts of Correctional Facilities in Summary File 1, table P37, down to the block level, and the race and ethnicity of the group quarters population (including correctional facilities) in Summary File 1, tables PCT17A through PCT17I, down to the tract level. With these tables, we were able to determine race and ethnicity of the incarcerated population and subtract them from individual blocks. The population we removed from the Census data is below:
| Town | Tract | Block | P001001 Total population: Total | P004003 Total population: Not Hispanic or Latino | P004005 Total population: Not Hispanic or Latino; Population of one race; White alone | P010004 Total races tallied: Not Hispanic or Latino; Black or African American alone or in combination with one or more other races | |
|---|---|---|---|---|---|---|---|
| Western Mass. Correctional Alcohol Center | Springfield | 801102 | 2005 | 228 | 188 | 162 | 26 |
| House of Corrections | Ludlow | 810414 | 9008 | 1,464 | 513 | 171 | 337 |
| House of Corrections | Ludlow | 810414 | 9013 | 196 | 77 | 48 | 29 |
We did not adjust the poverty data, because the U.S. Census Bureau’s poverty calculations are based on households from which people in prison are already excluded. The educational attainment data was not adjusted, because we were unable to identify a methodology that would subtract only the prison population and none of the surrounding resident population from the Ludlow totals. The urban/rural data was not adjusted, because doing so would not have affected our results.
Data display and calculation
To illustrate how Massachusetts’ enhancement zone law affects minority populations, we used the “display by dot density” feature of ArcView 9.1 to estimate the distribution of the population in each Census block. The Census Bureau collects actual addresses, but, for confidentiality reasons, only publishes the data aggregated to units of geography called “blocks” and “blockgroups.” In urban areas, a “block” tends to be a city block, but in more rural areas, the blocks can be much larger. As it is impossible to determine exactly where in a Census block someone lives, we used a dot-density map to display the concentrations of different populations. We aggregated our data for Blacks and Latinos and illustrated each Black or Latino person as one very small red dot. Each White person is illustrated as a very small blue dot. We made the borders of each block invisible and told the software to randomly distribute the requisite number of dots in each block. The enhancement zones display was created with a multiple-step process. Once we had built a polygon shapefile with each type of protected place, we used the Arcview 9.1. buffer tool to create new polygons of 100-foot buffers around parks and 1,000-foot buffers around other statutory places. We used the dissolve command to create one polygon shapefile of the combined zones and then clipped the shapefile to the county’s borders.
Because many Census Blocks were not entirely inside or outside a zone, our zone impacts were calculated using a similar approximation method. We calculated the area in square meters of each Census block, and then used the “union” feature in Arcview 9.1 to split each Census block into “zone” and “not zone” portions. We then calculated the area in square meters of each new polygon. We removed the Census Block portions that were outside the zones and divided the size of the new polygons with the initial area measurement. As a result, each piece of a Census Block was given a numeric percentage reflecting how much of the Census Block piece was of the original block. By multiplying this percentage by Census data for that block, we could develop estimates of the population within the zones.
Similar methods were used to calculate the population that would be inside enhancement zones if the zones were redrawn as 100-foot distances around only schools and parks. Poverty and educational data is only available at the larger blockgroup level, so this methodology was applied a third time over a polygon shapefile of blockgroups published by the U.S. Census Bureau.
Footnotes
[33] Available at http://www.mass.gov/mgis/osp.htm.
[34] Available at http://www.mass.gov/mgis/colororthos2001.htm.
[35] Available at http://eclkc.ohs.acf.hhs.gov/hslc/HeadStartOffices.
Recommended Reading:

The unmet health needs of people in prison
States fall far short of their duty to meet the health needs of incarcerated people.

All profit, no risk
The bail industry exploits cracks and loopholes in the legal system to avoid accountability, while growing its profits.

Compare your state's use of the prison to the world at large
Criminal justice policy in every region of the United States is out of step with the rest of the world.

Prison Gerrymandering Project
We are leading the movement to protect our democracy from the Census Bureau's prison miscount.