Prison Policy Initiative's new report, "States of Incarceration: The Global Context 2016," compares the incarceration rates of individual U.S. states to that of other countries.
June 16, 2016
FOR IMMEDIATE RELEASE: June 16, 2016
Contact:
Alison Walsh
awalsh [at] prisonpolicy.org
Easthampton, MA — How does your state compare to the international community when it comes to the use of incarceration? Not very well, says a new report and infographic by the Prison Policy Initiative.
“When compared against each other, some U.S. states appear to be far more restrained in their use of incarceration than high incarcerators like Louisiana,” said Peter Wagner, Executive Director of the Prison Policy Initiative and co-author of the report. “But all U.S. states are out of step with the rest of the world.”
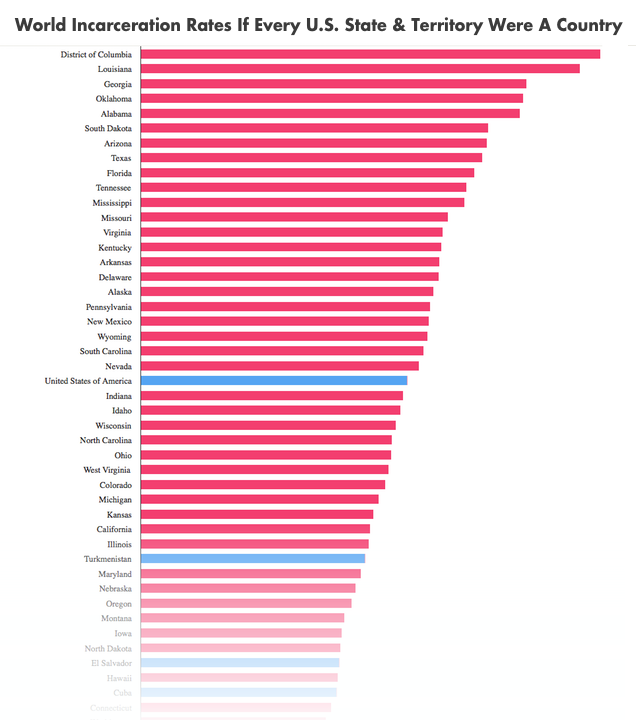
This report, “States of Incarceration: The Global Context 2016,” updates our 2014 briefing that, for the first time, directly situated individual U.S. states in the global context.
“Massachusetts and Vermont have the lowest incarceration rates in the U.S.,” said Alison Walsh, report co-author and Policy & Communications Associate. “Compared to Louisiana, these states look progressive. But if these states were independent nations, they would rank as the 11th and 12th greatest users of incarceration on the planet, following the United States and a group of nations whose recent history often includes wars, military coups and genocides.”
The report includes an interactive graphic showing the incarceration rates for individual U.S. states and the District of Columbia and all countries with a population of at least 500,000. The report also includes a separate graphic comparing the incarceration rates of the U.S. to several NATO nations.
“I hope that this data helps all states prioritize further criminal justice reforms. Lower incarceration rates are not only possible, in the rest of the world they are a reality,” said Wagner.
The report and infographic draw international figures on incarceration from the Institute for Criminal Policy Research’s World Prison Brief and state-level figures from the Bureau of Justice Statistics, the Bureau of Prisons and the U.S. Census Bureau.
The Easthampton, Massachusetts-based Prison Policy Initiative was founded in 2001 to expose the broader harm of mass criminalization and spark advocacy campaigns to create a more just society. The organization is most well known for sparking the movement to end prison gerrymandering and for its big picture data visualization “Mass Incarceration: The Whole Pie.”
The report, “States of Incarceration: The Global Context 2016,” is available at:
http://www.prisonpolicy.org/global/2016.html
Ohio follows in Massachusetts' footsteps by ending unnecessary driver's license suspensions.
by Alison Walsh,
June 15, 2016
In Ohio this week, Governor John Kasich signed a bill into law that allows judges to choose whether to suspend driver’s licenses for non-driving related drug offenses. Prior to this reform, these suspensions were mandatory.
The bill’s sponsor, Senator Bill Seitz, argued that the suspension policy created an unnecessary barrier to employment. The governor of Massachusetts cited similar concerns when he ended automatic license suspensions for drug offenses unrelated to road safety in March.
Several states, including Texas and New York, still enforce this outdated law, but momentum is on the side of reform. In Seitz’s words, “We’re not doing anything radical — we’re kind of catching up to the crowd.” Which state will be next?
Stay tuned for a Prison Policy Initiative report on the remaining states that have yet to repeal this regressive law.
Private prisons get all the attention, but the hidden truth is that many county jails are profiting off incarceration too.
by Peter Wagner,
June 9, 2016
Prisons owned and run by corporations that contract with state governments get far more attention than they deserve. But another huge provider of contractual prison services gets almost no attention whatsoever: local jails.
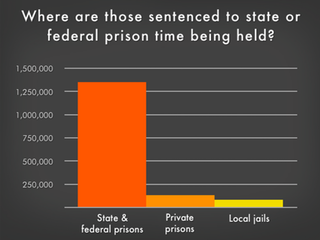
Yes, local jails. Nationally in 2014, 5.2% of those sentenced to prison were placed in county jails under contracts between state prison officials and local jails (compared to 8.4% with private prisons). In some states, this is big business for jails. In 2014, a whopping 51% of Louisiana’s state prison population was imprisoned in local jails. Or to say it another way, 75% of the jail cells in Louisiana parish (county) jails are used not for people serving jail sentences but are instead rented out to the state. And Louisiana isn’t alone:
| State |
Percent of jail beds rented to state/federal prisons |
| Louisiana |
75.5% |
| Mississippi |
55.1% |
| Kentucky |
45.6% |
| Arkansas |
41.3% |
| Tennessee |
30.8% |
| Oklahoma |
25.5% |
| Utah |
25.2% |
| Virginia |
25.1% |
| West Virginia |
25.0% |
| Texas |
19.5% |
| Idaho |
18.7% |
| Montana |
17.8% |
| Alabama |
15.7% |
| Minnesota |
14.5% |
| Georgia |
12.8% |
In 15 states, over 10% of the local jail population was made up of people serving state or federal prison sentences in 2013. In 9 states, it was at or over a quarter of the jail population, in Mississippi it was over half, and in Louisiana the number was over 75%. Nationwide, 12% of the local jail population is actually there under contract with state or federal authorities. These figures were calculated from two Bureau of Justice Statistics data sources, the Mortality in Local Jails and State Prisons Series and National Prisoners Statistics Series.
The profit motive produces alarming effects. Local sheriffs rely heavily on state money to pad their law enforcement budgets and, as a result, have no incentive to support reforms to reduce the incarcerated population. In fact, the opposite is often true.
 In Louisiana, sheriffs and wardens trade incarcerated people from parish to parish in an attempt to keep their jail beds full and the state money rolling in. It’s common for jail wardens to “make daily rounds of calls” to other parishes looking for incarcerated people to fill their beds when their jails are under-capacity. One Louisiana parish warden told The Times-Picayune, “I stay on the phone a lot, calling all over the state, trying to hustle a few.” Hustle a few incarcerated people, that is.
In Oklahoma, local sheriffs receive $27 per day for each person they hold for the state prison system, this makes up about 7% of some counties’ budgets. Sheriffs have gotten so dependent on the money from the state that they complained to the press when the prison system implemented reforms to reduce the state prison population.
And in Mississippi, in addition to the $29.74 per diem, the state “demands that local jails house state convicts who perform labor for free”. In some cases, incarcerated people perform city services, like picking up residents’ garbage. The Mississippi sheriffs see corporate private prisons as their direct competitors for a share of the declining number of people sentenced to state custody. The president of one county’s Board of Supervisors told the Huffington Post, “I think it’s political favors going around, the reason they’re doing that”, referring to his suspicion that state contracts were being given to private corporations rather than local jails.
In the end, the real harm is being done to those incarcerated. Local jails with profit motives are incentivized to house increasing numbers of people, without regard for services or educational programs for those incarcerated. The Times-Picayune reports that in Louisiana, those stuck in local jails on state contracts “subsist in bare-bones conditions with few programs to give them a better shot at becoming productive citizens.”
Incarcerated people find themselves locked in local jails for months, or even up to 10 years in Louisiana, unable to get access to the programs and services that may help them successfully reenter society. For this reason The Times-Picayune says, “Ask anyone who has done time in Louisiana whether he or she would rather be in a state-run prison or a local sheriff-run prison. The answer is invariably state prison.”
It is time to accept the counter-intuitive truth: sometimes the government profits off of mass incarceration.
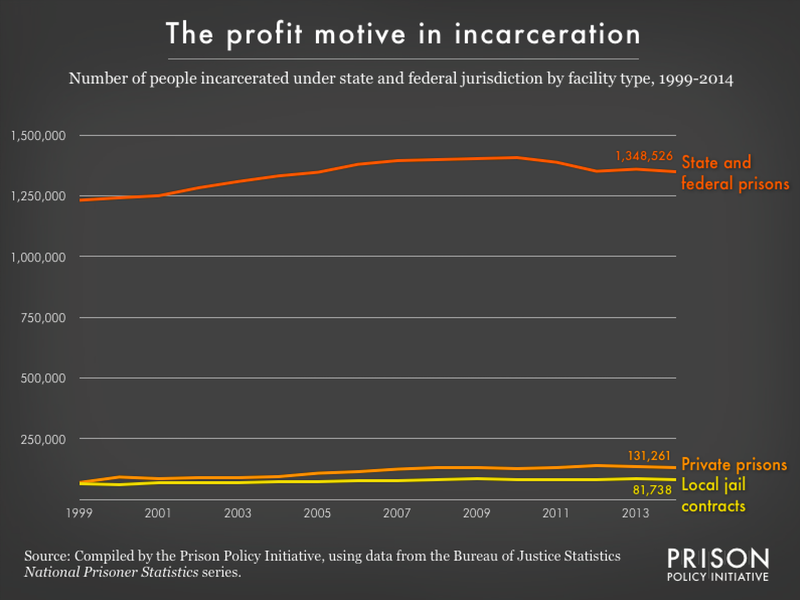 Since 1999, private prisons and local jails have housed roughly the same number of those serving state and federal prison sentences. But when those interested in justice reform talk about profiting off of mass incarceration, they almost always leave local jails out of the conversation.
A report by the EFF uncovers some alarming facts about a new "Tattoo Recognition Technology" research program that uses images obtained from incarcerated people.
by Alison Walsh,
June 7, 2016
An investigation by the Electronic Frontier Foundation has discovered that government scientists with the National Institute of Standards and Technology (NIST) are working with the FBI to develop automated “Tattoo Recognition Technology” for future use by police. Not only does this technology raise important civil liberties concerns, the Electronic Frontier Foundation (EFF) is objecting to how the data for this research was collected: from incarcerated people without their consent.
The digit rights advocacy group points out in a new report that NIST project leaders only submitted their research for ethical review after the experiments had concluded.
NIST’s Tattoo Recognition Technology program also raises serious questions for privacy: 15,000 images of tattoos obtained from arrestees and inmates were handed over to third parties, including private companies, with little restriction on how the images may be used or shared. Many of the images reviewed by EFF contained personally identifying information, including people’s names, faces, and birth dates.
If that wasn’t alarming enough, NIST researchers also failed to follow protocol for ethical research involving humans—they only sought permission from supervisors after the first major set of experiments were completed. These same researchers have also not disclosed to their supervisors that the tattoo datasets they are using to seed the experiments came from prisoners and arrestees. Under federal research guidelines, research involving prisoners triggers enhanced scrutiny and ethical oversight to prevent their exploitation. Instead, NIST and the FBI are treating inmates as an endless supply of free data. The EFF found that the Tattoo Recognition Technology research program violates existing federal ethics rules on experiments involving incarcerated people.
The lack of oversight is alarming, especially because there is a disturbing history of vulnerable populations being used for unsanctioned experiments that cause them harm. Past ethical abuses, like the infamous Tuskegee syphilis experiments on African-American men in the South and the brutal tests performed on men incarcerated at the Holmesburg Prison in Philadelphia, led to new rules to protect vulnerable populations from abuse. Research using incarcerated people now must be pre-approved by an Independent Review Board. That review didn’t happen here.
The EFF is calling on the government to immediately suspend the program, and for scientists to stop using images obtained from incarcerated people without their consent. This demand is particularly timely as the FBI and the NIST are about to launch the next stage of their research, which will involve the distribution of over 100,000 images.
Add your voice to the EFF’s campaign by visiting their Action Center and sending a message to the NIST that scientific ethics and human rights matter.
New report provides big picture of mass incarceration with pie charts for each state and D.C.
June 1, 2016
FOR IMMEDIATE RELEASE: June 1, 2016
Contact:
Bernadette Rabuy
brabuy [at] prisonpolicy.org
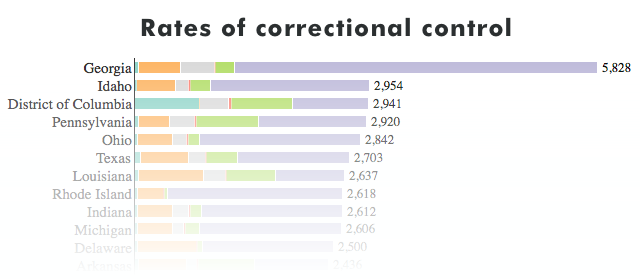
Easthampton, MA — Prisons are just one piece of the correctional pie. Some of the seemingly less punitive states are actually the most likely to put their residents under some other form of correctional control, finds a new report by the Prison Policy Initiative.
Correctional Control: Incarceration and supervision by state builds off of the Prison Policy Initiative’s popular report, Mass Incarceration: The Whole Pie, to provide the big picture of mass incarceration. “We often get requests for versions of the pie chart report for each state. Our new report responds to this request with over 100 graphs illustrating the breakdown of the criminal justice system in each state plus D.C.,” said co-author of the report, Peter Wagner. The report also includes an interactive chart that ranks each state and D.C. by rate of total correctional control, which includes incarceration, probation, and parole.
The report uncovers tremendous variations in the forms and rates of criminal justice control:
- Georgia’s rate of probation is more than double every other states’ rate of probation and greater than every other states’ total rates of correctional control.
- Rhode Island and Minnesota, two states with some of the lowest incarceration rates in the country, are among the most punitive when other methods of correctional control are taken into account.
- The capital of the “free world,” D.C., has a higher incarceration rate than any U.S. state and higher than any nation on the planet.
Correctional Control provides another metric for understanding where each state falls within the national landscape of mass incarceration and where state-based advocates may want to focus their attention. The authors of Correctional Control conclude that criminal justice reform strategies should aim to reduce the total number of people under correctional control rather than simply transfer people to other pieces of the correctional pie.
“As the movement to end mass incarceration continues to gain steam, it would be wise to include probation, the leading type of correctional control, in discussions of reform,” explained co-author of the report, Bernadette Rabuy. “Probation has the potential to be a powerful alternative to incarceration but, when used unnecessarily, serves only to widen the net and funnel more people into incarceration.”
The report and the 100+ graphs are available at: http://www.prisonpolicy.org/reports/50statepie.html
-30-
We created an animated GIF showing the growth of the unconvicted population in jails compared to those convicted
by Meredith Booker,
May 26, 2016
When talking about jails and jail growth, it’s really important to emphasize that what’s driving jail growth is the portion of those in jail that are unconvicted.
Peter made a graph for his article Jails matter. But who is listening?, and an animated version for the Detaining the Poor:
How money bail perpetuates an endless cycle of poverty and jail time report. But that image wasn’t something that could be shared on Twitter. Until now:
Detailed data sourcing can be found in our Mass Incarceration: The Whole Pie 2016 report.
Seven deadly sins: the problem with Bill Clinton's criminal justice legacy isn't one bill, or two or even three, but at least seven bills.
by Peter Wagner,
May 25, 2016
While many current and recent presidential candidates have called for ending mass incarceration and have been critical of the “Clinton crime bill,” their proposals have been short on specifics. Even more troubling however, is their narrow view — and that of many journalists — of Bill Clinton’s criminal justice legacy. The problem isn’t one bill, or two or even three but at least seven bills. (And we probably missed some. Please leave a discussion of bills we missed in the comments section below.)
Of course, some of the bills were so bad they have already been partially repealed by Congress, and most states have already formally rejected the offensive idea of using criminal records to deny hungry people food. And, of course, some of the provisions of some of the bills have since expired.
But here is our list of where a review of the criminal justice legacy of the Clinton era should begin:
- 1994: Violent Crime Control and Law Enforcement Act put 100,000 more police on the streets and created federal economic incentives for states to make their own laws more punitive. This law also made low-income incarcerated people ineligible for Pell Grants to pay for higher education courses.
- 1996: The Prison Litigation Reform Act made it harder for incarcerated people to use the federal courts to protect their civil rights, and made it easier for prisons and jails to escape oversight of their operations.
- 1996: The Antiterrorism and Effective Death Penalty Act made it harder for wrongly convicted people to prove their innocence. (Liliana Segura at The Intercept has an excellent article about the political machinations behind the effort to gut the ancient right of habeas corpus.)
- 1996: Megan’s Law required states to share law enforcement’s databases of people who have committed sex offenses with the public. While no doubt well-intended, there is no evidence — despite years of scholarly effort — to indicate that these laws reduce sex offender recidivism. In fact, they seem increasingly likely to be exacerbating it while wasting resources and time that could be spent on other, more effective law enforcement activities.
- 1996: The Personal Responsibility and Work Opportunity Reconciliation Act, aka the bill to “end welfare as we know it,” also included provisions that banned, for life, people with drug felony convictions from ever receiving food stamps.
- 1997: The Adoption and Safe Families Act required states to move more quickly to terminate parental rights and place children who are in foster homes up for adoption. One side effect of this law is it made it more likely that any incarcerated parent with a sentence of at least 15 months — even if their crime did not involve their children — could lose their children forever.
- 1998: The Higher Education Amendments of 1998 delayed or denied federal financial aid for college to anyone with a misdemeanor or felony drug conviction.
While Megan’s Law continues to be expanded, some of these laws have expired or are in one way or another rolling back. For example:
- The federal grants in the Violent Crime Control and Law Enforcement Act of 1994 that supported prison construction and the hiring of more police have long since expired. And there is now a pilot program to once again give incarcerated people access to Pell grants.
- 44 states, most recently Texas in September 2015 and Alabama in February 2016 have partially or fully opted out of the requirement to deny hungry people with past drug convictions access to food stamps.
- Some states like Washington and New York have implemented the Adoption and Safe Families Act in a way that protects the parental rights of families temporarily separated by incarceration.
- In 2006, the Higher Education Act was amended to limit the prohibition of people with drug convictions from receiving federal aid to only those who were convicted while they were receiving federal aid.
Ending mass incarceration will require far more than repealing one – or seven – of Bill Clinton’s crime bills. But one test of whether an elected official is serious about ending mass incarceration is whether he or she recognizes the complexity of how mass incarceration came to be and can put forth sufficiently complex remedies to undo that harm.
While the goal of the Adoption and Safe Families Act is noble, the law has the unintended consequence of depriving incarcerated parents of their legal rights to their children.
by Alison Walsh,
May 24, 2016
Five million children experience the incarceration of a parent at some point in their lives. As a result, many of these children will live with relatives such as grandparents or be placed in foster care. Some of these families will never be legally reunited.
With the passage of the federal Adoption and Safe Families Act (ASFA) in 1997, states were required to automatically file a petition to terminate parental rights once a child has been in foster care for 15 of the most recent 22 months. The goal of ASFA is to prevent children from staying in foster care indefinitely by making them eligible for adoption after a set period of time has passed.
But these noble intentions conflict with the realities of mass incarceration, and the law stacks the odds against incarcerated parents seeking to maintain their legal rights to their children.
In New York, for example, the median minimum sentence for women is 36 months — more than twice as long as the ASFA deadline. In 2008, almost 73% of women incarcerated in New York reported having one or more children. ASFA sets these mothers up to lose their children as soon as their sentences exceed 15 months. Loss of parental rights is almost always permanent and strips the parent of any right to know whether her child has been adopted, let alone to see her child.
ASFA does have three built-in exceptions. Parents can be exempted from the 15 out of 22 months timeline when:
- The child is under a relative’s care
- A state agency finds a “compelling reason” that terminating parental rights is not in the child’s best interest
- The state has failed to make “reasonable efforts” to reunite the child with his or her parents
Women in state prison most commonly have their mothers care for their children while they are locked up, and because incarceration disproportionately impacts certain families and communities, some grandmothers must care for multiple grandchildren. This can be financially burdensome and make staying in touch even more difficult. A majority of people are incarcerated over 100 miles from their families and even a single phone call can be prohibitively expensive.
When regular communication is such a challenge, the “compelling reason” exception is of little practical value for any family impacted by ASFA. Caseworkers are more likely to exercise the “compelling reason” exception if they have direct knowledge of the parent/child relationship or have observed the two interacting. This often leaves parents dependent upon caseworkers to arrange and be present for prison visits.
Despite the obvious challenges of navigating visits and court proceedings from behind bars, close to half of the states use time-driven standards — not case-by-case considerations — to automatically file for termination of an incarcerated person’s parental rights.
Fortunately, movements for reform led by activists — including currently and formerly incarcerated parents — have succeeded in liberalizing the ASFA guidelines in New York and Washington. These states allow for increased flexibility in cases of parental incarceration; parents can be judged individually by the roles they play in their children’s lives, rather than the lengths of their sentences.
New York passed the ASFA Expanded Discretion Bill in 2010. This act gives foster care agencies the authority to postpone filing for termination of parental rights when the petition is based solely on a parent’s incarceration or participation in a residential drug treatment program. Washington followed suit in 2013 with the Children of Incarcerated Parents Bill, which awards similar discretion to courts in cases involving parental incarceration. In addition, the New York and Washington laws require the states to inform parents of their rights and responsibilities and take into account the challenges of meeting those responsibilities from behind prison walls.
These efforts to ease ASFA’s strict guidelines do not prohibit states from terminating parental rights when a judge determines it is in a child’s best interest to do so. But by giving incarcerated parents a chance to advocate for reunion with their children, these states acknowledge that incarceration alone does not automatically make someone an unfit parent for life. New York and Washington recognize that arbitrarily severing parent-child relationships can do more harm than good.
For more information on ASFA and various state reforms, see:
- Philip M. Genty, Moving Beyond Generalizations and Stereotypes to Develop Individualized Approaches for Working with Families Affected by Parental Incarceration. Family Court Review, Vol. 50 No. 1, January 2012 36-47
- Washington State’s 2013 Children of Incarcerated Parents Bill
We didn't get mass incarceration from War on Drugs alone, but drugs play an important role in less discussed stages of criminal justice systems
by Bernadette Rabuy,
May 23, 2016
In large part due to the wide success of Michelle Alexander’s game changing book, The New Jim Crow, the War on Drugs is often seen as the cause of mass incarceration. But as support for criminal justice reform has grown, discussions of mass incarceration have gotten more sophisticated. The sheer scale of our system of mass incarceration has caused more authors, organizations, presidential candidates, policymakers, and reporters to ask hard questions about how we got here and how we can turn the tide on mass incarceration.
The truth is our country didn’t get mass incarceration from the War on Drugs alone, but too often, when those interested in criminal justice reform are reminded of this, the argument goes to extremes and ends up understating the role of drugs in mass incarceration. Here are just some reasons that drug policy reforms matter:
-
As we showed in our pie chart report, some states like New York have made huge dents in their prison population in part by focusing on drug policy reforms. New York cut its prison population by 26% from 1999-2012 in part by shifting police resources away from felony drug arrests and increasing the proportion of people with felony drug arrests who receive treatment rather than prison. So while states like New York must now look beyond drug policy reform, other states like Oklahoma or Alabama can make immediate progress by reducing admissions or length of stay for drug offenses.
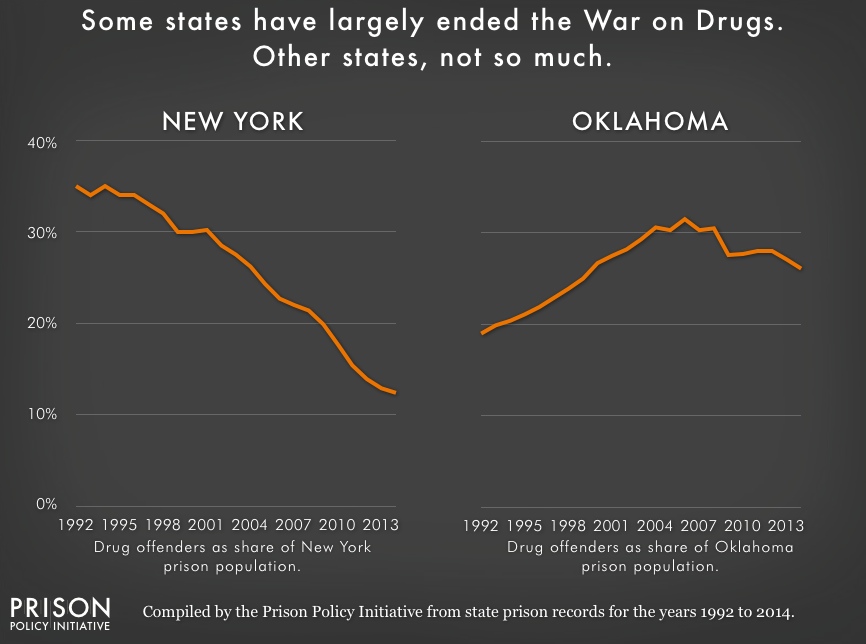 For example, according to the Urban Institute, if Oklahoma halved drug admissions, it would see a 9% drop in its prison population by December 2021. The same reform would only reduce New York’s prison population by 1% in the same timeframe.
-
While less than 16% of people in state prisons are incarcerated for a drug offense, drugs are a larger slice of the local jail and federal prison slices of the imprisonment pie and play a greater role in other less discussed stages of criminal justice systems:
| Stage of criminal justice system |
Proportion that is drugs |
| State Felony Prosecutions, 2009 |
32.6% |
| Parole, 2014 |
31% |
| State Felony Convictions, 2009 |
28.8% |
| Probation, 2014 |
25% |
| Local Jail Incarceration, 2002 |
24.7% |
Listed in order of highest proportion to lowest proportion. Sources: State felony prosecutions (Table 1, Felony Defendants in Large Urban Counties), Parole (Table 6, Probation and Parole in the United States, 2014), State felony convictions (Table 22, Felony Defendants in Large Urban Counties), Probation (Table 4, Probation and Parole in the United States, 2014), and Local jail incarceration (Profile of Jail Inmates, 2002 or see Mass Incarceration: The Whole Pie for more details)
The decision to prosecute drug offenses not only means that we are sending people to relatively short stints of prison time instead of providing longer-term solutions to addiction like drug treatment, but also that we are giving people life-long criminal records that can prevent future employment, exclude them from public housing, and lead to harsher punishments for future crimes. Drug charges — and their frequent mandatory minimum sentencing — also give prosecutors leverage to compel guilty pleas on other offenses that possibly wouldn’t have resulted in a conviction otherwise.
-
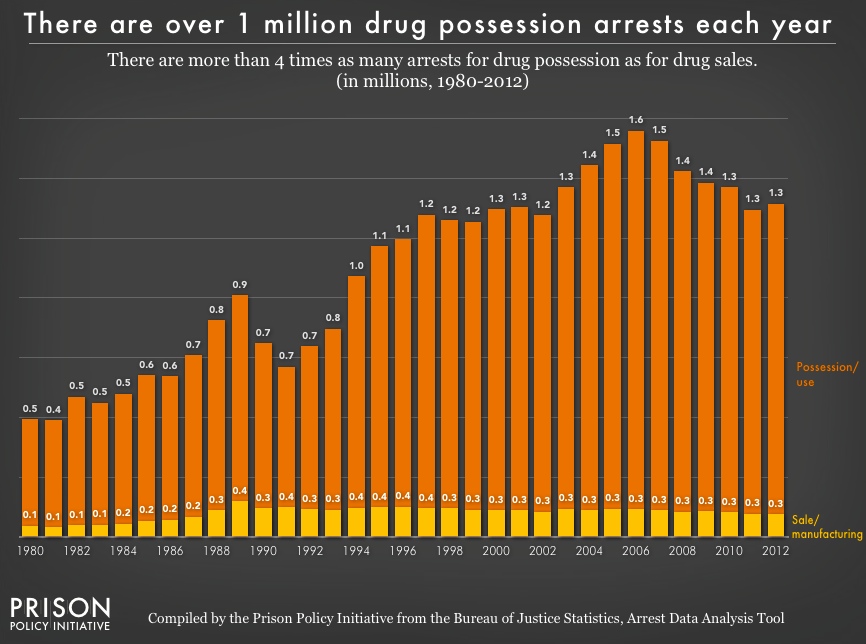
A recent White House report suggests that the War on Drugs led law enforcement to focus more on drug enforcement than property and violent crimes, even when property and violent crime rates were rising from the mid 80s to the early 90s. Drug arrests peaked at 1.6 million arrests in 2006, despite the fact that drug use among Americans of all age groups had been dropping or unchanged for years.(*) Even though drug arrests are declining, our pie chart report found that there are still over 1 million drug arrests each year, most of which are for possession, not sales. Further, the greatest proportion of drug arrests nationwide is for possession of the drug the public overwhelmingly sees as the least dangerous: marijuana (39.7% of all drug arrests).
-
Drug offenses are a driver of deportation of immigrants. Between 2007 and 2012, drug convictions constituted one out of every four removals of non-citizens with a criminal conviction.
-
There are collateral consequences — specific to drug offenses — that make it extremely difficult for people convicted of drug offenses to succeed in the future. For example, some states automatically suspend a person’s driver’s license if he is convicted of a drug offense, regardless of whether a vehicle was involved. A handful of states still deny food stamps to people with drug convictions, and students can lose federal student aid if they are convicted of a drug offense.
-
Just like there are collateral consequences that are specific to drug offenses, there were overly harsh policies enacted as part of the War on Drugs that continue to do harm. One example is in California where there is a three-year sentence enhancement for prior drug convictions, a law that led at least one woman arrested for a $5 sale of cocaine to spend six years locked up. (Fortunately, there is a bill right now, SB 966, that might finally end this ineffective law.)
The six factors above concentrate on harmful effects of the War on Drugs that are easy to measure. Other effects defy easy measurement but may be as important if not more so. For example, without the War on Drugs, would police have been as likely to search people of color during traffic and street stops? And how does it change a community’s long-term relationship with the police when so much of their interaction with the police is being on the receiving end of searches? In my view, a large reason why Michelle Alexander’s drug-war-heavy explanation of the rise of mass incarceration resonated with so many readers is because it matched their personal, lived experience.
To be sure, ending mass incarceration will require rolling back the punitive laws that affect people convicted of violent offenses. But I don’t think our work is done when it comes to drug policy reform. At a time when more people such as President Obama are willing to publicly accept the view that addiction is a public health issue rather than a criminal one, there is still room for drug reforms in the movement for criminal justice reform.
Notes:
(*) For drug use from 2002 to 2014 broken down by age group (12 or older, 12 to 17, 18 to 25, and 26 or older), see Figure 2 from Behavioral Health Trends in the United States: Results from the 2014 National Survey on Drug Use and Health. For drug use from 1991 to 2014 for youth in grades 8, 10, and 12 see Table 2 (page 56) from 2014 Overview: Key Findings on Adolescent Drug Use.
The Bureau of Justice Statistics released a report exploring the fastest growing portion of the prison population, those 55 or older.
by Meredith Booker,
May 19, 2016
This briefing has been updated to a new version with data through 2021.
The prison population is getting older. A Bureau of Justice Statistics (BJS) report released this morning, Aging of the State Prison Population, 1993-2013, explores the changing age dynamics in state prisons over a 20-year period. While we have previously explored the prison boom among the elderly in New York state prisons, this report offers a national perspective on what is driving prison growth among older adults.
Trends in imprisonment for those over 45 are the exact opposite of what is happening in the national prison population, which has been slightly decreasing in recent years. According to the Bureau of Justice Statistics, people 55+ are now the fastest growing age group in the U.S. prison population.
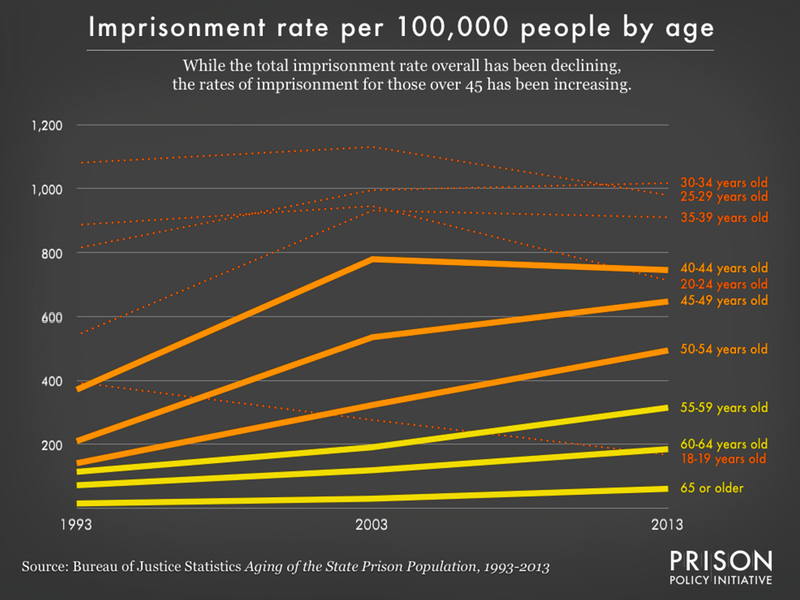
While the total rate of imprisonment has been going down since 2003, the rate for those 45 or older has been increasing steadily.
Changes in prison population can come from changes in admission rates and changes in sentence lengths. The Bureau of Justice Statistics attributes the massive growth in the aging prison population to both.
Also notable is the rate of new court commitments per 1,000 arrests increasing for violent and property offenses for all age groups from 1993 to 2013. The rate for property offenses nearly quadrupled for those 55 or older (see page 19 of the report).
The Bureau of Justice Statistics reports that those over 55 are also given longer sentences and are expected to serve more of their sentence compared to their younger counterparts. In 2013, adults over 55 were expected to serve almost 50 more months in prison compared to those 18–39. The report does not delve into the causes for this change beyond a reminder that state policy controls sentencing decisions.
Some of this isn’t new, but what is new and useful is the report’s effort to disaggregate national prison population data by age (although it is not available at the state level), despite some Bureau of Justice Statistics data series collections not requiring facilities to report the ages of those they have in prison.
While the portion of the prison population over 55 years old was only 10% in 2013 (up from 3% in 1993), this number is likely to continue to grow, requiring states to reevaluate how they manage the graying prison population.
Some states are beginning to recognize the differing needs of an aging prison population by providing special programming, housing, and medical care to those considered “elderly” by the facility. Other options are compassionate or early release programs, and utilizing common sense when making parole decisions.
The growth of the graying prison population shows no signs of slowing down. The Council of State Governments warns, “as America’s prisoners continue to grow older and sicker, the costs to states will continue to rise.” States are going to have to take action now to make sure those aging are properly cared for or better yet, released back into the community.
The full Bureau of Justice Statistics report is available at: http://www.bjs.gov/index.cfm?ty=pbdetail&iid=5602
 In Louisiana, sheriffs and wardens trade incarcerated people from parish to parish in an attempt to keep their jail beds full and the state money rolling in. It’s common for jail wardens to “
 Since 1999, private prisons and local jails have housed roughly the same number of those serving state and federal prison sentences. But when those interested in justice reform talk about profiting off of mass incarceration, they almost always leave local jails out of the conversation.


