HELP US END MASS INCARCERATION
The Prison Policy Initiative uses research, advocacy, and organizing to dismantle mass incarceration. We’ve been in this movement for 23 years, thanks to individual donors like you.
Can you help us sustain this work?
Thank you,
Peter Wagner, Executive Director Donate
Can you help us sustain this work?
Thank you,
Peter Wagner, Executive Director Donate

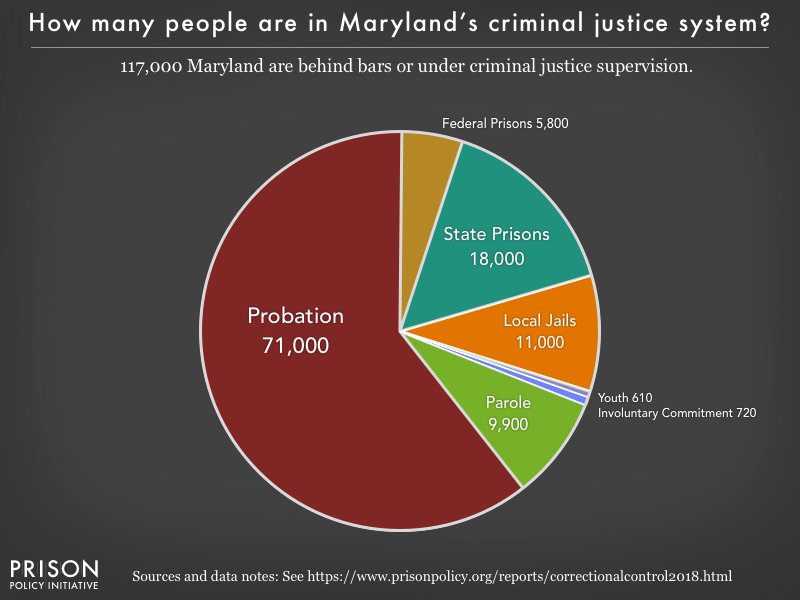
(Graph: Alexi Jones, December 2018)
This graph is a part of Correctional Control 2018: Incarceration and supervision by state. For more research and graphs about Maryland, see our Maryland state profile.


