Maryland profile
Maryland has an incarceration rate of 475 per 100,000 people (including prisons, jails, immigration detention, and juvenile justice facilities), meaning that it locks up a higher percentage of its people than almost any democratic country on earth. Read on to learn more about who is incarcerated in Maryland and why.
36,000 people from Maryland are behind bars

Additionally, the number of people impacted by county and city jails in Maryland is much larger than the graph above would suggest, because people cycle through local jails relatively quickly. Each year, at least 83,000 different people are booked into local jails in Maryland.

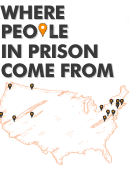
Using 2020 census data, we looked at where people in Maryland prisons come from. We found they come from all corners of the state, but disproportionately from Baltimore and some Eastern Shore communities.
Rates of imprisonment have grown dramatically in the last 40 years

- total numbers rather than rates.
- Women’s prisons: Incarceration Rates | Total Population
- Men’s prisons: Incarceration Rates | Total Population

Today, Maryland’s incarceration rates stand out internationally

People of color are overrepresented in prisons and jails


Maryland's criminal legal system is more than just its prisons and jails


Reports and briefings about Maryland's criminal legal system:
Filter to show
- Only about 24% of people who apply for medical parole in Maryland are granted release
- Over 1 in 100 people in Maryland are on probation or parole. See trends over time and how Maryland compares to other states
- Maryland asks if people are on probation when they apply for SNAP benefits. Why?
- At least 50% of all incarcerated people in Maryland are confined in rural jails and prisons, and at risk of losing access to hospitals thanks to Medicaid cuts.
- Parole in perspective: How parole boards work and how they make decisions in Maryland and other states
- With an incarceration rate of 49 per 100,000 residents, Maryland incarcerates women at a higher rate than most of our closest international allies.
- Hundreds of children have been shuffled into Maryland's juvenile legal system. Why, and where are they confined?
- Local jails in Maryland shore up Trump's mass deportation plan by serving as the sole providers of detention space for immigration enforcement
- Maryland prisons charge people $2.00 to see a healthcare provider.
- Maryland does not make medications for opioid use disorder available in its prisons. Why is getting treatment for substance use disorders so difficult across the US carceral system?
- Despite reducing its prison population at the beginning of the pandemic, Maryland's prison population increased 7% between 2021 and 2023.
- People on probation in Maryland are saddled with onerous rules and conditions they must follow every day or risk incarceration.
- Prisons in Maryland have tablets, but they may be being used to restrict incarcerated people’s access to books and sap them of the little money they have.
- With an incarceration rate of 475 per 100,000 residents, Maryland locks up a higher percentage of its people than almost any democratic country on earth.
- During the 2020 redistricting cycle, Maryland successfully reallocated nearly 80% of people in state prison back to their home communities, as part of its efforts to end prison gerrymandering.
- Prisons in Maryland force incarcerated people and their families — some of the most vulnerable members of society — to subsidize mass incarceration.
- 51% of people in Maryland jails have not been convicted of a crime, meaning they're legally innocent. There are simple steps the state can take to reduce this number. Why isn't it?
- Maryland releases roughly 70,541 men and 16,113 women from its prisons and jails each year. What is it doing to support them upon reentry?
- The parole board in Maryland is releasing 66% fewer people and holding 27% fewer hearings since the pandemic started
- Black people in Maryland are incarcerated at a rate 5.3 times higher than white people.
- Maryland's choice to criminalize "failure to appear" may be hurting public safety
- The cost of incarcerating older people is incredibly high, and their risk of reincarceration is incredibly low, yet 13% of people in Maryland prisons are over the age of 55. Why is the state keeping so many older people locked up?
- Maryland makes it difficult or even risky for incarcerated journalists to tell their stories.
- Maryland has one of nation’s highest rates of HIV in prison and legally criminalizes people with HIV.
- Jails in Maryland charge up to $3.15 for a 15-minute phone call, reaping profits for companies, while prisons charge 48¢ for a 15-minute call.
- Bail companies in Maryland have a track record of avoiding accountability, our report All Profit, No Risk and review of state-by-state evidence show
- Report:
 Where people in prison come from: The geography of mass incarceration in Maryland
 - People in Maryland prisons with more than $2 in their spending account must pay for basic hygiene products and writing supplies.
- Maryland prisons and ViaPath don’t report data on fees to transfer money to an incarcerated loved one.
- We gave Maryland a "D-" grade in September 2021 for its response to the coronavirus in prisons.
- Maryland hinders jury diversity by excluding people with felony records and some prior misdemeanors
- How many COVID-19 cases in Maryland communities can be linked to outbreaks in correctional facilities? (data from our report Mass Incarceration, COVID-19, and Community Spread)
- We graded the parole release systems of all 50 states - Maryland gets a D
- People in Maryland prisons earn as little as 15¢ an hour for their work.
- Maryland proposes — and promptly withdraws — plan to ban letters to people incarcerated in the state’s prisons
- Implementing Reform: How Maryland & New York Ended Prison Gerrymandering
- Maryland law brings long-awaited racial justice to Somerset County
- Supreme Court upholds Maryland law ending prison-based gerrymandering; Huge victory for fair representation
- Maryland enacts law to count incarcerated people at their home addresses, ending prison gerrymandering across the state
- Importing Constituents: Incarcerated People and Political Clout in Maryland
 Where people in prison come from: The geography of mass incarceration in Maryland
Other resources
- Research on Maryland in our Research Library


