This report is old. See our new version.
Correctional Control 2018:
Incarceration and supervision by state
By Alexi Jones
December 2018
Press release
The U.S. has a staggering 2.3 million people behind bars, but even this number doesn’t capture the true scale of our correctional system. For a complete picture of our criminal justice system, it’s more accurate to look at the 6.7 million people under correctional control, which includes not only incarceration but also probation and parole.
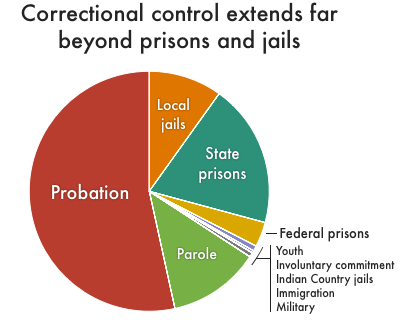
The vast majority of people under correctional control are on probation and parole, collectively known as community supervision (or community corrections). An estimated 4.5 million adults are under community supervision, nearly twice the number of people who are incarcerated in jails and prisons combined. Yet despite the massive number of people under their control, parole and probation have not received nearly as much attention as incarceration. Only with recent high-profile cases (such as Meek Mill’s probation revocation) has the public begun to recognize the injustices plaguing probation and parole systems, which set people up to fail with long supervision terms, onerous restrictions, and constant scrutiny. Touted as alternatives to incarceration, these systems often impose conditions that make it difficult for people to succeed, and therefore end up channeling people into prisons and jails.
Understanding correctional control beyond incarceration gives us a more accurate and complete picture of punishment in the United States, showing the expansive reach of our criminal justice system. This is especially true at the state level, as some of the states that are the least likely to send someone to prison are the most likely to put them under community supervision. Given that most criminal justice reform will need to happen at the state and local levels,1 it is crucial for states to assess not only their incarceration rates, but whether their “alternatives” to incarceration are working as intended.
For this report, we compiled data on each state’s various systems of correctional control to help advocates and policymakers prioritize targets for reform. This report includes data on federal prisons, state prisons, local jails, juvenile confinement, involuntary commitment, Indian Country jails, parole, and probation. We make the data accessible in one nationwide chart and 100 state-specific pie charts. In this update to our original 2016 report, we pay particular attention to the harms of probation and parole, and discuss how these systems might be reworked into more meaningful alternatives to incarceration.
Mass Supervision in the United States
The most alarming finding when we look at the broader picture of correctional control is that nationally, over 6.7 million adults — or 1 in 37 — are under some form of correctional control.2 For perspective, if the population under correctional control were its own state, it would be the 16th largest in the nation, comparable to the size of Massachusetts or Tennessee. The majority of people under correctional control are on community supervision. 55% of people under correctional control, or 3.6 million, are on probation, and 11%, or 870,000 people, are on parole.3 While the massive scale of probation dwarfs the parole population, there are still more people on parole than in federal prisons and local jails combined.
Just as focusing only on incarceration leads to a distorted view of American punishment, focusing only on the national picture obscures important state variations. Notably, some of the states with the lowest incarceration rates, such as Rhode Island and Minnesota, are among the most punitive when probation is taken into account. Other states that rank in the bottom half of incarceration rates nationwide, such as Ohio and Idaho, end up surpassing Oklahoma — the global leader in incarceration — in rates of overall correctional control. Georgia is punitive from any angle, as the only state that is both a top jailer and leader in probation.
“Correctional control” includes federal prisons, state prisons, local jails, youth confinement, Indian Country jails, involuntary commitment, parole and probation. Rates are per 100,000 total population in that state, D.C., or, for all 50 states and D.C. combined. Note that categories with very low rates may not be visible on this graphic. Please see the Data Appendix for the complete data set.
We find that this tremendous variation between the states is largely driven by differences in the use of probation. While states vary widely when it comes to their use of prisons and jails, there is far greater variation in their use of probation. For example, although Massachusetts and West Virginia have almost the same overall correctional control rates, 72% of those under correctional control in Massachusetts are on probation, compared to 28% in West Virginia, where far more (54%) are incarcerated in state, federal, and local jails.
Looking at correctional control rather than incarceration alone provides other surprises:
- Residents of Pennsylvania are nearly twice as likely to be under some form of correctional control than New York residents, even though the two northeastern states have similar crime rates.
- A resident of Michigan is far less likely to be incarcerated than a resident of Alabama. But, overall, Michigan’s criminal justice system controls a larger share of its population than Alabama does.
- Because of its large probation system, Rhode Island’s total correctional control rate rivals that of Louisiana,4 one of the most notoriously punitive states in the country.
State-level data can also provide more context on how correctional populations are changing over time. Nationally, the community supervision population is slowly beginning to decrease. From 2015 to 2016 (the most recent year for which data are available), the number of people under any form of community supervision fell for the ninth year in a row, by 1.1%.5 However, looking at changes at the state level reveals that four states account for half the national decrease in probation: Illinois, Florida, Washington, and Texas collectively cut over 24,000 people from probation supervision, more than all other states combined. Meanwhile, probation populations increased in sixteen states. For example, Virginia added 5,300 more people to probation, New Jersey added 4,500, Oklahoma added 2,300, and Colorado and Arkansas each added 1,900.
To be clear, none of this is to suggest that having people on probation and parole is inherently harmful. States should not take this report as a cue to end community supervision. Instead, states should ask hard questions about their supervision systems: whether probation and parole are truly helping people get their lives back on track, and whether there are people under supervision who do not actually need monitoring.
Probation and parole can hurt the very people they’re supposed to help
Probation and parole are important not just because of the vast number of people under their control, but also because of the harm they inflict on individuals, families, and communities. Although typically framed as an alternative to incarceration, probation in particular is a key driver of mass incarceration. The perception of probation as a “lenient” punishment is at odds with high failure and revocation rates that land large numbers of people in jail and prison instead.
Both probation and parole set people up to fail with long supervision terms, strict conditions, and intense surveillance. Only about half of people who exit parole or probation do so after successfully completing their supervision terms; many supervision “failures” result in revocation which in turn can lead to incarceration. And this happens a lot: Annually, nearly 350,000 people are shifted from community supervision to prison or jail.
Supervision “failures” are the predictable result of probation and parole conditions. First, people under community supervision live under intense scrutiny, which often leads to the detection of low-level offending (such as drug use) or technical violations (such as breaking curfew6). Normally, incarceration would not be appropriate for such low-level offenses; they would typically be addressed through fines, community service, drug treatment programs, or no criminal justice response at all. However, for people under community supervision, these minor offenses and technical violations can lead to incarceration. This creates a “revolving door” between community supervision and incarceration, which can lead to job loss, housing instability, difficulty caring for children, interruptions in healthcare, and a host of other collateral consequences.
In addition to surveillance, people under community supervision must comply with numerous conditions, many of which are unrelated to the original offense and can be very costly. In 2015, the Robina Institute estimated that people on probation must comply with 18 to 20 requirements a day in order to remain in good standing with the probation department. Violating any of these conditions can result in prison or jail time.
While far from an exhaustive list, typical probation requirements include:
- Paying supervision fees, fines, restitution or other fees ordered by the court, very often without considering the individual’s ability to pay;7
- Regularly reporting to a parole or probation officer;
- Finding and maintaining full-time employment or education;
- Submitting to drug and alcohol tests, which the individual is often forced to pay for (this is often a condition even if the offense was not related to drugs or alchohol);
- Abiding by strict curfews and submitting to electronic monitoring, which, again, the individual often must pay for;
- Not changing employment or residence without permission;
- Attending specific programs (such as an anger management class);
- Not leaving a designated area without permission (such as the city, county, or state); and
- Not associating with people with criminal records, including family and friends.
In addition to the usual requirements of probation, “courts have been known to impose a wide range of [special] conditions, ranging from the bizarre (‘[y]ou may never even sit in the front seat (of a car)’) to the controversial (don’t get pregnant) to the downright dangerous (put a bumper sticker on your car announcing you are a sex offender).” As formerly incarcerated criminal justice activist Topeka Sam (link no longer available), explains, these “policies, procedures, and rules [are] seldom explained and often administered arbitrarily.” Even worse, “there is no clear process to register grievances” about one’s conditions of supervision, or to appeal a decision about one’s probation or parole.
While the requirements of community supervision would be burdensome for anyone, they can be especially difficult for those on probation and parole. People under community supervision have significantly higher rates of poverty, mental illness, and lower educational attainment than the general public.8 Supervision fees (including administrative fees, electronic monitoring fees, drug screening fees, program fees, and more) can be financially crippling.9 Many of these requirements are also time-consuming and can interfere with work and family obligations. Furthermore, community supervision populations have much higher rates of addiction,10 yet parole and probation policies ignore the realities of drug addiction and relapse,11 tending to criminalize drug use rather than taking a public health approach.
Finally, like incarceration, probation and parole affect already marginalized populations in troubling ways:
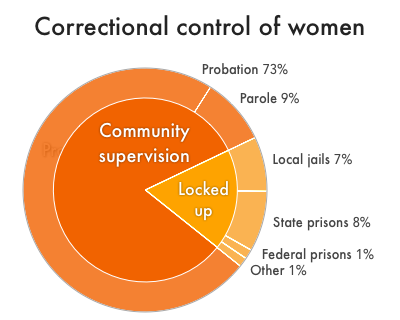
- The vast majority of women under correctional control (73%)12 are on probation. Complying with conditions that involve travel and program participation can be particularly difficult for many women due to family caregiving obligations, such as finding or paying for child- or elder-care so they can go to a meeting or required class.
- Black Americans are subject to disproportionate rates of correctional control and higher revocation rates. Black Americans make up 30%13 of those under community supervision but just 13% of the U.S. adult population. The Urban Institute also found that, after controlling for other relevant factors, Black Americans had significantly higher revocation rates than white and Hispanic Americans.14
- Probation fees are an enormous burden on the poor. This is especially alarming in states with privatized probation, which allow private companies to extract money from the poor, often using the threat of incarceration to coerce payments people can’t afford.
Parole and probation could be used as tools for decarceration
Our analysis shows that, in every state, correctional systems control the daily lives of large numbers of people — and unnecessarily, in all too many cases. Prisons and jails are warehousing people struggling with substance use disorders and mental illness, who need help that correctional facilities are unsuited to provide. Local jails are filled with people who haven’t been found guilty but are awaiting trial behind bars because they are simply unable to afford money bail. And probation and parole systems anticipate (and respond to) failure rather than success — a rational result of heavy caseloads, limited resources, and a myriad of conditions to track instead of providing individualized support. All told, we are left with a bloated, ineffective, costly correctional system that inflicts further harm on individuals, families, and communities.
But it doesn’t have to be this way. Probation and parole systems, in particular, can be reformed to help people exit the criminal justice system for good and lead successful lives. As we’ve discussed, probation and parole are currently broken. Policymakers should invest in strategies to make these systems tools for decarceration rather than engines for incarceration. Parole should be used as a tool for shortening lengthy sentences, and probation solely as an alternative to incarceration.
Reforming parole:
Shortening excessive prison terms and supporting successful reentry
Parole can — and should — be used to make earlier release possible for people serving long sentences, especially the approximately 200,000 individuals in state prisons serving natural life or “virtual” life sentences. To do so effectively, reforms will be necessary at every level, from parole offices to state legislatures:15
- Prisons should make time credit systems more accessible; these incentive programs can move up initial parole eligibility and strengthen parole cases. Earned-time programs, which frequently have long waitlists,16 should be expanded to meet demand, and prisons should make it easier for incarcerated people to accrue and maintain good time credit.
- State lawmakers should institute presumptive parole to increase the number of people granted parole and make parole decisions more predictable and transparent.
- Parole boards should limit the conditions they impose so as to manage individual risks and needs in a minimally restrictive way.
- Parole offices should frequently re-assess individuals’ progress and needs and step down requirements over time to reward compliance and redirect resources toward higher-need individuals.
- Limit the length of time an individual can be on parole. The majority of reoffending occurs in the first few years after release, but after this period continuing supervision has diminishing returns.17
- Eliminate returns to incarceration for technical violations.
Instead of surveillance, parole systems should focus on reducing the unnecessarily high barriers that people on parole face in securing education, employment, housing, and other vital resources. In most states, there is tremendous room for improvement, both in the availability and value of parole.
Reforming probation:
Ending unnecessary supervision and prioritizing support
Probation, by design, is an important alternative to incarceration. In cases where incarceration is the only practical alternative, the use of probation should be encouraged to minimize the broad social and economic harms of incarceration. But courts should be wary of using probation as a knee-jerk response to low-level offending (it’s been used for things as minor as nonpayment of fines), and should ensure that probation prevents incarceration rather just delaying it.
Currently, probation acts as a net-widener that unnecessarily expands the correctional system’s reach to people who commit low-level crimes or who are low-risk and do not need to be under strict supervision. Instead, probation should be reserved for people who are at a high risk of reoffending and who require more support and supervision. Given the limited resources of most probation departments, it’s much more prudent to dedicate time and financial resources to those who would benefit most from probation.
To improve the effectiveness and efficiency of probation, states should reduce their outsized probation populations. In fact, experts in the field have called for cutting the probation population by 50% over the next ten years. And New York City has shown that this can be done without compromising public safety. In the 1990s, New York City reformed its probation system, reducing its population by 60% between 1996 and 2014. Even with far fewer individuals under supervision, violent crime dropped by 57% over the same period.
To reduce probation populations, courts should take note from other countries and address low-level offenses or people who are low-risk with more appropriate sanctions, including warnings, fines,18 community service, and diversion to appropriate programming, such as treatment for substance use disorders or mental health services. These alternative sanctions would not only reduce the probation population, but also the total number of people under correctional control.
In addition to restricting the use of probation to offenses serious enough to warrant correctional control, courts and probation practitioners could promote compliance and prevent future offending by:
- Setting individualized and minimally restrictive probation requirements, with consideration of personal circumstances (family, financial, health, etc.) that would make compliance difficult;
- Shortening probation sentences so they don’t lead to increasingly punitive responses to low-level offenses committed years after the initial offense;
- Focusing on incentives rather than punishment: stepping down supervision at regular intervals for those in compliance, and allowing people to earn time off of their probation sentence or eliminating fees as reward for program completion, meeting goals, or continued compliance;
- Waiving any supervision, monitoring, program, or drug screening fees that would cause financial hardship for the individual or their family; and
- Responding to probation violations with additional support, such as linking people with social services, rather than incarceration.
Only with serious reforms to both the conditions and the number of people under its control can probation be a true alternative to incarceration, rather than a system that expands correctional control and drives incarceration.
Conclusion
This report provides another metric for understanding where your state falls within the national landscape of mass incarceration. Our state-specific breakdowns (below) suggest where state advocates and policymakers might start when developing proposals for meaningful justice reform. The most effective reforms will reduce the number of people under correctional control in total, and transform broken probation and parole systems into supportive alternatives to incarceration.
Additional graphs
The graphs made for this briefing are included in our profiles for each state:
and are available individually from this list:
Footnotes
- State and local policies drive mass incarceration. As this report shows, and as we’ve argued in past reports, the vast majority of incarcerated people are held in state prisons and local jails, which are under the jurisdiction of local and state authorities. Likewise, the vast majority of people on probation are under the jurisdiction of state governments, not the federal government. ↩
- Our number is higher than the Bureau of Justice Statistics’ estimate of 6.6 million people under correctional control because we include 20,295 people who are involuntarily committed and 48,043 confined youth. This is also why we estimate that 1 in every 37 people is under correctional control rather than the Bureau of Justice Statistics’ estimate of 1 in 38. ↩
- When compared with other countries, community supervision in the U.S. appears even more out of control. When researchers compared probation and parole populations from 26 European countries to those in the U.S., they found that the European countries collectively had half as many people on probation and half as many people on parole, despite the fact that the total population of these countries was twice that of the U.S. Overall, the United States’ probation rate was five times higher — and the parole rate more than four times higher — than the average European country. For more see: Corda, A., & Phelps, M. S. “American exceptionalism in community supervision.” American Probation and Parole Association, Perspectives Vol. 41, No. 2 (Spring 2017). ↩
- In Louisiana, and many states, these numbers may be even higher. University of Minnesota Sociology professor Michelle S. Phelps suggests that one explanation for why Louisiana appears to have a relatively lower probation rate may be due to underreporting of misdemeanor probation. Phelps finds that Louisiana ranks higher in its rate of probation relative to other states if only felony probationers are compared. Phelps contacted states that have high incarceration rates but low probation rates by phone, and many said that misdemeanants were not included in the probation counts provided to the Bureau of Justice Statistics (BJS). Both the probation data in this report and in Phelps’ article are from BJS, although the data used for this report is more recent. See pages 11-13 of Michelle S. Phelps, “Mass probation: Toward a more robust theory of state variation in punishment,” Punishment & Society (2016). ↩
- The number of people on parole actually increased slightly, meaning that the entire decrease is due to a drop in probation. For more, see our previously published analysis of the changes. ↩
- Technical violations are violations of the terms of one’s parole or probation agreement; they are not crimes for people who are not under supervision. In other words, they only trigger a criminal justice response because of an individual’s probation or parole status. ↩
- According to the Supreme Court (Beardon v. Georgia, 461 U.S. 660 (1983)), it is unconstitutional to incarcerate someone because they cannot afford to pay court-ordered fines and fees. Nevertheless, this happens in many places where judges ignore the question of whether a defendant’s failure to pay is by choice or because they cannot afford to pay. To ensure that these legal financial obligations do not lead to unconstitutional punishment, courts should (a) hold hearings to determine an individual’s ability to pay before assessing fines and fees, (b) grant fee waivers or order community service instead of fines and fees for those unable to pay, and (c) provide counsel in all hearings that result from failure to pay fees when they could lead to incarceration. ↩
- According to a report prepared for the Bureau of Justice Statistics and Office of Probation and Pretrial Services:
- 34% of people are unemployed when they begin supervision;
- over one-quarter have a history of or current problem abusing opiates, methamphetamine or cocaine;
- 43% have a history of or current alcohol abuse problem;
- 27% have a historical or current mental health diagnosis;
- 10% have medical problems that interfere with their ability to work or establish constructive community ties; and
- almost 20% are in need of financial assistance, temporary housing, and/or transportation assistance.
- For example, Human Rights Watch estimates that someone who is convicted of driving under the influence in Florida would be required to pay over $1,000 in probation fees on top of $600 for court costs and a $750 criminal fine. For a general overview of supervision fees, see “Supervision Fees: State Policies and Practice” (2012) ↩
- Researchers estimate that substance use disorders are between 4 to 9 times higher in the community supervision population compared to the general population. ↩
- McLellan et al. estimate that between 40% and 60% of people treated for substance use disorders relapse. ↩
- The Bureau of Justice Statistic’s report Correctional Populations in the United States, 2016, unlike earlier versions, does not have a breakdown of these populations by sex. See the methodology section of our report Women’s Mass Incarceration: The Whole Pie 2018 for an explanation of how we estimated the number of women under probation and parole supervision from that data source. Also, note that the incarcerated population of women is slightly different between these two reports, because this report includes more types of facilities in its “Locked up” (incarcerated) category. Specifically, this report includes over 15,000 additional women and girls who are confined in youth facilities, involuntarily committed to state psychiatric hospitals, or civilly committed due to justice system involvement. As a result, we find a slightly smaller portion (73%) of women under correctional control are on probation than the 74% reported in the Women’s Mass Incarceration report. ↩
- More specifically, according to the Bureau of Justice Statistics 28% of people on probation are Black and 38% of people on parole are Black. ↩
- This disparity remained even when controlling for factors such as age, employment, risk assessment, type of charge, and whether the person had prior convictions. ↩
- For more information and recommendations about parole reform, see our report Eight Keys to Mercy: How to shorten excessive prison sentences ↩
- Washington State, for example, has over 1,000 individuals waiting for jobs and classes within the state’s prisons system, both of which offer earned-time credits. ↩
- For more information about community supervision reform and and shortening supervision, see Toward an Approach to Community Corrections for the 21st Century: Consensus Document of the Executive Session on Community Corrections (2017) ↩
- While fines are a less restrictive option than supervision, courts should always determine an individual’s to pay fines when assigning them; poor people should not be punished because they cannot afford to pay fines and fees. See footnote 7 which also addresses the use of fines and fees. ↩
About the data
For all the data we use in this report, the interactive chart, and the 100+ pie charts, see our data appendix and read below for more information about how this data was collected and prepared.
- Federal prisons and U.S. Marshals Service: While federal prosecutions are nominally the result of federal policy, we attributed federal convictions to individual states in part because federal prosecutions are of state residents and in part because federal prosecutions are often coordinated with state prosecutors and state law enforcement. (In this way, our methodology departs from the way that the Bureau of Justice Statistics calculates state rates. In Correctional Populations in the United States, 2016, U.S. Marshals Service detainees are not included at all, and other federal prisoners are included in the total national incarceration rate but do not affect state incarceration rates.)
To develop estimates of the number of people in federal prison from each state, we developed a ratio of the state of legal residence for the Bureau of Prisons population as of March 26, 2016 — based on FOIA request 2016-05586 — and applied it to the total federal prison population of 232,258. We got this number by adding 181,726 federal prisoners (collected on September 27th, 2018) to the (link no longer available) 50,532 people under federal (largely pretrial) detention by the U.S. Marshals Service. Those held by U.S. Marshals are often left out of similar statistics. While we did not have state of residence information for this federal population, we used the same ratio to reallocate these people to states as we did for those under BOP jurisdiction. We reasoned that people under federal jurisdiction, regardless of status (convicted, pretrial, or in transit), would likely come from the states in the same proportions. - State prisons: For state prisoners, we used Vera Institute for Justice’s People in Prison 2017, Table 3.
- Local Jails: Our state-level data is from the Bureau of Justice Statistics Deaths in Custody Reporting Series for the year 2014. (We considered using the Annual Survey of Jails for our state-level data, but the Bureau of Justice Statistics explains that this dataset was “designed to produce only national estimates” and after much testing we concluded that this dataset could not reliably be used for state-level summaries.)
To avoid double counting people held in local jails on behalf of state and federal prison systems, we removed state and federal prisoners being held in local jails using the Bureau of Justice Statistics report Prisoners in 2014, Table 9 reporting data for December 31, 2014. - Youth Confinement: For youth in the U.S., the Census of Juveniles in Residential Placement reports the number of people younger than 21 who were detained or committed in residential placement facilities in 2015, the most recent year for which data are available. We included the national total of 48,043 in the national incarceration rate, but state of offense was not reported for 1,593 youth. Only those youth for whom state of offense was reported were included in the state incarceration rates. (For more on this population, see our more detailed report Youth Confinement: The Whole Pie).
- Involuntary commitments: The number of people involuntarily committed to state psychiatric hospitals because of involvement with the criminal justice system (either for evaluation or treatment as incompetent to stand trial or for treatment after being found not guilty by reason of insanity) come from pages 91-92, 98-99, and 103-104 of the August 2017 NRI report Forensic Patients in State Psychiatric Hospitals: 1999-2016, reporting 2014 data by state for 37 responding states. We did not attempt to estimate these populations for non-responding states; we counted them as zeros. Therefore, the incarceration rates for these states may be understated if they do confine people under similar conditions. Finally, we made a correction to the NRI data for the number of people held for pre-trial evaluations in Arkansas, after speaking with an official from the state’s program for forensic patients. The NRI report shows a pre-trial evaluation population of 1,406 in 2014, but this number included outpatient evaluations. The number of inpatient initial criminal forensic evaluations that year was 9.
The data on people convicted of sexual offenses who are detained or committed under civil commitment laws after their sentences are complete comes from an annual survey conducted by the Sex Offender Civil Commitment Programs Network shared by SOCCPN President Shan Jumper. Except for North Dakota, all counts are from their 2017 survey (North Dakota did not respond in 2017, so its count is from 2016.) Interestingly, the inclusion of this population makes very little difference for most states, with Minnesota being a notable exception, as described above. Involuntary commitments were included in our state incarceration rates for every state where data were available. The national incarceration rate includes all of these and an additional 63 people civilly committed under federal jurisdiction, who were not apportioned back to any states of residence. - Probation: Bureau of Justice Statistics, Probation and Parole in the United States, 2016, Appendix Table 2, reporting data for December 31, 2016.
To avoid double counting people on probation who are also in jail, in prison, or on parole in more than one category, we removed probationers who are in jail, probationers who are in prison, and probationers on parole by using the national ratio of people with multiple correctional statuses from the Bureau of Justice Statistics report Correctional Populations in the United States, 2016 , Tables 1 and 5, reporting data for December 31, 2016. Using Tables 1 and 5, we find that 98.4% of probationers are only on probation and not also in jail or prison or on parole. Probationers who were also on probation are shown under parole, not probation. People age 17 or younger who were prosecuted in criminal court as if they were adults are included in the probation counts and rates provided in this report. We used January 1, 2017 population estimates for calculating the rates. - Parole: Bureau of Justice Statistics, Probation and Parole in the United States, 2016, Appendix Table 5 reporting data for December 31, 2016. To avoid double counting people on parole who are also in jail or prison, we removed parolees who are in jail and parolees who are in prison by using the national ratio of people with multiple correctional statuses from the Bureau of Justice Statistics report Correctional Populations in the United States, 2016, Tables 1 and 5, reporting data for December 31, 2014. Using Tables 1 and 5, we find that 95.7% of parolees are only on parole and not also in jail or prison. Parolees who were also on probation are shown under parole, not probation. We used January 1, 2017 population estimates for calculating the rates.
The federal government and D.C. have largely eliminated parole. Parole is not used for individuals who commit D.C. code offenses on or after August 5, 2000, the year that parole was eliminated for D.C. Instead, people who commit D.C. code offenses have determinate sentences with a period of “supervised release” to follow. The number and rate for D.C. parole in this report are for supervised release. Federal “supervised release” is not included in this report. We summed the number of people under parole supervision in each state and D.C. and used a population estimate for the entire U.S. population to calculate the parole rate provided for “United States (overall)” shown in the interactive chart. People age 17 or younger who were prosecuted in criminal court as if they were adults are included in the parole counts and rates provided in this report. - Population Data: In order to calculate rates per 100,000 total population — and note, our data will be different than other calculations that are per 100,00 adults or per 100,000 youth — we used or made population estimates that were as close to the date of our source data as possible. For example, for June 30 correctional population figures, we used July 1 Census Bureau estimates. For December 31 correctional population figures, we created January 1 estimates by averaging the nearest July 1 estimates. As a benefit to other researchers, we have made this data available in a separate Excel spreadsheet.
About the Prison Policy Initiative
The non-profit, non-partisan Prison Policy Initiative was founded in 2001 to expose the broader harm of mass criminalization and spark advocacy campaigns to create a more just society. The organization is known for its visual breakdown of mass incarceration in the U.S., as well as its data-rich analyses of how states vary in their use of punishment. The Prison Policy Initiative’s research is designed to reshape debates around mass incarceration by offering the “big picture” view of critical policy issues, such as probation and parole, pretrial detention, and reentry outcomes.
About the author
Alexi Jones is a Policy Analyst and a graduate of Wesleyan University, where she worked as a tutor through Wesleyan's Center for Prison Education. In Boston, she continued working as a tutor in a women's prison through the Petey Greene Program. Before joining the Prison Policy Initiative in 2018, Alexi conducted research related to health policy, neuroscience, and public health.
Acknowledgments
This report was made possible thanks to the generous support of the Public Welfare Foundation and the MacArthur Foundation's Safety and Justice Challenge, and the contributions of individuals across the country who support justice reform. While Prison Policy Initiative reports are collaborative endeavors, this report builds on the successful collaborations of 2016 version. I am particularly indebted to Wendy Sawyer for her support throughout the writing process and Wanda Bertram and Peter Wagner for their edits. I would also like to thank the rest of the Prison Policy Initiative staff who helped me gather research.
Recommended Reading:
Tracking Trump's criminal legal system moves
The Administration is making America's criminal legal system harsher, less effective, and even more unjust.

Research Library
We curate a searchable database of 4,000+ original research reports, organizing each entry by topic and adding brief summaries.

Mass Incarceration: The Whole Pie
The U.S. incarcerates nearly 2 million people. Where are they locked up and why? Read our report.

Bad Behavior
This national report explains how prison disciplinary policies manufacture misconduct and severly punish incarcerated people.