
The Company Store:
A Deeper Look at Prison Commissaries
By Stephen Raher
May 2018
Press release
Prison commissaries are an essential but unexamined part of prison life. Serving as the core of the prison retail market, commissaries present yet another opportunity for prisons to shift the costs of incarceration to incarcerated people and their families, often enriching private companies in the process. In some contexts, the financial exploitation of incarcerated people is obvious, evidenced by the outrageous prices charged for simple services like phone calls and email. When it comes to prison commissaries, however, the prices themselves are not the problem so much as forcing incarcerated people — and by extension, their families — to pay for basic necessities.
Understanding commissary systems can be daunting. Prisons are unusual retail settings, data are hard to find, and it’s hard to say how commissaries “should” ideally operate. As the prison retail landscape expands to include digital services like messaging and games, it becomes even more difficult and more important for policymakers and advocates to evaluate the pricing, offerings, and management of prison commissary systems.
The current study
To bring some clarity to this bread-and-butter issue for incarcerated people, we analyzed commissary sales reports from state prison systems in Illinois, Massachusetts, and Washington. We chose these states because we were able to easily obtain commissary data, but conveniently, these three states also represent a decent cross section of prison systems, encompassing a variety of sizes and different types of commissary management.1

We found that incarcerated people in these states spent more on commissary than our previous research suggested, and most of that money goes to food and hygiene products. We also discovered that even in state-operated commissary systems, private commissary contractors are positioned to profit, blurring the line between state and private control.
Lastly, commissary prices represent a significant financial burden for people in prison, even when they are comparable to those found in the "free world." Yet despite charging seemingly "reasonable" prices, prison retailers are able to remain profitable, which raises serious concerns about new digital products sold at prices far in excess of market rates.
How much do incarcerated people spend in the commissary?
In Illinois and Massachusetts, incarcerated people spent an average of over $1,000 per person at the commissary during the course of a year. Annual per capita sales in Washington were about half as much.2
| Illinois | Massachusetts | Washington | Average | |
|---|---|---|---|---|
| Annual Commissary Sales | $48,416,118 | $11,713,446 | $8,696,721 | |
| Avg Daily Prison Pop | 43,199 | 9,703 | 16,943 | |
| Per-person Annual Sales | $1,121 | $1,207 | $513 | $947 |
| Commissary operator | State DOC | Contractor (Keefe) | State DOC |
Per-person commissary sales for the three sampled states amounted to $947, well over the typical amount incarcerated people earn working regular prison jobs in these states ($180 to $660 per year). The per-person sales were also higher than a previous survey had suggested.3 In 2016, we estimated that prison and jail commissary sales amount to $1.6 billion per year nationwide, based in part on data from a 34-state survey by the Association of State Correctional Administrators. But the more recent and more detailed data presented in this report suggest that commissary might be an even higher-grossing industry than we previously thought.
There were important state differences in commissary sales, however. Washington’s per-person average was dramatically lower than the other two states’. The reason for this difference isn’t entirely clear, but it seems that personal property policies issued by the Department of Corrections are at least partially responsible for this significant disparity.
What are people buying?
Annual per-person sales averages only tell part of the story. We also wanted to look closely at what people were spending their money on. To do this, we obtained detailed inventory reports from the three commissary systems and categorized (when possible) each inventory item and its commensurate sales figures.4


Slideshow. Average annual per-person commissary sales, by category, in Massachusetts, Illinois, Washington, and in all three states combined. Total sales in each state are shown in Table 2, below. See Footnote 4 for data sources. Swipe to see the data for the other states in our sample.
| Illinois | Massachusetts | Washington | ||||||
|---|---|---|---|---|---|---|---|---|
| Sales by Category | Total | Per Person Annual Avg | Total | Per Person Annual Avg | Total | Per Person Annual Avg | ||
| Clothing | $3,266,773 | $76 | $269,026 | $28 | $20,131 | $1 | ||
| Electronics | $3,068,081 | $71 | $343,033 | $35 | $15,011 | $1 | ||
| Food & Beverages | ||||||||
| Beverages | $4,282,535 | $99 | $1,600,411 | $165 | $1,492,599 | $88 | ||
| Condiments | $1,449,613 | $34 | $533,407 | $55 | $338,344 | $20 | ||
| Ingredients | $4,174,084 | $97 | $897,286 | $92 | $1,273,352 | $75 | ||
| Ready Food | $15,429,178 | $357 | $3,402,365 | $351 | $2,102,377 | $124 | ||
| Snack Food | $8,968,413 | $208 | $2,688,722 | $277 | $1,466,314 | $87 | ||
| Subtotal - Food & Beverages | $34,303,823 | $794 | $9,122,192 | $940 | $6,672,986 | $394 | ||
| Household goods & Supplies | $1,957,080 | $45 | $269,560 | $28 | $95,236 | $6 | ||
| Hygiene & Health | $3,446,257 | $80 | $929,893 | $96 | $1,547,409 | $91 | ||
| Mail & Stationary | $1,196,758 | $28 | $468,231 | $48 | $345,947 | $20 | ||
| Unknown/Unclassified | $1,177,346 | $27 | $311,511 | $32 | $0 | $0 | ||
| Total | $48,416,118 | $1,121 | $11,713,446 | $1,207 | $8,696,721 | $513 | ||
Not surprisingly, food dominates the sales reports; prison and jail cafeterias are notorious for serving small portions of unappealing food. Another leading problem with prison food is inadequate nutritional content. While the commissary may help supplement a lack of calories in the cafeteria (for a price, of course), it does not compensate for poor quality. No fresh food is available, and most commissary food items are heavily processed. Snacks and ready-to-eat food are major sellers, which is unsurprising given that many people need more food than the prison provides, and the easiest — if not only — alternatives are ramen and candy bars.
These data contradict the myth that incarcerated people are buying luxuries; rather, most of the little money they have is spent on basic necessities. Consider: If your only bathing option is a shared shower area, aren’t shower sandals a necessity? Is using more than one roll of toilet paper a week really a luxury (especially during periods of intestinal distress)?5 Or what if you have a chronic medical condition that requires ongoing use of over-the-counter remedies (e.g., antacid tablets, vitamins, hemorrhoid ointment, antihistamine, or eye drops)? All of these items are typically only available in the commissary, and only for those who can afford to pay.
Bringing this discussion into the realm of the concrete, consider the following examples from Massachusetts. In FY 2016, people in Massachusetts prisons purchased over 245,000 bars of soap, at a total cost of $215,057. That means individuals paid an average of $22 each for soap that year, even though DOC policy supposedly entitles them to one free bar of soap per week.6 Or to take a different example: the commissary sold 139 tubes of antifungal cream. Accounting for gross revenue of just $556, the commissary contractor is obviously not getting rich selling antifungal cream, no matter the mark-up—instead, the point is that it’s hard to imagine why anyone would purchase antifungal cream other than to treat a medical condition. Yet Massachusetts has forced individual commissary customers to pay for their own treatment, at $4 per tube, which can represent four days’ wages for an incarcerated worker.7
How do incarcerated people afford commissary?
For many people in prison, their meager earnings go right back to the prison commissary, not unlike the sharecroppers and coal miners who were forced to use the “company store.” When their wages are not enough, they must rely on family members to transfer money to their accounts — meaning that families are effectively forced to subsidize the prison system.9 Others in prison who lack such support systems simply can’t afford the commissary at all.
While the sales data allow us to calculate average commissary expenditures per person using the total prison population, this number does not tell the whole story: It flattens the spending gap between prisoners who can “afford” to buy from the commissary versus those who cannot.
The poorest people in prison, such as those considered “indigent”10 by the state, spend little to nothing at the commissary. This, in turn, means that the per capita spending for all others is actually greater than the average numbers reported above. We can get a very limited glimpse of this population by looking at Washington, where commissaries stock certain items that are available only to people who qualify as indigent. Based on annual sales of “indigent toothpaste” and “indigent soap,” it appears that a significant portion of people in Washington’s prisons (between about ten percent and one-third) are indigent.
How “fair” are free-world prices in a prison?
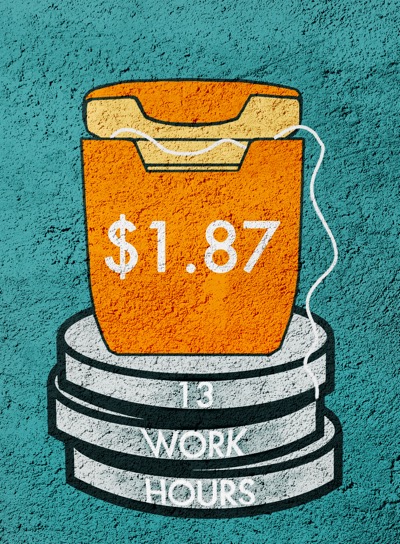 Illustration by Elydah Joyce
One rather surprising finding is that prices for some common items were lower than prices found at traditional free-world retailers.11 Other commissary prices were higher, but only by a little bit. (See Table 3.)
This isn’t to say that prison commissaries are in the business of providing bargains. Rather, it is a natural result flowing from the fact that a regular retailer has substantial costs (such as operating a network of retail outlets and advertising) that don’t arise in the prison context. In fact, a prison commissary is somewhat analogous to an online retailer like Amazon: goods move directly from a warehouse to the customer, without the expenses associated with maintaining a traditional retail presence. In addition, commissary operators have a legal monopoly, so they don’t have to worry about price competition, and thus do not incur costs associated with special sales or discounts.
| Item | Illinois | Massachusetts | Washington | Amazon | |||||||
|---|---|---|---|---|---|---|---|---|---|---|---|
| Commissary | Local Retail | Commissary | Local Retail | Commissary | Local Retail | ||||||
| VO5 shampoo 12.5 oz. bottle | $1.25 (LIN) to $1.69 (VIE) | $0.99 (Jewel, Chicago) | $1.38 | $1.29 (Star Market, Cambridge) | $1.71 (no size specified) | $1.19 (Bartell’s Drugstore, Seattle) | $4.88 | ||||
| Bic twin razor (single) | $0.12 (HIL) to $0.18 (LIN) | $0.35 (based on $3.49 for pkg of 10) (Jewel) | $0.15 | Unable to locate; comparable product (Gillette) available @ $1.20 (based on $11.99/pk of 10) | $0.22 | $1.20 (based on 5.99 for pkg of 5) (Bartell’s) | $0.57 (based on $5.72 for pkg of 10) | ||||
| Maruchan beef ramen | $0.25 (multiple locations) | $0.34 (based on $1 for pkg of 3) (Jewel) | $0.40 | $0.59 (Star Market) | $0.25 or $0.29 (no brand specified) | $0.89 (IGA Seattle) | $0.71 (based on $16.99 for case of 24) | ||||
| Mrs. Dash 2.5 oz. bottle | $2.98 (multiple) to $3.26 (multiple) | $2.99 (Jewel) | $2.40 | $3.49 (Star Market) | not available | $4.09 (IGA Seattle) | $2.94 | ||||
The other thing to keep in mind when comparing commissary prices to the free world is that people in prison have drastically less money to spend. So, while $1.87 may sound like a fair price to pay for a month’s worth of dental floss, the transaction feels very different from the perspective of someone in a Massachusetts prison who earns 14 cents per hour and has to work over 13 hours to pay off that floss.12 Or, to consider a different scenario: the average person in the Illinois prison system spends $80 a year on toiletries and hygiene products — an amount that could easily represent almost half of their annual wages.13
Privatization can take different forms
When a prison system’s commissary is run by a private company, it raises logical concerns about fairness and coercion. In 2016, when one of the largest prison food service/commissary companies (Trinity Services Group) merged with another dominant commissary company (Keefe Group), we expressed concerns about the concentration of power and diminished competition — and quality — that would result. The passage of time has confirmed these fears: by 2017, maggots, dirt, and mold were reported in meals served by Trinity; these quality problems along with small portions led to multiple prison protests and $3.8 million in fines for contract violations in Michigan alone.

But exploitation can occur even if a system is not fully privatized. Of the three states we examined, only Massachusetts has a contractor-operated commissary system. It also has the highest per-person average commissary spending. It is tempting to conclude that the profit motive of commissary contractors leads to higher mark-ups and thus higher per capita spending, but we would need a larger sample size to test this hypothesis. What is notable in our three-state survey is that Illinois, with its state-run commissary, had per capita sales almost as high as Massachusetts’ contractor-run system, so a state-run system is clearly not a panacea.14 In addition, per capita spending in Washington and Illinois are so dramatically different that there must be other significant factors beyond outsourcing.
Arguably the most important privatization-related information in this study comes from Illinois. The Illinois prison commissary system has also been subject to harsh criticism for poor purchasing policies. In a 2011 report on commissary shortcomings, the Illinois Procurement Policy Board noted that only nineteen vendors provided 91% of all the items (measured by dollar amount) sold in the commissary. Among this handful of dominant providers, the one with the largest share was none other than Keefe, which accounted for 30% of the commissary’s spending. Thus, if Illinois is any indication, it appears that Keefe is positioned to make money even in states that have not privatized the operation of their prison commissaries.
The future of commissary: digital sales
Incarceration is becoming increasingly expensive — especially for those behind bars and their families. While prisons find new ways to shift the costs of corrections to incarcerated people (think medical co-pays and pay-to-stay fees), vendors are aggressively pushing new digital products that will further monetize incarcerated people.
This new breed of digital sales can take different forms. Sometimes this consists of “free” computer tablets that offer subscription based music streaming or ebooks. Other times, people must buy tablets or MP3 players and then pay for digital content. Given monopoly contracts and a captive market, prison and jail telecommunications providers are able to generate revenues far greater than similar companies in non-prison settings.
Some states appear to separate digital sales from the prison commissary, while others sell music downloads and other digital content through the commissary. Of the three states we looked at, Illinois was the only system that included digital sales in its commissary reports. The Illinois DOC contracts with GTL to provide electronic messaging and, apparently, digital music downloads. We say “apparently” because there is no reference to music downloads on the Illinois DOC website, but based on the sales figures, music sales seem to be a substantial money-maker:
| Description | Inventory Item | Qty Sold | Gross Sales |
|---|---|---|---|
| Electronic messaging | Prepaid bundles of 1 or 20 messages | 12,443 | $35,301 |
| Music | Unclear | 82,374 | $838,947 |
| Hardware | MP3 players and accessories | 3,171 | $267,550 |
| TOTAL | $1,141,798 |
Price-gouging in commissaries is concentrated in the digital realm
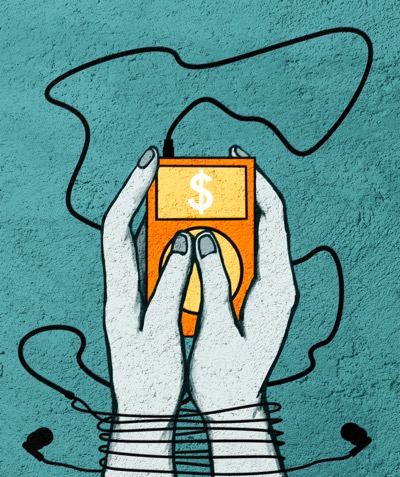 Illustration by Elydah Joyce
The pricing information discussed earlier provides evidence of an important fact: commissaries can afford to sell goods at prices comparable to or lower than free-world stores even while absorbing extra security-related costs (such as secure warehouses) and reaping healthy corporate profits. It appears prisons are ignoring these advantages when evaluating the prices of new digital products. As a prime example, the Massachusetts DOC signed a new contract with Keefe about a year ago, which includes electronic messaging and MP3 downloads. In stark contrast to the generally reasonable prices found in the commissary, Keefe’s digital music is priced at $1.85 per song, which is far higher than prices found on services like iTunes, Amazon, or Google Music (and more than can be explained by 5¢ kickback the DOC pockets for each song).
The price disparity for digital items is even more confusing when you consider that delivering an MP3 file raises fewer security concerns than delivering a box of cereal to a prison commissary. The cereal box can theoretically be used to hide contraband, while an MP3 cannot. Of course, operating a digital music platform requires a robust IT security plan, but this is true of any service, whether it operates in the free world or only in prison. Indeed, in some ways, Keefe has less exposure to IT-based threats because much of its system operates on a closed network of kiosks and MP3 players, over which it exercises complete control (as opposed to Apple, which makes its iTunes store available to pretty much anyone with a computer and an internet connection). Thus, it is both paradoxical and troubling that Keefe can manage to price junk food and toiletries at or below standard retail prices, but charges nearly double the typical price for a digital music download.
Conclusion
Although it’s tricky to say how commissaries “should” ideally operate, their sales records ought to raise multiple concerns for justice reform advocates. If people in prison are resorting to the commissary to buy essential goods, like food and hygiene products, does it really make sense to charge a day’s prison wages (or more) for one of these goods? Should states knowingly force the families of incarcerated people to pay for essential goods their loved ones can’t afford, often racking up exorbitant money transfer fees in the process?
Conversely, when people in prison buy “nonessential” digital services, policymakers should compare the costs of those services to free-world prices. Marking up the cost of digital services for incarcerated people in order to make a quick profit - particularly in a time when these services are near-ubiquitous and generally cheap - is unquestionably exploitative.
In the long term, when incarcerated people can’t afford goods and services vital to their well-being, society pays the price. In the short term, however, these costs are falling on families, who are overwhelmingly poor and disproportionately come from communities of color. If the cost of food and soap is too much for states to bear, they should find ways to reduce the number of people in prison, rather than nickel-and-diming incarcerated people and their families.
Acknowledgements
This report was made possible by the generous contributions of individuals across the country who support justice reform. Individual donors give our organization the resources and flexibility to quickly turn our insights into new movement resources.
The author wishes to thank his Prison Policy Initiative colleagues for their feedback and assistance in the drafting of this report. Bridget Doyle, Hannah McKinney, and Sanndy Teran provided research assistance for price comparisons in Illinois and Massachusetts. Elydah Joyce created the illustrations.
About the author
Stephen Raher is an attorney in Oregon who works with the Prison Policy Initiative on projects at the intersection of criminal justice and finance or criminal justice and telecommunications. He began volunteering with us in 2015. Since then, he has written extensively about exploitative prison “services” including electronic messaging,” release cards, tablet computers, and money transfers. On the subject of commissaries, Stephen authored a 2016 investigation of the size of the commissary market just as two commissary giants prepared to merge.
About the Prison Policy Initiative
The non-profit non-partisan Prison Policy Initiative was founded in 2001 to expose the broader harm of mass criminalization and spark advocacy campaigns to create a more just society. The organization is most well-known for its big-picture publication Mass Incarceration: The Whole Pie that helps the public more fully engage in criminal justice reform. This report builds upon the organization’s work advocating for fairness in industries that exploit the needs of incarcerated people and their families, including those that control prison and jail telephone calls, video calls, electronic messages, release cards, and money transfers.
Footnotes
The three states we sampled reflect a diversity of sizes and commissary management styles. Specifically, the size of the incarcerated population ranges from approximately 9,500 in Massachusetts (the thirty-third largest prison system in the country) to roughly 42,600 in Illinois (the eighth largest system). Washington is in the middle of the pack — the twenty-sixth largest state prison system, at 9,400 people. Illinois and Washington both use state-operated commissaries, while Massachusetts outsources its commissary operations (the current holder of the contract is the Keefe). ↩
The time periods covered by the sales data are as follows: 12 months ending June 2016 (Massachusetts), 12 months ending September 2017 (Illinois), and 12 months ending October 2017 (Washington). ↩
In 2016, we estimated per-person commissary sales at $647, based on data from the 2013 multi-state survey by the Association of State Correctional Administrators. That survey’s results, along with all other previously publicly available survey results from ASCA, have since disappeared from the association’s website. ↩
Commissary sales data came from the following sources:
- Illinois: item usage reports and price lists for each Illinois DOC facility, provided in response to Illinois Freedom of Information Act request.
- Massachusetts: DOC commissary usage report, published as part of Request for Response BD-17-1025-DOCFS-FISCM-00000009260.
- Washington: commissary usage report provided in response to Washington Public Records Act request.
The above reports provided us with a list of each commissary’s inventory items, prices, and number of units sold in the relevant time period. To examine spending by category, we assigned each inventory item a category. To do this, we took the relevant point of sale expenditure classes used by the Bureau of Labor Statistics Consumer Price Index survey, and condensed them into the eleven categories used in the per capita sales table. To benefit other researchers who wish to apply this methodology to other states in a comparable way, please see our table mapping our broad categories to the detailed Consumer Price Index survey classes.
To calculate per capita purchases, we used population data from the following sources:
- Illinois: monthly population for the twelve months of the inventory usage report was averaged. Data was collected from Ill. Dept. of Corr., Quarterly Report (Jan. 2018).
- Massachusetts: average of monthly populations reported in FY 2016 DOC census, published as part of Request for Response BD-17-1025-DOCFS-FISCM-00000009260 (includes civil commitment patients at Bridgewater State Hospital).
- Washington: population figure is an average of reported populations for the months December 2016 through June 2017, and September 2017. Data for December 2016 through June 2017 comes from Wash. Dept. of Corr., “Average Daily Population of Incarcerated Individuals, FY 2017” (Pub No. 400-RE002) (Sept. 2017); population for September 2017 comes from “Washington Dept. of Corr. Fact Card” (Pub. No. 100-QA001) (Sept. 30, 2017). ↩
Unfortunately, toilet paper rationing occurs with some regularity. In addition to the Arkansas case referenced in the text, there have been reports of limiting or withholding toilet paper in federal prisons and at least four other states: New York, Florida, Kansas, and Colorado. ↩
Wages of $1 per day are based on the low end of Massachusetts’s pay scale for incarcerated people (typically $5-10 per week), as reported in our 2017 survey. ↩
According to our 2017 survey, Washington prisons pay incarcerated workers “up to $55 per month” (up to $660 per year), Illinois pays $15-$75 per month ($180-$900 per year), and Massachusetts pays $5 to $35 per week ($240-$1820 per year). Because we do not have data on the median wages or distribution of wages in each state, we cannot precisely estimate the annual wage differences between “average” incarcerated workers in each state. ↩
See Mary Fainsod Katzenstein & Maureen R. Waller, Taxing the Poor: Incarceration, Poverty Governance, and the Seizure of Family Resources, 13 Perspectives on Policy, 638, 639 (Sept. 2015) (“Government ‘seizure’…is a process through which state entities, in collaboration, often, with their corporate partners, act knowingly but in unseen ways to leverage money from families, partners, and friends of the prospectively, currently, or formerly incarcerated poor…. The radical innovation in this most recent means of poverty governance is the outright cash extraction that draws on ties of family dependency within the poorest stratum of American society.”) ↩
In Washington, an incarcerated person is considered “indigent” if they have “less than a ten-dollar balance of disposable income in his or her institutional account on the day a request is made to utilize funds and during the thirty days previous to the request.” Wash. Admin. Code 137-55-020(2). Washington DOC policy allows indigent people to obtain one tube of toothpaste every 60 days (or roughly 6 times per year) Id. 137-55-040(2). Commissary data show 33,870 tubes of “indigent toothpaste” distributed in a year. This would suggest an indigent population of roughly 5,500 (i.e. 33,870 units divided by 6 annual distributions, which equals 5,568 people), or about one-third of the state’s prison population. But using the same formula for “indigent soap” (65,310 units, with people allowed one new bar every week) suggests an indigent population of approximately 1,200 (less than 10% of the population). In other words, sales information for “indigent items” indicate that there is a substantial indigent population, but our efforts to interpolate the number of people falling in this category are inconclusive. ↩
Our price analysis is based on comparisons of retail prices before sales tax. We believe this methodology does not present any issues concerning Massachusetts and Washington, because commissaries in those states do not appear to enjoy any sales tax advantage. In particular, Massachusetts requires that its commissary vendor collect sales tax in the same manner as a regular retailer. See Mass. Dept. of Corr. Policy 476.05(6).) Washington’s DOC does not have an explicit policy, but there does not appear to be any sales tax exemption that would apply to commissaries (many food items in the Washington commissary are likely exempt from sales tax under Rev. Code Wash. 82.08.0293; however, this exemption would also apply in a free-world store). Illinois is the one state in our sample where commissaries may enjoy a sales tax advantage. The Illinois Department of Revenue appears to have interpreted state law as exempting prison meal and commissary sales from sales tax, provided that the facility itself (and not a contractor) is the seller. See Ill. Dept. of Rev., Gen. Info Letter 17-0004-GIL (Feb. 6, 2017) (citing Ill. Comp. Stat. 120/1’s exemption for sellers “organized and operated exclusively for charitable, religious or educational purposes”). ↩
This example is based on the following facts: the Massachusetts DOC commissary sells a package of 30 “floss loops” for $1.87. Each loop is a single-use disposable flossing device. The commissary sold 8,522 packages of these floss loops from June 2015 through June 2016, yielding gross sales of $15,936.14. Wages of 14c per hour (or $1 per day) are based on the low end of Massachusetts’s pay scale for incarcerated people, as reported in our 2017 survey. ↩
This example is based on Illinois’s annual average hygiene spending of $80 per person. The low end of prison wages in Illinois is 9c per hour, or $187 per year (if one were to optimistically assume 40 working hours per week). ↩
Also, the data we used here for Massachusetts come from the fiscal year ending June 2016. In April 2017, Massachusetts Department of Corrections signed a new contract with Keefe Group that changed the commissary pricing schedule and would purportedly result in lower price tags. ↩
Another reason to suspect that the Illinois prices are for digital downloads, not a subscription service, is that the price for a single “music inventory item” is $1.80, which is almost the same price that Keefe charges for an MP3 download under its new Massachusetts contract ($1.85). In other words, $1.80/song might be the prevailing market price for music downloads in prison. ↩
Illinois’s inventory report shows that the commissary sold 3,911 “single use” electronic messages (30¢ each), and 8,532 bundles of 20 messages ($4 each), with total sales proceeds of $35,301. These sales represent 174,551 electronic messages (i.e., 3,911 + (8,532 x 20)). The average price of 20.2¢ per message simply reflects the total revenue divided by the number of messages sold. ↩
Recommended Reading:

50 state incarceration profiles
All of our recent reports about prison/jail growth, racial disparities, and more, re-organized by state.

Research Library
We curate a searchable database of 4,000+ original research reports, organizing each entry by topic and adding brief summaries.

Mass Incarceration: The Whole Pie
The U.S. incarcerates nearly 2 million people. Where are they locked up and why? Read our report.

Bad Behavior
This national report explains how prison disciplinary policies manufacture misconduct and severly punish incarcerated people.