This report is old. See our new version.
Women’s Mass Incarceration:
The Whole Pie 2018
By Aleks Kajstura
November 13, 2018
With growing public attention to the problem of mass incarceration, people want to know about women’s experience with incarceration. How many women are held in prisons, jails, and other correctional facilities in the United States? And why are they there? How is their experience different from men’s? While these are important questions, finding those answers requires not only disentangling the country’s decentralized and overlapping criminal justice systems,1 but also unearthing the frustratingly hard to find and often altogether missing data on gender.
This report provides a detailed view of the 219,000 women incarcerated in the United States, and how they fit into the even broader picture of correctional control. This 2018 update to our inaugural Women’s Whole Pie report pulls together data from a number of government agencies and calculates the breakdown of women held by each correctional system by specific offense. The report, produced in collaboration with the ACLU’s Campaign for Smart Justice, answers the questions of why and where women are locked up:
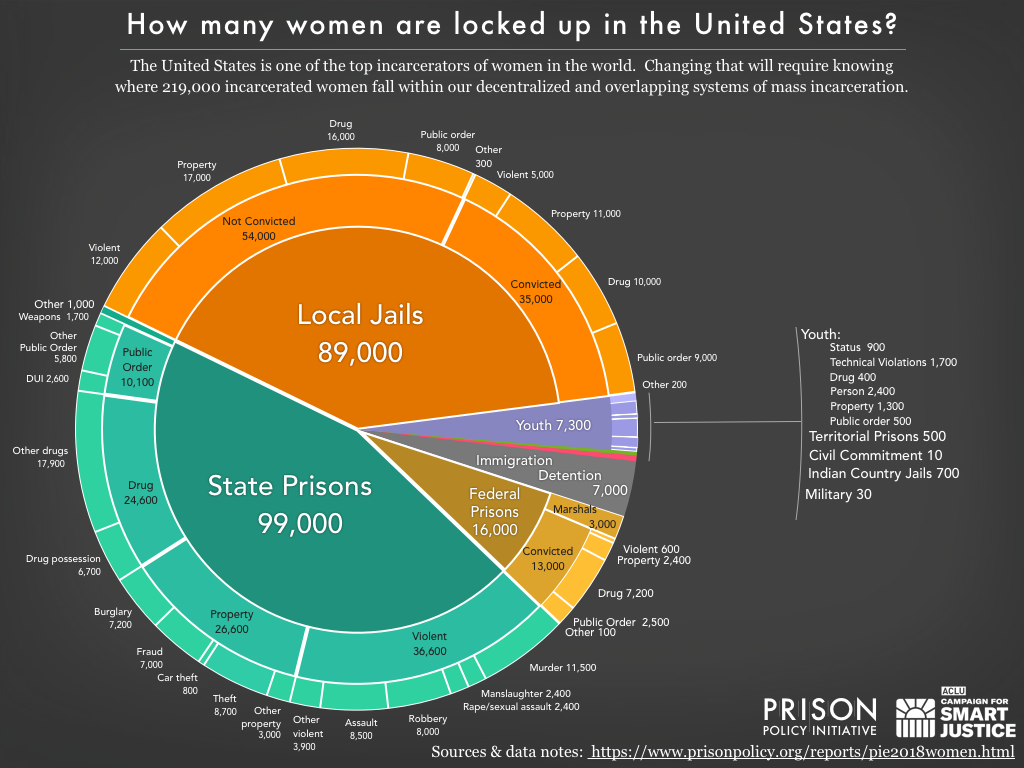
In stark contrast to the total incarcerated population, where the state prison systems hold twice as many people as are held in jails, incarcerated women are much more evenly split between state prisons and local jails. This has serious consequences for incarcerated women and their families.
Women’s incarceration has grown at twice the pace of men’s incarceration in recent decades, and has disproportionately been located in local jails. The explanation for exactly what happened, when, and why does not yet exist because the data on women has long been obscured by the larger scale of men’s incarceration. Frustratingly, even as this report is updated every year, it will not become a tool for tracking changes in women’s incarceration over time. The dearth of data means that this report is compiled from the best sources available, which are updated less frequently than “total population” data, and are often not compatible across years.
The disaggregated numbers presented here are an important step to ensuring that women are not left behind in the effort to end mass incarceration.2
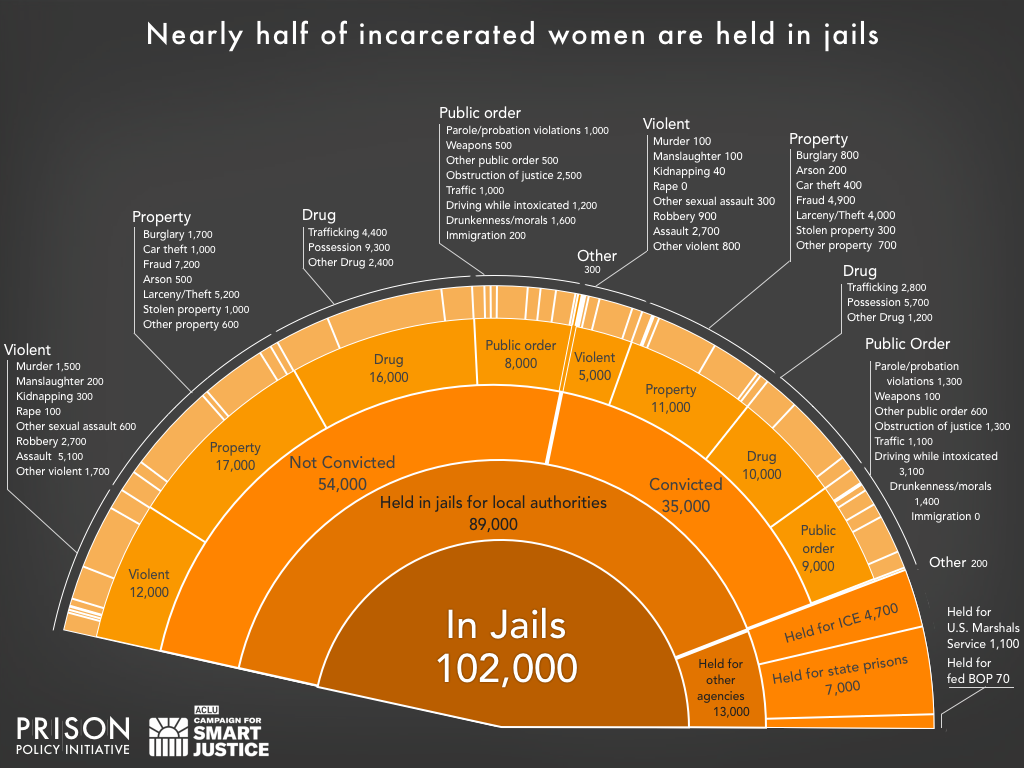
Jails loom large in women’s incarceration
Looking at the big picture shows that a staggering number of women who are incarcerated are not even convicted: a quarter of women who are behind bars have not yet had a trial. Moreover, 60% of women under local control have not been convicted of a crime and are awaiting trial.
Adding to the picture of women in local jails, aside from women under local authority (or jurisdiction), state and federal agencies pay local jails to house an additional 13,000 women. For example, ICE and the U.S. Marshals, which have fewer dedicated facilities for their detainees, contract with local jails to hold roughly 5,000 women. So the number of women physically held in jails is even higher:
Women are disproportionately stuck in jails
Avoiding pre-trial incarceration is uniquely challenging for women. The number of unconvicted women stuck in jail is surely not because courts are considering women, who are generally the primary caregivers of children, to be a flight risk. The far more likely answer is that incarcerated women, who have lower incomes than incarcerated men, have an even harder time affording cash bail. When the typical bail amounts to a full year’s income for women,3 it’s no wonder that women are stuck in jail awaiting trial.4
Even once convicted, the system funnels women into jails: About a quarter of convicted incarcerated women are held in jails, compared to about 10% of all people incarcerated with a conviction.
So what does it mean that large numbers of women are held in jail — for them, and for their families? While stays in jail are generally shorter than in stays in prison, jails make it harder to stay in touch with family than prisons do. Phone calls are more expensive, up to $1.50 per minute, and other forms of communication are more restricted - some jails don’t even allow real letters, limiting mail to postcards. This is especially troubling given that 80% of women in jails are mothers, and most of them are primary caretakers of their children. Thus children are particularly susceptible to the domino effect of burdens placed on incarcerated women.
Women in jails are also more likely to suffer from mental health problems and experience serious psychological distress than either women in prisons or men in either correctional setting.5 Compounding the problem, jails are particularly poorly positioned to provide proper mental health care. (Though that is certainly not to say that prisons are always better at meeting women’s needs.)
Ending mass incarceration requires looking at all offenses — and all women
The numbers revealed by this report enable a national conversation about policies that impact women. Seeing the full scope of women’s incarceration enables us to talk about policies that impact women incarcerated by different government agencies and in different types of facilities. These figures also serve as the foundation for reforming the policies that lead to incarcerating women in the first place.
Too often, the conversation about criminal justice reform starts and stops with the question of non-violent drug and property offenses. While drug and property offenses make up more than half of the offenses for which women are incarcerated, the chart reveals that all offenses — including the violent offenses that account for roughly a quarter of all incarcerated women — must be considered in the effort to reduce the number of incarcerated women in this country. This new data on women underlines the need for reform discussions to focus not just on the easier choices but on the policy changes that will have the most impact.
Furthermore, even among women, incarceration is not indiscriminate. A recent study revealed that a third of incarcerated women identify as lesbian or bisexual,6 compared to less than 10% of men. The same study found that lesbian and bisexual women are likely to receive longer sentences than their heterosexual peers. And although the data do not exist to break down the “whole pie” by race or ethnicity, overall, and Black and American Indian women are markedly overrepresented in prisons and jails: Incarcerated women are 53% White, 29% Black, 14% Hispanic, 2.5% American Indian and Alaskan Native, 0.9% Asian, and 0.4% Native Hawaiian and Pacific Islander.7 While we are a long way away from having data on intersectional impacts of sexuality and race or ethnicity on women’s likelihood of incarceration, it is clear that Black and lesbian or bisexual women are disproportionately subject to incarceration.8
The tentacles of mass incarceration have a long reach
Even the “Whole Pie” of incarceration above represents just one small portion (17%) of the women under correctional supervision, which includes over a million women on probation and parole. Again, this is in stark contrast to the general incarcerated population (mostly men), where a third of all people under correctional control are in prisons and jails.
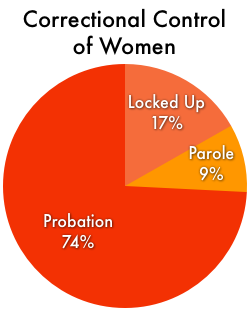 Three out of four women under control of any U.S. correctional system are on probation. Probation is often billed as an alternative to incarceration, but instead it is frequently set with unrealistic conditions that undermine its goal of keeping people from being locked up.9 For example, probation often comes with steep fees, which, like bail, women are in the worst position to afford.10 Failing to pay these probation fees is often a violation of probation. Childcare duties further complicate probation requirements that often include meetings with probation officers, especially for women with no extra money to spend on babysitters or reliable transportation across town. All of these issues make women particularly vulnerable to being incarcerated not because they commit crimes, but because they run afoul of one of the burdensome obligations of their probation supervision.
The picture of women’s incarceration is far from complete, and many questions remain about mass incarceration’s unique impact on women. Based on our analysis in this report, we know that a quarter of incarcerated women are unconvicted. But is that number growing? And how do the harms of that unnecessary incarceration intersect with women’s disproportionate caregiving to impact families? Beyond these big picture questions, there are a plethora of detailed data points that are not reported for women by any government agencies, such as the simple number of women incarcerated in U.S. Territories or involuntarily committed to state psychiatric hospitals because of justice system involvement.
While more data is needed, the data in this report lends focus and perspective to the policy reforms needed to end mass incarceration without leaving women behind.
Read about the data
This briefing uses the most recent data available on the number of people in various types of facilities and the most significant charge or conviction. Because not all types of data are collected each year, we sometimes had to combine differing data sets; for example, we applied the percentage distribution of offense types from the previous year to the current year’s total count data. To smooth out these differing levels of vintage and precision among the sources, we choose to round all figures in the graphic. This process may, however, result in various parts not adding up precisely to the total.
- Jails: Calculated based on the Bureau of Justice Statistics, Jail Inmates in 2016, Appendix Table 1 (yearend 2016). The Bureau of Justice Statistics has stopped collecting data on the conviction status of women in jails in 2009, so we calculated the breakdown based on 2009 data published in the Jail Inmates at Midyear 2013 - Statistical Tables. Our analysis of offense types is based on the Survey Of Inmates In Local Jails, 2002. See below and Who is in jail? Deep dive for why we used our own analysis rather than the otherwise excellent Bureau of Justice Statistics analysis of the same dataset, Profiles of Jail Inmates, 2002. While this methodology section illustrates the pervasive dearth of women’s criminal justice data, this 2002 data continues to be the most recent data available of its kind without regard to gender breakdown. (The Bureau of Justice Statistics was scheduled to start administering the next Survey of Inmates in Local Jails in 2018, but is now re-scheduled to 2021.) Note that the populations reported by BJS should not be used for cross-year comparisons because the agency switched from reporting mid-year populations to year-end populations. (Because of seasonal cycles, year-end jail populations tend to be lower than those at mid-year.)
- Immigration detention: The number of women in immigration detention, and what facilities they are held, in comes from the Transactional Records Access Clearinghouse (TRAC) at Syracuse University, which aggregated individual records of people held by ICE.
- Federal: Bureau of Justice Statistics, Prisoners in 2016, Table 14, reports percentage breakdown of offense types for the convicted population as of September 30, 2016, and the total population of women reported in Table 2, for December 31, 2016. We applied the offense types to the convicted population, but data does not exist for a good estimate of offense types for pre-trial women under Federal control. We also attributed women held by the U.S. Marshal Service in state and local facilities to the Federal slice, see the “data definitions and clarifications ” section below for details.
- State Prisons: Prisoners in 2016, Table 2 provides the gender breakdown for the total population as of December 31st, 2016, and Table 9 provides data (as of December 31, 2015) that we used to calculate the ratio of different offense types.
- Military: The latest gender breakdown we could find was in Correctional Populations in the United States, 1998, Table 8.5, which reported the number of prisoners under military jurisdiction, by officer and enlisted status, gender, race, and Hispanic origin, for December 31, 1998. We calculated the number of women for our military slice by imputing the percentages from 1998 to the numbers reported in Prisoners in 2016, Table 18, which gives the number of people incarcerated in by each branch of the military, but does not provide a gender breakdown.
- Territorial Prisons (correctional facilities in the U.S. Territories of American Samoa, Guam, and the U.S. Virgin Islands, and U.S. Commonwealths of Northern Mariana Islands and Puerto Rico): Calculated based on World Prison Brief data reporting the most recent data available (2017 for every territory but Virgin Islands, which was 2013).
- Youth: Office of Juvenile Justice and Delinquency Prevention, Easy Access to the Census of Juveniles in Residential Placement, reporting data for 2015. I expanded “youth confinement” to include all justice placements outside of the home. This change better reflects the realities of justice confinement for youth and brings us closer to showing the full scope of confinement for all people in the U.S. The inclusion of these less restrictive forms of confinement for youth is consistent with our approach for the adult system which includes the (admittedly far less numerous) halfway houses and other forms of community confinement as a part of the entire adult system.
- Civil Commitment (At least 20 states and the federal government operate facilities for the purposes of detaining people convicted of sexual crimes after their sentences are complete. These facilities and the confinement there are technically civil, but in reality are quite like prisons. People under civil commitment are held in custody continuously from the time they start serving their sentence at a correctional facility through their confinement in the civil facility.): The Sex Offender Civil Commitment Programs Network conducts an annual survey, and the civil commitment data came from an email with SOCCPN President Shan Jumper on October 12, 2018, estimating that there were 5 or 6 women total, nationally (based on the SOCCPN 2017 Annual Survey). And according to the Common Questions about Civil Commitment as a Sexually Violent Person (Adopted by the ATSA and the Sex Offender Civil Commitment Programs Network Executive Boards of Directors on October 13, 2015), there are “a few women throughout the country who have been committed.”
- Indian Country (correctional facilities operated by tribal authorities or the U.S. Department of the Interior’s Bureau of Indian Affairs): Bureau of Justice Statistics’ Jails in Indian Country, 2016, Table 5, reporting data for midyear, 2016.
- Probation and Parole: Our counts of women incarcerated and under community supervision are calculated from Correctional Populations in the United States, 2015, Appendix Table 3, reporting populations under correctional control by sex for December 31, 2015, and newer 2016 counts from Correctional Populations in the United States, 2016, which no longer has a breakdown for women. We applied the 2015 sex ratios to the 2016 counts in Table 1 to calculate the number of women under community supervision and incarceration. In order to break out community supervision between Probation and Parole, we used Probation and Parole in the United States, 2016 for the percentage of women in the Parole and Probation population. (Appendix Table 5 for Parole and Appendix Table 2 for Probation) and applied that ratio to the totals reported in CSAT (these numbers are the numbers that appear, rounded, in table 1 of CPUS). We then adjusted those numbers to ensure that people with multiple statuses were counted only once in their most restrictive category. (Because gender-specific data on people with more than one correctional status was not available, we reduced the number of women on probation and on parole by the ratio (3.54% for parole and 1.64% for probation) we used for Mass Incarceration: The Whole Pie 2017). For readers interested in knowing the total number of women on parole and probation, ignoring any double-counting with other forms of correctional control, there are 113,700 women on parole and 918,300 women on probation.
Several data definitions and clarifications may be helpful to researchers reusing this data in new ways:
- To avoid double-counting women held in local jails on behalf of the Bureau of Prisons, ICE, U.S. Marshals Service, state, and other prison authorities from being counted twice, we removed the 11,793 women from the jail population reported by the BJS and from the numbers we used to calculate the number of convicted women in local jails. Our calculation for the number of women held in such arrangements was based on data reported for the total number of people held in jails for federal and state authorities in Table 17 of Prisoners in 2016 and the 2002 Survey Of Inmates In Local Jails, where our analysis showed that about 8.5% of those held in such arrangements were women, and the total number of women held jails for ICE from the Transactional Records Access Clearinghouse (TRAC) at Syracuse University (using the number of women found in facilities owned by counties, cities, and municipalities).
- Because we removed ICE detainees and people under the jurisdiction of federal and state authorities from the jail population, we had to recalculate the offense distribution reported in Survey Of Inmates In Local Jails, 2002 who were “convicted” or “not convicted” without the people who reported that they were being held on behalf of state authorities, the Federal Bureau of Prisons or U.S. Immigration and Naturalization Service/U.S. Immigration and Customs Enforcement (ICE). Our definition of “convicted” was those who reported that they were “To serve a sentence in this jail,” “To await sentencing for an offense,” or “To await transfer to serve a sentence somewhere else”. Our definition of not convicted was “To stand trial for an offense,” “To await arraignment,” or “To await a hearing for revocation of probation/parole or community release”.
- We also accounted for women held in federal pre-trial detention who are confined in facilities other than federal and state prisons. We found 3,026 women held by, or for, the U.S. Marshals Service. Census of Jails: Population Changes, 1999-2013 Table 13 reports that 848 women are in Federal Bureau of Prisons detention centers and we estimate that another 688 are in private facilities contracted out to the U.S. Marshals Service. We calculated another 1,476 women in state and local facilities, and 14 women in “non-paid” facilities based on figures reported by the U.S. Marshals Service in their Prisoner Operations Fact Sheet, disaggregated for women based on gender breakdown found in the 2002 Survey of Jail Inmates, and facility type breakdown in the total Mass Incarceration: The Whole Pie 2018. We included these 3,026 women total in the Federal Prisons slice of the pie.
- Additionally, a significant portion of the jail population is not in fact under local jurisdiction, but is in a local jail under contract with the U.S. Marshals Service. This population, discussed above, consists both of people who are awaiting trial, and those who are convicted but have not yet been sentenced, so they appear in both the convicted and unconvicted local jail slices. This is part of why, for example, the pie chart shows 133 women “serving” sentences in jails for murder when murder is typically an offense that warrants much longer sentences than would be served in a jail. We have not yet developed a way to separately identify and describe this population, let alone disentangle which portion of the reported numbers is women. We hope to, in future versions of this report, develop more detailed ways to display and describe this population.
- Lastly, the youth slice does not include 433 girls held in adult jails and prisons. There are 400 girls under the age of 17 held in local jails (calculated by comparing the adult female and total female population reported in Appendix Table 1 of Bureau of Justice Statistics Jail Inmates in 2016), and 33 girls under the age of 18 held in state or federal prisons (as reported by the Bureau of Justice Statistics Quick Table, Reported number of female inmates age 17 or younger held in custody in federal or state prisons [XLS], December 31, 2000-2016).
See the footnotes
Illustrated in our work comparing individual states’ incarceration rates to other countries. ↩
For example, the Vera Institute of Justice has a useful report on women in jails entitled, Overlooked: Women and Jails in an Era of Reform. ↩
A previous study found that women who could not make bail had an annual median income of just $11,071. And among those women, Black women had a median annual income of only $9,083 (just 20% that of a white non-incarcerated man). When the typical $10,000 bail amounts to a full year’s income, it’s no wonder that women are stuck in jail awaiting trial. ↩
Recent studies specifically looking at pretrial confinement confirm that womens’ inability to afford bail has a particularly high impact on families. ↩
A gender analysis of the Bureau of Justice Statistics’ Indicators of Mental Health Problems Reported by Prisoners and Jail Inmates 2011-12 report is available in the blog post New government report points to continuing mental health crisis in prisons and jails. And for anyone still unsure of the harms of jail, just look at the suicide rates in U.S. jails. ↩
A recent study based on the National Inmate Survey found that 42.1% of women in prison 35.7% of women in jail are sexual minorities, compared to 9.3% of men in prison, 6.2% of men in jail. The study also confirmed that “[t]here is disproportionate incarceration, mistreatment, harsh punishment, and sexual victimization of sexual minority inmates.” ↩
The women’s incarcerated population has a different race and ethnicity breakdown than the total U.S. population and total incarcerated population. ↩
These disparities don’t stop at incarceration. Even once released, women are at higher risk for homelessness and unemployment, with Black women being hit hardest. ↩
Probation also varies wildly between states. ↩
Reporting from the New York Times, Probation May Sound Light, but Punishments Can Land Hard, captures the typical cascading fees and conditions while following one woman’s navigation of probation. ↩
Acknowledgements
This report was made possible by the partnership of the ACLU Campaign for Smart Justice, the support of the Public Welfare Foundation and the MacArthur Foundation’s Safety and Justice Challenge, and all of the donors, researchers, programmers and designers who helped the Prison Policy Initiative develop the Mass Incarceration: The Whole Pie series of reports.
About the author
Aleks Kajstura is Legal Director of the Prison Policy Initiative. Her previous publications on women’s incarceration include States of Women’s Incarceration: The Global Context reports, which compares the rate of women’s incarceration in every U.S. state to 166 independent countries.
About the Prison Policy Initiative
The non-profit non-partisan Prison Policy Initiative was founded in 2001 to expose the broader harm of mass criminalization and spark advocacy campaigns to create a more just society. The organization is most well-known for its big-picture publication Mass Incarceration: The Whole Pie that helps the public more fully engage in criminal justice reform.
About the ACLU Campaign for Smart Justice
The ACLU’s Campaign for Smart Justice is an unprecedented, multiyear effort to cut the nation’s jail and prison populations by 50% and challenge racial disparities in the criminal justice system. The Campaign is building movements in all 50 states for reforms to usher in a new era of justice in America.

This report is licensed under a Creative Commons Attribution-NonCommercial 4.0 International License.


