We are looking for our next Creator-in-Residence to produce engaging and informative social video content about the problems in the American criminal legal system.
Support us
Can you make a tax-deductible gift to support our work?
For the past few years, California policymakers have been at hard work to protect in-person jail visitation from sheriffs and private companies who are eager to replace crucial human contact with impersonal video chats. While legislators were successful in preventing jails who provided in-person visits in January 2017 from later eliminating them, jails that had already banned in-person visits are permitted to continue their video-only policies.
That could change this legislative cycle thanks to Assembly Member Medina’s AB 964. AB 964 would require that all California jails provide in-person visits. Specifically, jails that are currently exempted would need to restore in-person visits by 2025.
The Assembly Public Safety Committee will be voting on AB 964 on April 2. We submitted a comment, encouraging committee members “to recognize and support the positive role families play in rehabilitation” and, more importantly, that “human beings need in person visits.”
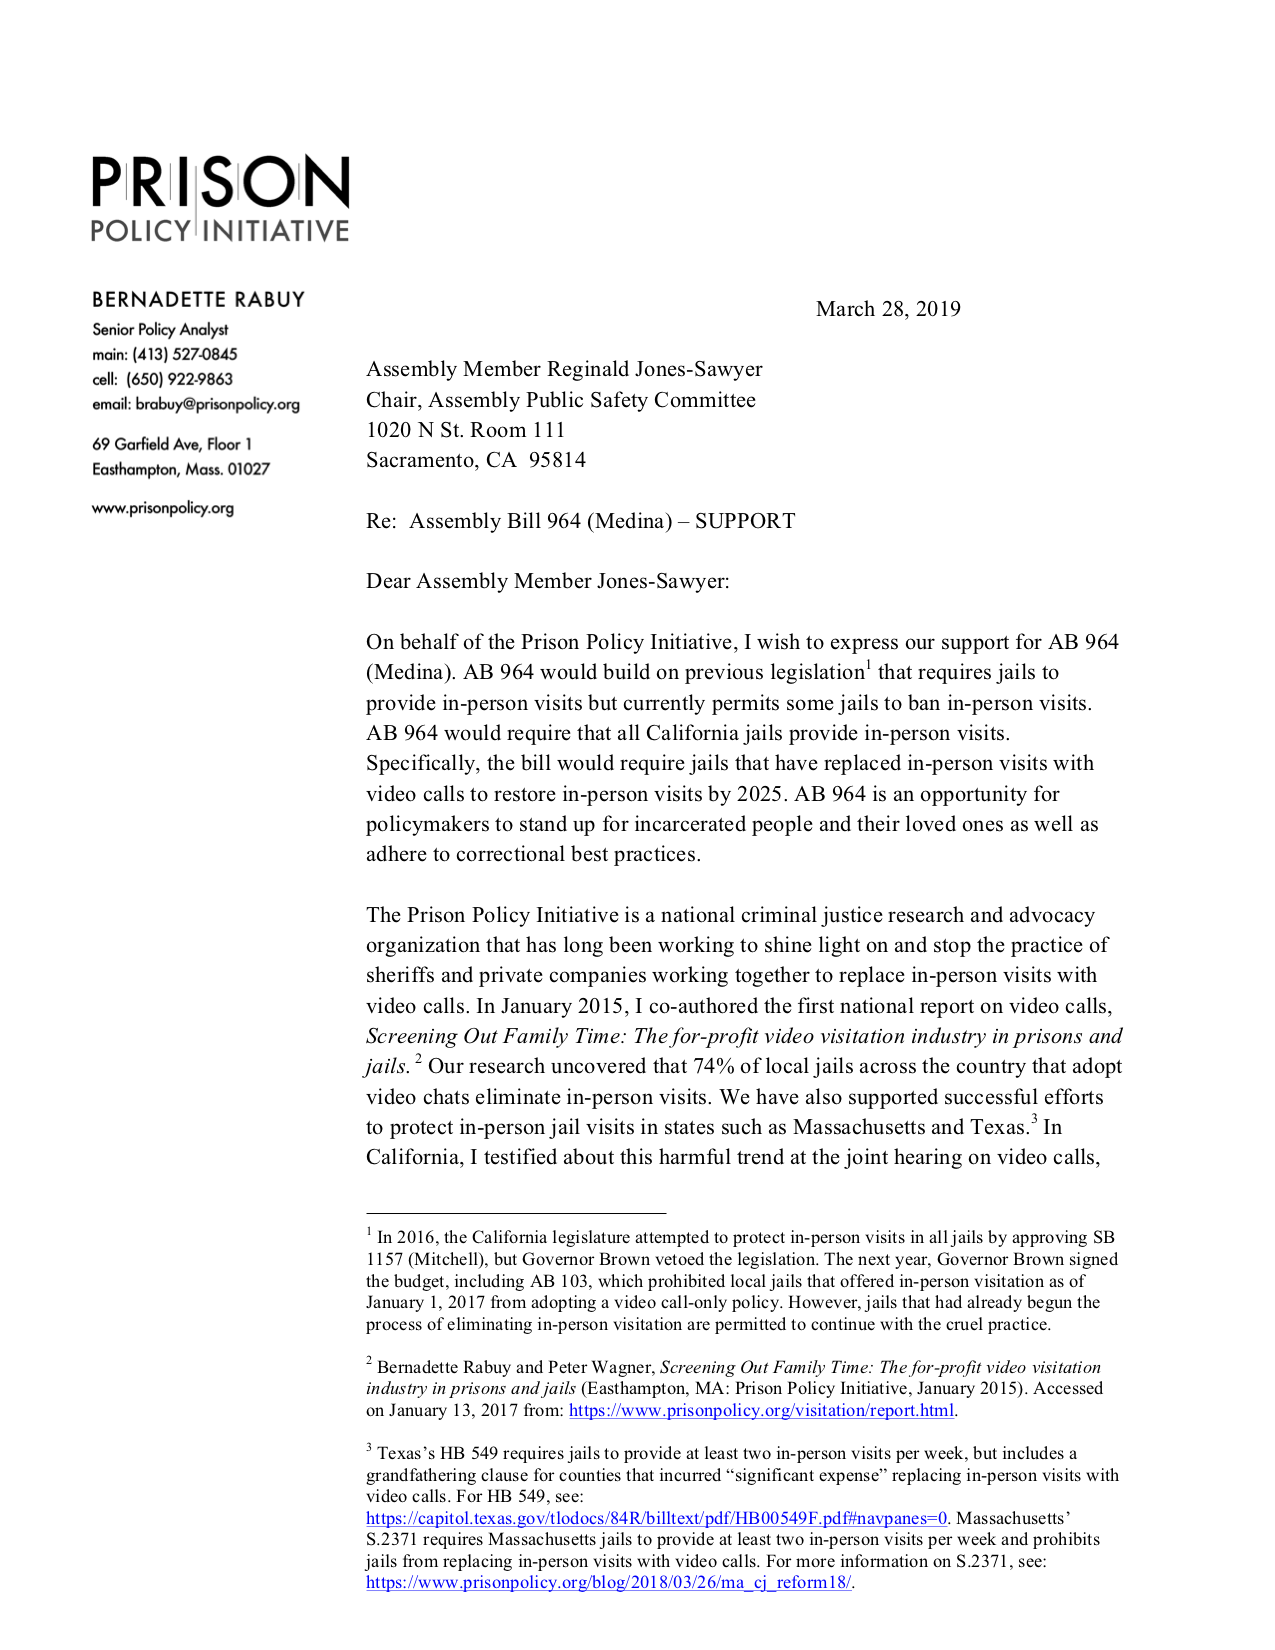
The Massachusetts Senate is once again considering construction of a new jail for women in Middlesex County. But I would caution against any expansion of correctional facilities without first reckoning with the inherent harms of jail incarceration and exploring better alternatives.
The proposal – Senate 1851 – would “establish a commission to identify a suitable location for a justice complex” in Middlesex County. I find it interesting that the commission is to identify a location, rather than consider whether a jail is needed at all. According to the text of the bill, this proposal is in line with a law passed in 2008 to expand jail capacity. But that law was passed in the wake of the state’s highest-ever rate of jail incarceration; since then, the state’s jail rate has seen a steady decline. This begs the question: why would the state need more capacity, when jail rates are down?
The Vera Institute of Justice’s Incarceration Trends tool shows that jail incarceration rates in Massachusetts have fallen over the past decade.
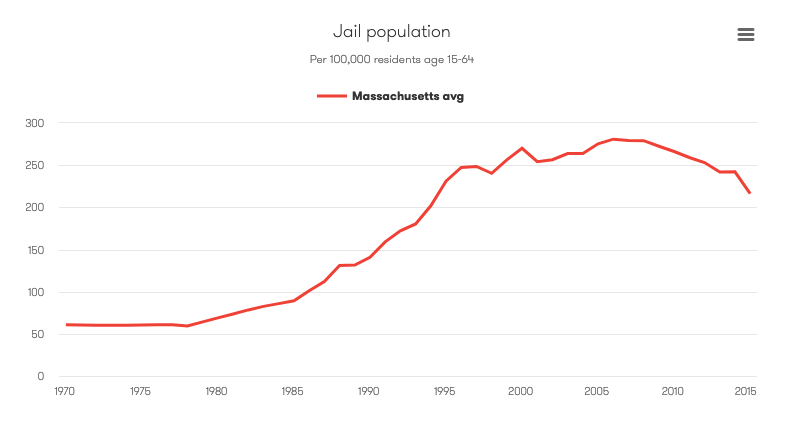
Despite the overall downward trend in the state’s jail rate, two groups have been jailed at steady or increasing rates: women and people being detained pretrial – and these are the two populations being used to justify the “need” for a new jail.
The Vera Institute of Justice’s Incarceration Trends tool shows that the female jail rate in Massachusetts has risen steadily since the early 1990s.
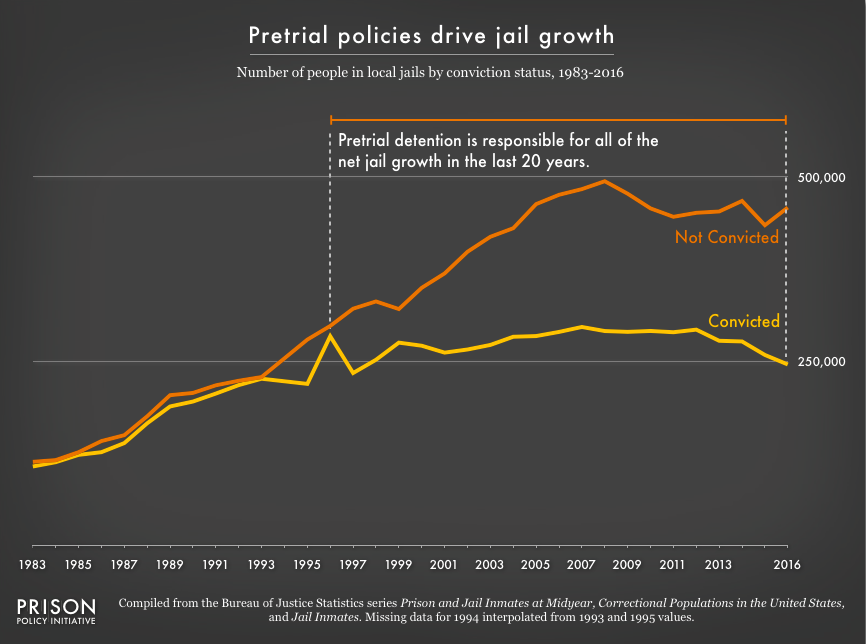
The pretrial population in Massachusetts jails has increased for decades, while the number of people serving sentences there has fallen dramatically since 1993.
But despite the growth in the female and pretrial jail populations, there are some important arguments against building a new jail to hold these groups.
First, jails are uniquely harmful to women, and their needs are better met by community-based programs and services. Women in jails have higher rates of mental health and substance use disorders, and often have a history of abuse or other trauma; incarceration more often exacerbates these problems than alleviates them (for more information, see the “Context” sidebar in our 2018 report). As of December 2018, the Massachusetts Department of Corrections (DOC) reported that “74% [of women held by the DOC] were open mental health cases, 15% had a serious mental illness (SMI), and 56% were on psychotropic medication” – all rates roughly double those of the male population. Women in jails (especially women of color) are also poorer, on average, than their male counterparts, and therefore often are detained pretrial because they can’t afford even low bail amounts. Furthermore, separation from children leads many women to accept plea deals just to get out of jail sooner, which in turn leaves them with criminal records that may not reflect actual guilt or innocence.
Second, pretrial detention leads to worse outcomes, from high risk of suicide to increased likelihood of conviction, longer sentences, and reoffending. Yet pretrial detention has driven all of the jail growth in the U.S. over the last 20 years, which means that jails – like the one being proposed – are being built because more people who have not been convicted and are legally presumed innocent are being locked up. This trend reflects an increasing reliance on money bail – essentially, wealth-based release decisions – rather than an increase in “dangerousness” or flight risk. According to DOC data, the female pretrial population held by the DOC has increased 18% since 2010. If Massachusetts wants to relieve jail overcrowding, it should start by minimizing the number of people held pretrial, especially those who are there because they can’t afford bail.
Another problem that should be addressed before expanding jail capacity is the racial disparity evident in the state’s female pretrial population. As of Jan. 1, 2018, nearly a third (32%) of the women held by the DOC (in Framingham) were being detained pretrial. However, this proportion varied by race and ethnicity. 44% of Hispanic women and 35% of Black women held by the DOC, versus 31% of “Other” and 29% of white women, were held pretrial.
The idea to build a new women’s jail is not a new one. For years, a handful of Massachusetts counties have sent women detained pretrial to the women’s prison, MCI-Framingham, because they didn’t have separate jail space for women in the county jails. And for years, MCI-Framingham was overcrowded for precisely that reason. In 2007, the state opened a new jail for women farther west, and sent women from counties without separate women’s facilities that were west of Worcester to the new jail to await trial or serve their sentences. The result? Women jailed there were farther from crucial contacts, including their families and children, and their lawyers – which in turn made it harder to prepare their defense. Now, lawmakers want to build again, this time near the existing Framingham facility in southern Middlesex County.
The legislators behind the new jail project undoubtedly see a new jail as an “upgrade” for the state’s incarcerated women, since it would alleviate crowding and would be more updated housing than the nearly 150-year-old prison. But the real solution for women in jails would be to return to their communities. They would be better served awaiting trial at home, participating in diversion programs, and getting needed treatment and support for underlying problems through community-based programs. If legislators care about improving conditions for justice-involved women, they should focus on investing in community services and alternatives to incarceration that interrupt women’s distinct pathways to prison – not just building them newer, bigger, jails.
How has mass incarceration impacted the city you live in? This question frequently drives our readers to ask about the incarceration rates of specific cities. Because of the decentralized nature of criminal justice data, drilling down to the city level is difficult-to-impossible, but now you can calculate the prison (but not jail) incarceration rate of a city’s surrounding county using the Vera Institute’s Incarceration Trends Database. Using that tool, we calculated the imprisonment rates of the most populous counties in 39 states (all those where data were available) – and uncovered a few surprises.
Rates are per every 100,000 residents. In its Incarceration Trends tool, the Vera Institute presents rates for counties per every 100,000 residents aged 15-64; we calculated the rates using the total populations in their downloadable dataset to make them comparable with the Bureau of Justice Statistics’ total state incarceration rates. (BJS state incarceration rates are for the jurisdictional population sentenced to greater than 1 year.)
State
Most Populous County
Associated City
County Residents in State Prisons: Rate per 100,000 residents
Total State Prison Incarceration: Rate per 100,000 residents
Okla.
Oklahoma County
Oklahoma City
937
703
Pa.
Philadelphia County
Philadelphia
897
387
Wis.
Milwaukee County
Milwaukee
812
372
Mich.
Wayne County
Detroit
737
430
Ariz.
Maricopa County
Phoenix
666
600
Ala.
Jefferson County
Birmingham
627
613
Ohio
Cuyahoga County
Cleveland
627
444
Ind.
Marion County
Indianapolis
596
413
Texas
Harris County
Houston
574
572
Tenn.
Shelby County
Memphis
564
427
Colo.
Denver County
Denver
551
367
Iowa
Polk County
Des Moines
526
282
Ga.
Fulton County
Atlanta
508
506
Miss.
Hinds County
Jackson
502
609
Ill.
Cook County
Chicago
464
378
Ky.
Jefferson County
Louisville
453
490
Nev.
Clark County
Las Vegas
451
448
S.D.
Minnehaha County
Sioux Falls
443
423
Calif.
Los Angeles County
Los Angeles
427
330
S.C.
Greenville County
Greenville
416
416
Ore.
Multnomah County
Portland
401
379
Wyo.
Laramie County
Cheyenne
336
408
Neb.
Douglas County
Omaha
336
280
W. Va.
Kanawha County
Charleston
335
372
Hawaii
Honolulu County
Honolulu
326
263
Mo.
St. Louis County
St. Louis
304
531
Fla.
Miami-Dade County
Miami
301
500
N.C.
Mecklenburg County
Charlotte
273
354
N.Y.
New York County
New York City
262
261
Minn.
Hennepin County
Minneapolis
211
197
Utah
Salt Lake County
Salt Lake City
207
217
N.H.
Hillsborough County
Manchester and Nashua
186
218
Wash.
King County
Seattle
167
256
N.D.
Cass County
Fargo
157
236
Maine
Cumberland County
Portland
139
132
Va.
Fairfax County
Washington DC suburbs
118
448
Md.
Montgomery County
Washington DC suburbs
117
354
N.J.
Bergen County
Hackensack
92
229
Mass.
Middlesex County
Boston
81
132
With many large cities currently making criminal justice reform a priority – and with the highest rates of incarceration now in small cities and towns – you might expect large cities to be less punitive than the states they belong to. But 14 counties I evaluated (such as Philadelphia County and Los Angeles County) still have disproportionately high prison incarceration rates compared to the rest of their states. And only 13 of the counties I evaluated had incarceration rates significantly (that is, more than 10%) lower than the states they belong to.
You might also wonder: How does my city compare to other cities on incarceration? For the most part, cities in famously punitive states tend to be punitive compared to other cities. But there are some notable exceptions. For instance, while Missouri and Florida have some of the highest state rates of incarceration, St. Louis County and Miami-Dade County not only have lower rates than their states do; they have lower rates than most other urban areas nationwide.
Likewise, a few states that have relatively low incarceration rates should note that their major cities tell a wildly different story. Colorado, Michigan and Iowa have lower incarceration rates than many states, but the counties containing their major cities – Denver, Detroit and Des Moines, respectively – have some of the highest incarceration rates of all the urban areas I evaluated. These counties send disproportionately high numbers of people to prison.
So why do most of these counties differ significantly from the states they’re located in when it comes to incarceration? Clearly, local incarceration rates are impacted by much more than sentencing laws and other factors determined at the state level.
To state the obvious, cities and towns vary widely in their levels of poverty and in the quality of their social services (such as education, drug treatment and health care), both of which impact crime. But other factors matter too. Police departments and prosecutors differ in how aggressively they target crime, especially low-level crime. Cities and towns that invest in diversion programs for veterans, people with mental illness, and people with a substance use disorder may send fewer people to prison than areas without the same community services. The same is true for states with well-funded public defenders’ offices. And the availability of reentry services (like affordable housing), as well as the punitiveness of the community, affects the likelihood that a city’s formerly incarcerated people will be sent back to prison.
Given the wide variation among cities and towns, it’s clear that incarceration rates are just the beginning of any local analysis. If you’re curious to learn more about your city or state, check out Vera’s database, our extensive Research Library, and our state profiles.
With this year's updated edition of Mass Incarceration: The Whole Pie, we once again answer the essential questions of how many people are locked up, where, and why.
March 19, 2019
Easthampton, Mass. – Are there 1.3 million people incarcerated in the U.S., or is it actually closer to 2.3 million? Why – and where – are these millions of Americans behind bars? The country’s fragmented systems of confinement make answering basic questions about mass incarceration unnecessarily difficult. With this year’s updated edition of Mass Incarceration: The Whole Pie, we answer these essential questions with the most recent data, highlighting causes of incarceration that get too little attention as well as incarceration “myths” that receive too much.
The publication of the new report caps a year-long effort to update the public on the major drivers of incarceration – state prisons and local jails – as well as confined populations too often overlooked, such as people in post-release “civil commitment centers” and undocumented immigrants in detention.
“With such high public support for criminal justice reform, it’s urgent that we have a clear picture of who is locked up and where,” said author Wendy Sawyer. “For instance, many people don’t realize how much of mass incarceration is local. But one in four incarcerated people – and one in four ICE detainees – are held in local jails controlled by county sheriffs.”
The report’s other key findings include:
76% of people in local jails are not convicted of a crime, and many are there simply because they can’t afford money bail.
49,000 people are held by ICE for immigration offenses – a 43% increase since 2016. (This does not include the 11,800 immigrant children currently detained by the Office of Refugee Resettlement.)
In a single year, 168,000 people were incarcerated for nothing more than a “technical violation” of probation or parole, such as a failed drug test.
Contrary to a popular myth, only 7% of incarcerated people are held in privately-run facilities – but virtually all incarcerated people generate profit for private companies by paying for phone calls, medical care or other necessities.
The United States locks up more people than any other country, at a rate more than five times higher than most other nations. One impediment to reform is the lack of available data to guide that conversation. In Whole Pie, the Prison Policy Initiative provides the comprehensive view of mass incarceration that society needs in order to plot a path forward.
The non-profit, non-partisan Prison Policy Initiative was founded in 2001 to expose the broader harm of mass criminalization and spark advocacy campaigns to create a more just society. The organization leads the nation’s fight to keep the prison system from exerting undue influence on the political process (via prison gerrymandering) and plays a leading role in protecting the families of incarcerated people from the predatory prison and jail telephone industry and the video calling industry.
Tablet computers are delivering a captive audience to profit-seeking companies, while enabling prisons to cut essential services like law libraries. We investigate.
This article was updated in May 2021 with details about California’s prison tablet contract, and in August 2023 with information about additional attempts to eliminate existing services in favor of tablets in prisons.
Twelve states have recently signed contracts with prison telecom companies to provide tablet computers to incarcerated people – a sharp increase since we began analyzing these contracts in 2017. Though many prisons already allow incarcerated people to buy tablets, these contracts provide something different: Tablets for free, ostensibly at no cost to either consumers or taxpayers. (To be clear, these aren’t like the iPads you can buy at a store; they’re cheaply made, with no internet access.)
But as with most state contracts that appear to cost nothing, there is a catch – several, in fact.
First, the “free” tablets charge users at every opportunity, including above-market prices for phone calls, video chats and media. Even sending an email requires a paid “stamp.” Furthermore, our recent analysis of these contracts suggests that they actually put the interests of incarcerated people last, prioritizing cost savings and the provider’s bottom line.
For instance, many of these contracts:
Guarantee the Department of Corrections a portion of tablet revenue.
Allow tablet providers to alter the prices of services – such as email, music and money transfer – without state approval.
Allow providers to terminate tablet services if the tablets aren’t profitable enough.
Exempt providers from replacing a broken tablet if they think it was “willfully” damaged – a loophole ripe for exploitation, as prison tablets are cheaply made and break easily.
More details below:
Table 1. Findings from our analysis of eight “no-cost” contracts between state Departments of Corrections and tablet providers. Contracts are listed from oldest to newest. For more on GTL and Securus (JPay), the predominant tablet providers, see our recent report State of Phone Justice. In this table, “Active since” denotes the date that installation of tablet equipment in the correctional facility began.
**Note: While news reports state that each person in Vermont prisons is receiving a tablet, Vermont’s contract with GTL (which originally provided for kiosks, with the option for the state to request tablets) is less clear. According to the contract, tablets will be provided to up to 90% of people in each “living unit” in Vermont prisons. (See page 36 of the contract.)
Contract
Active since
Does the DOC receive a portion of tablet revenue?
Can the provider cancel the service for reasons related to profitability?
Yes. DOC earns a flat payment of $800,000 per year.
Yes. GTL can cancel the service if there is insufficient tablet revenue, or if more than 10 tablets in any one housing unit need to be repaired.
No, DOC does not have to approve the Terms and Conditions.
GTL has discretion to determine whether damage was “willful,” and does not have to replace willfully damaged tablets. GTL also does not have to replace more than 5 (or 5%, whatever is greater) tablets in a housing unit every year.
A digital music subscription costs $19.99 per month.
Yes. The contract specfies that the DOC receives 32% of commissary sales, but it is unclear what percent of tablet media sales are paid to the DOC.
Unclear. The contract does not specify revenue metrics as cause for termination.
Tablet usage tracking/monitoring is required in the contract, and the state determines what limited number of functions are provided, but the contract does not specify terms of use.
Unspecified. The contract indicates that GTL will provide the state with their company repair procedure policy.
1 week of streaming music: $7.99; 30 day access to game center: $5.99
Yes, DOC earns a 10% commission on purchased content (not including phone or video calls made on tablets).
Yes. GTL can cancel service in housing units where 10 or 10% of tablets are damaged in a year.
Yes, DOC must approve the Terms and Conditions.
GTL has discretion to determine whether damage was “willful,” and does not have to replace willfully damaged tablets.
GTL does not have to replace tablets more than once for any given incarcerated person, nor does it have to replace more than 5 or 5% of tablets in a housing unit every year.
A 30-day subscription to “unlimited podcasts” costs $9.99.
No, contract does not specify circumstances in which service can be canceled.
Yes, DOC must approve Terms and Conditions and Privacy Policy.
The facility has discretion to determine whether they or Edovo will replace damaged tablets. Edovo does not have to replace more than 5% of tablets for free every year.
Sending more than 10 electronic messages per month costs between $10 and $50, depending on the number of messages one wishes to send.
Yes, commissions to the DOC include 10%-35% revenue for replacement technology, purchases of external hardware accessories, and fees for emails, songs/music, news subscriptions, etc; and 50% of printing fees.
No, contract does not specify circumstances in which service can be canceled.
Yes, user agreement (including privacy and ownership provisions) is specified in contract, but unclear whether terms must be approved by DOC.
Jpay will “repair and/or replace any broken or damaged Tablets and Kiosks as directed and authorized by the Department.” Any tablet that is “intentionally damaged or destroyed” must be replaced at cost to the DOC. Unclear who decides if a tablet was intentionally damaged.
Audiobooks are available for $0.99-19.99 each. News subscriptions are $4.99 a month. Each email is $0.30.
Yes, the WVDCR receives a 5% commission on all gross revenue.
Yes. GTL can cancel the service if there is insufficient revenue.
No. Terms of use not mentioned in contract (and therefore likely not subject to DOC oversight).
Unclear, but contract states that GTL “will in no way be responsible, or liable for…the safety, efficacy, or use of the tablets…Tablets are provided ‘as is’ without warranty of any kind.”
Reading e-books, sending messages, or accessing music, movies, or games costs $0.05 per minute.
Yes. DOC earns a flat payment of $200,000 per year, which it says is “to cover the State contract management responsibilities and services.”
Unclear.
No mention of Terms and Conditions.
“The state shall provide reasonable measures against loss by pilferage or destruction. The vendor shall be responsible for any expenses required for the repair of the equipment.”
A video call costs $0.20 per minute, or $6 for a 30-minute call.
Providers and DOC officials often describe free tablets as a gift to incarcerated people, but they more closely resemble a corporate investment than a gift. For the companies, free tablets with expensive services more than pay for themselves down the line. And for prison administrators, tablets pave the way for the elimination of essential services. We’ve already seen prisons eliminate:
Law libraries. South Dakota eliminated its paralegals and physical law library after rolling out tablets. A subsequent lawsuit alleged that the tablet software meant to replace the law library is often unusable, and deprives incarcerated people of meaningful access to the courts.
Physical books. In 2018, Pennsylvania ended book donations to incarcerated people in favor of costly e-books, many of which were lifted directly from the free online library at Project Gutenberg (this policy was ultimately repealed and replaced with a cumbersome policy requiring book donations go through a “secure processing center” before being delivered to incarcerated people). New York and Maryland also tried to end book donations (before public pressure forced them to backtrack), and one large Florida jail even took away Bibles, replacing them with low-quality e-Bibles on tablets. In Cook County, Illinois, the sheriff’s office declared “paper products” contraband in 2023 and has limited access to books, offering tablets as an “alternative.”
Music and Mp3 players. In 2017, the Florida Department of Corrections transitioned from MP3 players to tablets and people who had bought hundreds or thousands of dollars of music lost access to the music on the MP3 players, as they were confiscated as contraband when replaced with tablets.
Educational programming. Tablets are increasingly being used to supplement – and supplant – in-person higher education in prisons, leading to a “subpar educational experience” and significant technical difficulties in many state prisons, including in Missouri and Florida. In Massachusetts in 2022, the Department of Corrections chose to not reapply for more than $2 million in state educational grants for prison programs, and instead encouraged using tablets (which the state has already spent $14 million on) that are “pre-loaded with educational materials that they can use to study on their own” (the DOC maintains that this is in an effort to “offer more enrichment,” rather than replace existing teachers and programs).
All this being said, there is nothing inherently wrong with tablet technology, in or out of a prison setting. It’s certainly possible to imagine using tablet technology to substantially improve prison life — if states can ever learn to distinguish truly innovative policies from high-tech ploys to cut costs.
 The Vera Institute of Justice’s
 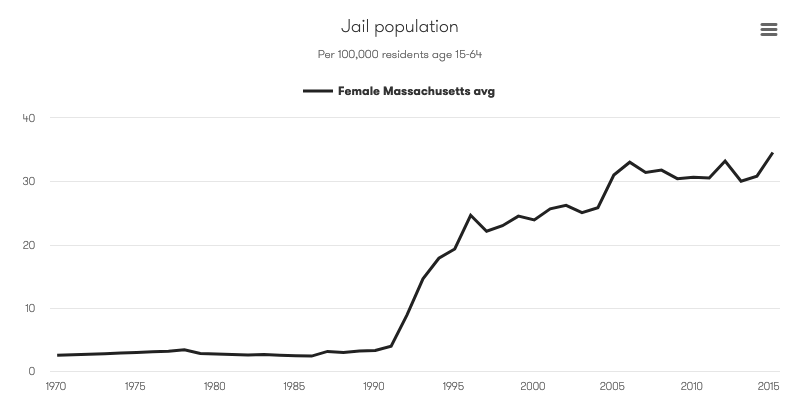 The Vera Institute of Justice’s
  The pretrial population in Massachusetts jails has increased for decades, while the number of people serving sentences there has fallen dramatically since 1993.
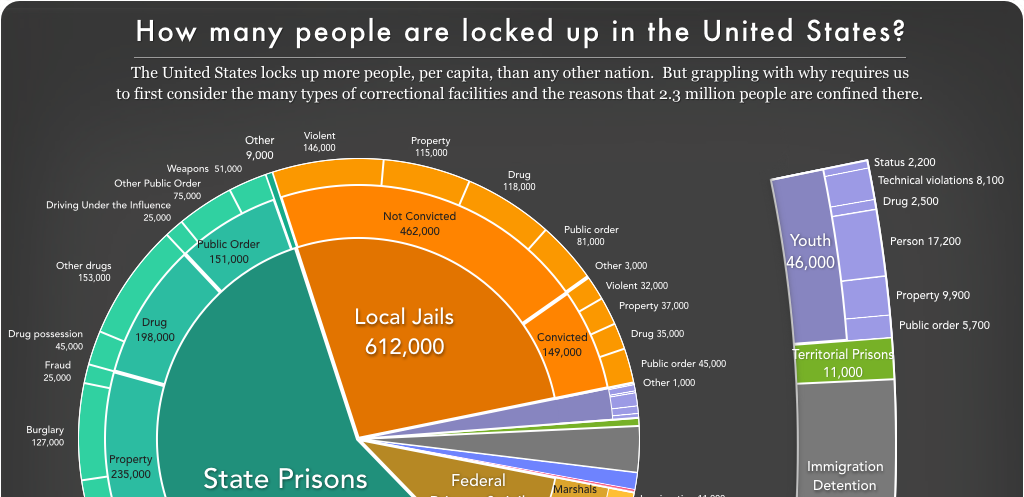


