We are looking for our next Creator-in-Residence to produce engaging and informative social video content about the problems in the American criminal legal system.
Support us
Can you make a tax-deductible gift to support our work?
Multiple Democratic presidential candidates have staked their campaigns on promises to fight for economic justice and protect low-income people from ruin. So it’s mysterious and frustrating that none of these candidates have proposed to end our justice system’s criminalization of poverty – at least beyond the occasional nod to ending money bail.
These candidates are missing an opportunity. The incomes of people in U.S. prisons and local jails are overwhelmingly low, and one in two American adults has had a close relative incarcerated, meaning that a candidate who understands the criminalization of poverty could propose transformative reforms and speak to a huge number of voters. In particular, candidates are missing an opportunity to speak to Black voters, who are hit hardest by policies that punish poor people.
To be sure, many Democratic candidates have alluded to economic inequality in connection with criminal justice reform — and Bernie Sanders even uses the phrase “criminalizing poverty” on his campaign website — but I’ve seen no indication that any of the candidates can speak to either the specifics or the scale of this problem. Candidates must go beyond criticizing money bail, and promise to end the unequal treatment of poor people at every stage of the justice process:
1. End poverty-related arrests and jail bookings. Far too many Americans who can’t afford housing, drug treatment or mental health services are instead arrested on minor charges related to their homelessness or illness. Many others end up in jail because they can’t afford burdensome fines and fees. An unfortunate downstream effect is jail overcrowding, which leads counties – largely in rural areas – to spend public money on harmful jail expansion rather than social welfare.
Presidential candidates should commit to helping state and local governments shift their priorities, making it easier to support low-income people and harder to jail them:
Equip cities and towns with universal housing, mental health services, and drug treatment, and invest in public schools and after-school programs in cash-strapped school districts.
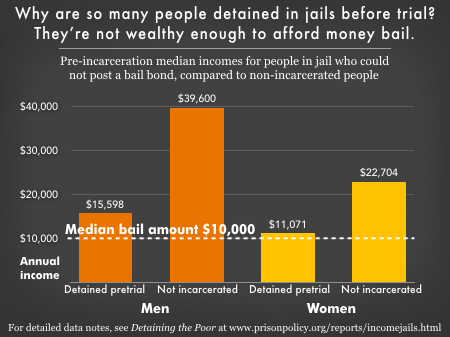
2. Guarantee poor people equal justice before trial. Two major injustices — pretrial detention and lack of access to counsel — ensure that low-income people are disproportionately convicted. Pretrial detention doesn’t just make defendants more likely to plead guilty; it also puts them at risk of losing their jobs and homes, and imposes huge costs on their families, before they’re ever convicted.
Candidates should promise to:
Ensure that local public defender systems are fully funded, that they no longer charge co-pays to defendants, and that counsel is guaranteed at any hearing that could result in detention.
Incentivize counties to drastically reduce pretrial detention by ending commercial money bail, and replacing it with release on recognizance, unsecured bonds, and other alternatives.
Use the power of the Federal Communications Commission to regulate the cost of phone calls from jail, which can strain public defenders’ resources, not to mention those of family members.
Subsidize county-level pretrial services to help low-income people make their court dates, such as text reminders and free childcare at court.
3. Stop forcing low-income families to subsidize the prison system. When someone goes to prison, their loved ones become their source of financial support. The financial pressure on these families grows when prisons fail to provide basic services, often driving families into debt. It shouldn’t be on relatives — disproportionately women — to pay for phone calls, medical care, nutritious food and educational resources for those behind bars, often when they’ve just lost a breadwinner.
Presidential candidates should commit to paying for incarcerated people’s needs to lift this burden on families:
Incentivize states and counties to pay for the cost of phone calls, email, and other technologies that allow incarcerated people to stay connected to their families.
Use the muscle of federal agencies like the Consumer Financial Protection Bureau and Federal Trade Commission to regulate the market for prison services, such as money transfer services (which currently charge families exorbitant deposit fees).
Restore Pell Grants to incarcerated people, and fully fund in-prison programs granting high school and college degrees.
4. Protect people from going back to prison just because they’re poor. Incarcerated people who come from under-resourced neighborhoods tend to return to those same neighborhoods after prison, now saddled with criminal records and far poorer than before.
Presidential candidates should avoid old narratives about how more surveillance, monitoring and job training are needed to “reduce recidivism” among people leaving prison. Instead, they should call the reentry process what it is: a period of extreme vulnerability that mostly affects impoverished people, and that can’t be improved without serious investments in formerly incarcerated people’s welfare. They should commit to:
Identify the communities to which most formerly incarcerated people return, and subsidize additional low-income housing, drug treatment and mental health services in those communities.
Help states create Departments of Reentry that connect people nearing release to permanent housing, medical care, and other resources.
Incentivize states to pass laws expanding criminal record expungement, including automatic expungement for people convicted of minor offenses.
End the harmful restrictions on association that prohibit formerly incarcerated people from helping each other rebuild their lives.
Restore welfare benefits, including housing assistance, to people with criminal records.
Urge states to abolish probation and parole fees, including fees for ankle monitors. End so-called “pay-only” probation schemes, which extract fees without providing any “services” at all.
Incentivize states to “ban the box” on job applications, and to end restrictions on occupational licenses that lock people with criminal records out of good jobs.
Expand federal tax benefits for businesses that hire people with criminal records.
Incentivize states to end laws suspending driver’s licenses for non-driving offenses.
To be sure, there are many other policy changes that could help end the criminalization of poverty; this list is only a starting point. But it should be alarming that most of these policy options have gone unmentioned by any presidential candidate. Until the candidates commit to ending our criminal justice system’s abuse of poor people from arrest to release (and afterwards), their visions for economic justice won’t be complete.
By now, most people who pay any attention to criminal justice reform know better than to label people convicted of drug offenses “drug offenders,” a dehumanizing label that presumes that these individuals will be criminals for life. But we continue to label people “sex offenders” – implying that people convicted of sex offenses are somehow different.
A new report released by the Bureau of Justice Statistics should put an end to this misconception: The report, Recidivism of Sex Offenders Released from State Prison: A 9-Year Follow-Up (2005-2014), shows that people convicted of sex offenses are actually much less likely than people convicted of other offenses to be rearrested or to go back to prison.
But you wouldn’t know this by looking at the report’s press release and certain parts of the report itself, which reinforce inaccurate and harmful depictions of people convicted of sex offenses as uniquely dangerous career criminals. The press release and report both emphasize what appears to be the central finding: “Released sex offenders were three times as likely as other released prisoners to be re-arrested for a sex offense.” That was the headline of the press release. The report itself re-states this finding three different ways, using similar mathematical comparisons, in a single paragraph.
What the report doesn’t say is that the same comparisons can be made for the other offense categories: People released from sentences for homicide were more than twice as likely to be rearrested for a homicide; those who served sentences for robbery were more than twice as likely to be rearrested for robbery; and those who served time for assault, property crimes, or drug offenses were also more likely (by 1.3-1.4 times) to be rearrested for similar offenses. And with the exception of homicide, those who served sentences for these other offense types were much more likely to be rearrested at all.
The new BJS report, unfortunately, is a good example of how our perception of sex offenses is distorted by alarmist framing, which in turn contributes to bad policy. That this publication was a priority for BJS at all is revealing: this is the only offense category out of all of the offenders included in the recidivism study to which BJS has devoted an entire 35-page report, even though this group makes up just 5% of the release cohort. This might make sense if it was published in an effort to dispel some myths about this population, but that’s not what’s happening here.
Every piece on recidivism should come with a warning label
Whenever we talk about recidivism, it’s important to understand that the data itself is categorically flawed.
Any time we talk about recidivism, it’s important to understand that recidivism data – which is so essential to the idea of a permanent “sex offender” – is categoricallyflawed. “Recidivism” suggests a relapse in behavior that leads to a return to criminal offending. As in the BJS study, this is often measured by post-release arrests (rearrest), but arrest does not suggest conviction or even actual guilt; of all recidivism measures, rearrest casts the widest net.2 Usually, these measures also don’t account for what the post-release offense is, even though common sense tells us that a post-release arrest for a liquor law violation is very different than an arrest for another sex offense. Better measures to indicate a return to criminal behavior might be reconviction or receiving a new prison sentence, but most jurisdictions don’t track all of these indicators, and certainly not with much detail.3 Finally, timeframes matter, since rearrest is much more likely soon after release, and the longer people go without reoffending, the lower their risk of ever doing so. This BJS report offers a remarkably long look-back period, but such a long period also risks correlating criminal behaviors that stem from unrelated motivations or circumstances.
For more on the myriad problems with recidivism data, see:
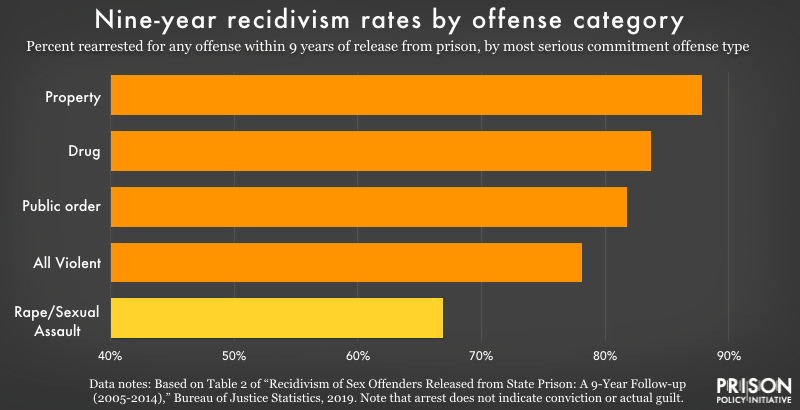
Framing aside, the recidivism data presented in the BJS report can offer helpful perspective on the risks posed by people after release. Whether measured as rearrest, reconviction, or return to prison, BJS found that people whose most serious commitment offense was rape or sexual assault were much less likely to reoffend after release than those who served time for other offense types. The BJS report shows that within 9 years after release:
Less than 67% of those who served time for rape or sexual assault were rearrested for any offense, making rearrest 20% less likely for this group than all other offense categories combined (84%). Only those who served time for homicide had a lower rate of rearrest (60%).
People who served sentences for sex offenses were much less likely to be rearrested for another sex offense (7.7%) than for a property (24%), drug (18.5%), or public order (59%) offense (a category which includes probation and parole violations).
Only half of those who served sentences for rape or sexual assault had a new arrest that led to a conviction (for any offense), compared to 69% of everyone released in 2005 (in the 29 states with data).
While the data was more limited on returns to prison,1 the study found that within 5 years after release, people who had served sentences for rape or sexual assault also had a lower return-to-prison rate (40%) compared to the overall rate for all offense types combined (55%). BJS notes that some of these returns to prison were likely for parole or probation violations, but because of data limitations, it is impossible to say how many were for new offenses, much less how many were for rape or sexual assault.
In sum, the BJS data show that people who served time for sex offenses had markedly lower recidivism rates than almost any other group. Yet the data continue to be framed in misleading ways that make it harder to rethink the various harmful and ineffective punishments imposed on people convicted of sex offenses.
The recidivism data suggest that current legal responses to people convicted of sex offenses are less about managing risk than maximizing punishment. The desire for retribution is understandable; unquestionably, rape and sexual assault inflict serious and lasting trauma. But our criminal justice system does a poor job of providing survivors of rape, sexual assault, and other violent crimes what they really want. In a 2016 survey of crime survivors, the Alliance for Safety and Justice found that, “Survivors of violent crime — including victims of the most serious crimes such as rape or murder of a family member — widely support reducing incarceration to invest in prevention and rehabilitation and strongly believe that prison does more harm than good.” But more prison time is the default response: those released after serving sentences for rape and sexual assault served longer sentences, with a median sentence of 5 years (compared to 3 years for all others combined) and over a quarter serving 10 years or more before release.
And for many people convicted of sex offenses, confinement doesn’t end when their prison sentence does. Twenty states continue to impose indefinite periods of involuntary confinement under civil commitment laws – after individuals have completed a sentence (or, in some cases, before they are even convicted). Proponents justify the practice as “treatment,” but conditions of civil commitment are punitive and prison-like, and this confinement is hard to justify with the recidivism data we have. The likelihood of post-release arrest for another rape or sexual assault for this group is less than 2% in the first year out of prison, and after 9 years, less than 8% have been rearrested for a similar offense. Those who are released at age 40 or older are even less likely to be rearrested for another sex offense, with re-arrest rates about half those of people who are released at age 24 or younger.
After prison, a number of other special restrictions make reentry especially challenging for those who have served sentences for sex offenses, including registration, public notification, and restrictions to residence and employment. A current proposal suggests banning them from using New York City mass transit. (Even before release, some restrictions make it difficult for some people to leave prison when they would otherwise be paroled.) But these restrictions tend to cause more problems than they solve. Residence restrictions in particular have contributed to homelessness and other problems in cities where they leave little room for returning citizens. According to a 2015 U.S. Department of Justice brief, “residence restrictions may actually increase offender risk by undermining offender stability and the ability of the offender to obtain housing, work, and family support.”
In another recent academic article, Hanson et al. agree that these additional restrictions are “justified on the grounds of public protection,” even though the underlying assumptions may be wrong: “Individuals are targeted because policy-makers believe they are likely to do it again. This is a testable assumption, and, as it turns out, not entirely true.” Their analysis shows that individual recidivism risk varies widely, can be low enough to be indistinguishable from that of people convicted of non-sex offenses, and drops predictably over time. The data published by BJS track with those findings.
Collectively, the research seems fairly clear: our responses to people convicted of sex offenses do not reflect the actual – generally low – risks they present. Instead of panicking about the small portion who reoffend after release, it’s time we talk more rationally about responses that effectively support desistence from crime – and serve the actual needs of victims of violence.
Footnotes
Only 23 states could provide the necessary data for the 5-year follow-up period, and only 17 could do so for the entire time frame. The BJS report only includes return-to-prison rates for the first 5 years after release in the 23 states with the necessary data. ↩
Conversely, it also only captures those behaviors that are caught by police. People who break laws after release but are never arrested would not be captured in recidivism data at all. Police presence and enforcement are therefore factors that affect recidivism statistics, as are prosecutorial decisions (for reconviction rates) and sentencing policies and practices (for reincarceration rates). ↩
While the BJS study compares overall rates of reconviction and returns to prison by most serious commitment offense, only the rearrest data allows us to compare post-release offenses by most serious commitment offense. ↩
Jails have been described as the criminal justice system’s “front door,” but jail incarceration typically begins with the police, with an arrest. Before any bail hearing, pretrial detention, prosecution, or sentencing, there is contact with the police. But despite their crucial role in the process, we know less about these police encounters than other stages of the criminal justice system.
In particular, the experiences of women and girls1 – especially Black women and other women of color – are lost in the national conversation about police practices. They are also largely invisible in the the data. But as Andrea Ritchie details in Invisible No More: Police Violence Against Black Women and Women of Color, women, too, are subject to racial profiling, use of excessive force, and any number of violations of their rights and dignity by police. In fact, women make up an increasing share of arrests and report much more use of force than they did twenty years ago. Yet while increasing recognition of women as a growing share of prison and jail populations has prompted facilities to adopt gender-responsive policies and practices, women’s rising share of arrests and other police contact has received less attention and policy response.
The current study
To shed more light on how women’s experiences at the front end of the criminal justice system differ from men’s experiences, we look at both arrest data and data about women’s other contacts with police. We first look at trends in arrest data from the FBI’s Uniform Crime Reporting (UCR) Program. To complement this data, we also examine differences in other police encounters reported in the Bureau of Justice Statistics (BJS) Contacts Between Police and the Public (CPP) reports, which are based on responses to the Police-Public Contact Survey (PPCS).
Critically, the UCR Program does not require police to report arrests by both sex and race/ethnicity, so that dataset offers no way to compare arrest trends of white, Black, and Latina women to each other or to their male counterparts. The PPCS partially fills that gap by including both sex and race/ethnicity of survey respondents; however, the BJS reports based on that survey do not engage this valuable intersectional data.2 The second section of this briefing includes our analysis of the most recent PPCS survey (conducted in 2015), to finally offer a view – from nationally representative data – of how women of different races and ethnicities experience police-initiated encounters differently than each other and men.
Part 1: Gender differences in interactions with police
Arrests: Women make up an increasingly large share of arrests
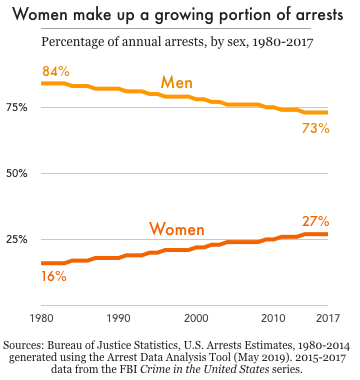
In the past two decades, the total number of arrests in the U.S. has dropped by more than 30 percent, from 15.3 million in 1997 to 10.6 million in 2017. However, this drop was mostly due to fewer arrests of men: the number of men arrested declined by 30.4 percent in that time, while the number of women arrested declined only 6.4 percent. As men’s arrest rates have fallen women’s arrest rates have remained fairly flat. As a result, women make up an increasingly large share of all arrests; as of 2017, women accounted for 27 percent of all arrests, up from 21 percent in 1997, and just 16 percent in 1980.3
An increase in arrests of women for drug offenses helps explain why women’s arrest rates have remained steady, even as crime rates have hit historic lows and men’s arrest rates have plummeted. Of the more than 2 million arrests of women in 2017, 13.9 percent were for drug abuse violations – second only to property crimes (15.8 percent), and far more frequent than arrests for violent crimes (3.8 percent). Over the past five years – while the country has been in the throes of the opioid epidemic – drug arrests have increased 6 percent among men, but almost 25 percent among women.4
Changes in arrest patterns over 5 years, by sex
Table 1. Total UCR arrests declined more dramatically among men than among women between 2013 and 2017, due in part to a much greater increase in arrests of women for drug violations. Source: Crime in the United States 2017 Table 35
Percent change over 5 years (2013-2017)
Male
Female
All arrests
-8.7%
-6.4%
Index violent crimes
+1.8%
+4.4%
Index property crimes
-18.8%
-24.9%
Drug abuse violations
+6.1%
+24.7%
Other police-initiated contact: Women interact with police more than arrest statistics suggest
A key finding from the Contacts Between Police and the Public series is the true scale of women’s interactions with police, which is far greater than arrest numbers alone suggest. While arrests are sometimes used as a measure of the “first stage” of involvement with the criminal justice system, many encounters between the public and police do not result in arrest. This is especially true for women, who account for a much greater share of public-police interactions than they do actual arrests.
In 2015, there were about 2.1 million arrests – but about 12 million police-initiated contacts5 – with women ages 16 and over.6 That means that for every woman arrested, five more women were approached by police, either in a traffic stop, street stop, or in the execution of an arrest warrant. All police-initiated contacts are non-voluntary encounters, which are more likely than resident-initiated contacts (e.g. calling the police for help) to lead to arrest, further justice involvement, and other negative outcomes. The 2015 survey shows that women made up almost half (44 percent) of all police-initiated contacts, 41 percent of traffic stops (in which they were the drivers), and 36 percent of street stops, compared with 27 percent of all arrests. This is a critical point when assessing the need for gender-responsive policing policies and practices: basing an analysis solely on arrests would grossly underestimate the non-voluntary interactions women have with police.7
Use of force: Nearly doubled for men since 1999, but more than quadrupled among women
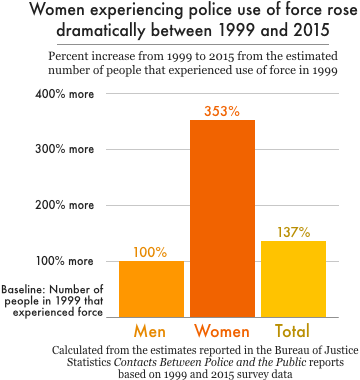
As with women’s share of arrests, women’s share of police encounters that involve the use or threat of force has increased significantly since 1999.8 That year, women made up just 13 percent of the approximately 422,000 people who experienced use of force during a police encounter. This percentage almost doubled by 2015, when women accounted for 25 percent of all people who experienced police use of force. Moreover, the total number of people experiencing police use of force more than doubled in that time, to 985,300 in 2015. But the increase in use of force was especially dramatic among women: the number of women experiencing police use of force in 2015 was 4.5 times (353%) the number experiencing force in 1999, up from 55,181 to 250,200. Meanwhile, the number of men experiencing police use of force doubled from 366,533 in 1999 to 735,100 in 2015.
Traffic stops: Stops declined more for men, and women make up a larger share of those searched during stops
The 2015 survey shows another noteworthy shift in the numbers of men and women stopped by police while driving. While the percentages of both men and women experiencing traffic stops declined since 1999, women saw a smaller decline in stops than men did. In 2015, 10 percent of male drivers were stopped (down from 12.5 percent in 1999) compared with 7 percent of female drivers (down from 8.2 percent). These changes may sound small as percentages, but the decline in the rate among women actually masks a 378,000 increase in total number of traffic stops of women since 1999, while men were stopped 451,000 fewer times than in 1999.9
Women also make up a larger percentage of all people searched during traffic stops. In 1999, men who were stopped while driving were about four times as likely to be searched during the stop than women; by 2015, men were just twice as likely to be searched. The narrowing of this gap reflects a decline in searches of men; for women, the share of stops that resulted in search remained the same, at 2.3 percent. In 1999, police searched the driver or vehicle in 9.4 percent of stops of men, which amounts to over one million stops involving a search. In 2015, however, the percentage of stops involving male drivers that resulted in search or arrest dropped by half, to 4.7 percent – or over 500,000 stops. Female drivers, however, saw no change in their likelihood of search or arrest during a traffic stop.
Part 2: Race, Ethnicity, and Gender in Police Stops
Data from the Police-Public Contact Survey (PPCS) allow us to take a more intersectional view of women’s contact with police, going beyond gender differences to include racial and ethnic differences among men and women, too. Again, this is the only national data we are aware of that enables any intersectional analysis of civilian experiences with police, and the Bureau of Justice Statistics (BJS) does not attempt this analysis in its report on the survey’s results. That arrest data indicate racial disparities is well documented, but little is known – outside of individual stories – about how Black, Latinx, and white women experience police contact differently from each other and from their male counterparts.
Our analysis examines how race and gender, together, affect police-initiated stops, including arrests and use of force that occur during stops. It’s worth noting that police stops and arrests during these stops are relatively infrequent events, and that our findings are based on survey data from over 90,000 respondents, not the total U.S. population. That said, we find that the race, ethnicity, and gender affect policing outcomes differently depending on the context:
Both race and gender affect the likelihood of a traffic stop.
Race seems to matter more for men when it comes to street stops and more for women when it comes to arrests during a stop.
Racial disparities are most apparent in use of force during a police-initiated stop, with Black and Latino men experiencing use of force more often than other groups, and Black women reporting similar use of force rates to white men.
Traffic stops: Black women are more likely than white or Latina women to be stopped
Both race and gender affect a person’s chances of being stopped by police while driving (excluding accidents or when they were passengers). Most broadly, the PPCS data shows that women were less likely than men to be stopped, and Black drivers were more likely to be stopped than white and Latinx drivers.10 More specifically, Black women were about 17 percent more likely to be in a police-initiated traffic stop than white women, and 34 percent more likely to be stopped than Latina women. Among men, Black drivers were about 12 percent more likely than white drivers – and 17 percent more likely than Latino drivers – to be stopped.
Percentage of drivers who experienced a vehicle stop in 2015
Table 2. See the Appendix for tables that show the statistical significance of differences between Black and Latina women compared to white women and all groups compared to white men.
Women
White
7.1%
Black
8.3%
Latina
5.5%
Men
White
9.9%
Black
11.1%
Latino
9.2%
These estimates are not adjusted for driving behavior, however, and given reported differences in driving patterns between demographic groups, it is likely that traffic stops of Black and Latina women per mile driven could be even higher compared to other groups than the survey data suggest.11
Street stops: Significant racial disparities among men, but not women
In contrast to traffic stops, the survey data on police-initiated street stops only showed significant racial disparities among men – not among women. Less than one percent of white, Black, and Latina women surveyed experienced a police-initiated street stop in 2015. However, the percentage of Black men who experienced a street stop (2.2 percent) was double that of white men (1 percent). A slightly greater portion of Latino men (1.2 percent) reported experiencing a street stop than white men, but this difference was not statistically significant.
Percentage who experienced a street stop in 2015
Table 3. See the Appendix for tables that show the statistical significance of differences between Black and Latina women compared to white women and all groups compared to white men.
Women
White
0.7%
Black
0.7%
Latina
0.5%
Men
White
1.0%
Black
2.2%
Latino
1.2%
Arrests during stops: Significant racial disparities among women, but not men
Police-initiated traffic and street stops sometimes result in arrest, and the survey data show that Black women were at least as likely as white men to be arrested during a stop. White women, meanwhile, were about half as likely as white men to be arrested during a stop. Black women were arrested in 4.4 percent of police-initiated stops, which was roughly three times as often as white women (1.5 percent), and twice as often as Latinas (2.2 percent).
Among men, racial disparities in arrest-during-stop rates appear to be more related to the frequency of being stopped than the likelihood of being arrested if stopped. For women, on the other hand, racial disparities seem to be more related to what happens during the stop than whether they are stopped at all.
Percentage who were arrested during a traffic or street stop in 2015
Table 4. See the Appendix for tables that show the statistical significance of differences between Black and Latina women compared to white women and all groups compared to white men.
Women
White
1.5%
Black
4.4%
Latina
2.2%
Men
White
2.7%
Black
3.5%
Latino
4.2%
Use of force during stops: Rates of Black women similar to white men; Black and Latino men most likely to experience force
About one percent of people surveyed indicated that they had experienced force or threat of force12 during a police-initiated stop, but use of force rates were higher for Black women than white or Latina women,13 and were highest among Black and Latino men. Black women actually experienced use of force during a stop about the same rate as white men, while white women were significantly less likely to experience use of force than white men. The marked gender disparity in reported use of force that is included in the BJS report Contacts Between Police and the Public, 2015 (2.7 percent for men versus 0.9 percent for women) masks the reality that these percentages are averages of racial and ethnic groups that are experiencing force at markedly different rates.
Percentage who experienced force during a police-initiated stop
Table 5. See the Appendix for tables that show the statistical significance of differences between Black and Latina women compared to white women and all groups compared to white men.
Women
White
0.3%
Black
0.9%
Latina
0.32%
Men
White
0.8%
Black
3.6%
Latino
2.5%
Conclusion
As women become a more visible presence in our criminal justice system, it becomes increasingly urgent that we understand their experiences within it, both to better meet their needs and to enhance our analysis of how justice works (and doesn’t work) in the U.S. The policing of women, especially women of color, has received less attention than the policing of men; it’s even received less attention than the incarceration of women. Similarly, while correctional facilities are increasingly adopting gender-responsive policies and programs, there have been virtually no concerted efforts to create or implement trauma-informed or gender-responsive policing practices.
This oversight has serious consequences. Rates of sexual and physical abuse are high among justice-involved women – estimates range from half to over 90 percent – and are much higher than reported for men. Almost a third (31 percent) of women in jail have a current serious mental illness, which is over twice the rate among men in jail (14.5 percent) and over six times the rate among women in the general population (4.9 percent). With 12 million women per year experiencing police-initiated contacts – many of which involve searches, use of force, and other traumatizing experiences – it is critical that law enforcement take seriously the need for more female police officers,14 protocols, and trainings that can improve police-public interactions and reduce the harms to women.
Finally, the invisibility of Black women and other women of color in the national discourse about policing – even in the wake of high-profile tragedies like the arrest and jail death of Sandra Bland – means that the full scope of racial discrimination in policing is unknown, and certainly understated. Making policing more transparent, accountable, effective, and just will mean bringing the experiences of these women to light.
Data sources and methodology
Arrest data come from the FBI Uniform Crime Reporting Program (reported annually in the Crime in the United States series). Other police contact data are from the Bureau of Justice Statistics’ Police-Public Contact Survey (PPCS), most recently conducted in 2015 and published in 2018. The police contact data in Part 1 comes from the BJS reports based on the results of that survey, in the Contacts Between Police and the Public series. The analysis in Part 2 used the raw PPCS data, available from the National Archive of Criminal Justice Data (NACJD) here.
Using the PPCS data for the analysis in Part 2, respondents were coded into one of eight mutually exclusive sex-race categories: Black female, Black male, Latina (female), Latino (male), white female, white male, non-Hispanic other race female, and non-Hispanic other race male (the last two categories include multi-racial respondents, and results were not included in this report because of the small sample sizes and the disparate racial and ethnic categories they included.)
Our analysis focuses on non-voluntary, police-initiated stops. Therefore, the two types of police contacts included in the analysis were “stopped by police in public place (non-vehicle)” and “stopped by police while driving.” Types of police contacts excluded from the analysis were: “respondent in vehicle stopped by police” (i.e. not driving), “in traffic accident,” “other police stops or approaches,” “crime/non-crime emergencies,” and “seeking other help from police.”
“Arrests” in our analysis of the PPCS (in Part 2) refer to only those arrests that occurred during non-vehicle (street) stops, vehicle (traffic) stops, or either type of stop. Use of force refers to whether, during the encounter, the police officer did any of the following to the respondent: push, grab, kick, hit, spray with chemical or pepper spray, use an electroshock weapon (Taser), or point a gun at them.
We used Wald tests to determine whether there were statistically significant differences in average (mean) incidence of stops, arrests, and use of force between each sex-race category in comparison to two references categories: white women and white men. We used the weighting provided by the Bureau of Justice Statistics to approximate a nationally representative sample.
Acknowledgements: This briefing was a collaborative effort, but Wendy Sawyer served as the editor and created the graphics. We thank Public Welfare Foundation for their support of our research into the experiences of women who come into contact with the criminal justice system.
Footnotes
The terms “women” and “girls” in the introductory and concluding sections of this briefing are inclusive of transgender women and girls. However, the government data we reference (both the FBI’s arrest data and the Bureau of Justice Statistics police contact data) do not address how transgender people are classified. The FBI data are reported by police agencies around the country, and therefore likely vary in terms of how transgender people are classified by different agencies. The BJS Police-Public Contact Survey (as a supplement to the National Crime Victimization Survey) asks respondents to identify as either male or female. ↩
While the public report series Contacts Between Police and the Public does not provide breakdowns by sex and race/ethnicity, this information is available in the raw data from the 2015 Police-Public Contact Series. ↩
These percentages were calculated using estimates from the Bureau of Justice Statistics Arrest Data Analysis Tool, which provides estimates by sex from 1980 to 2014 (as of May 2019). ↩
The increase in the number of drug arrests from 2013 to 2017 was also higher for women than for men: There were 54,738 more arrests of women for drug violations in 2017 than in 2013, versus an increase of 48,887 arrests of men for drug violations over the same time period. See Crime in the United States 2017 table 35 for these five-year arrest trends. ↩
Police-initiated contacts include those where police approached or stopped respondents, such as being pulled over while driving (an example of a traffic stop) or being stopped by police while in a public place (an example of a street stop). Other types of contact excluded from this analysis include resident-initiated contact (such as calling the police for help or to report a crime) and contact resulting from traffic accidents. ↩
BJS indicated in the methodology that people involved in police-initiated contacts might have been somewhat less likely to respond to the survey than those without police-initiated contacts, which may underestimate this contact. ↩
Since women’s share of police-initiated stops has remained fairly flat since 1999 but their share of arrests has increased, we looked into whether those stops are more likely to result in arrest than they were twenty years ago. We calculated the ratio of arrests to people experiencing police-initiated contact for both women and men age 16 or older in 1999 and 2015, and found that while that ratio has fallen for both sexes, it’s decreased more dramatically for men. In 1999, among men, there were 0.69 arrests for each man whose only police contact that year was police-initiated; among women, there was 0.24 arrests for each woman who only experienced police-initiated contact. By 2015, the ratio among men had fallen by 60 percent to 0.28 arrests for each man with any police-initiated contact, but the ratio for women fell by only 29 percent to 0.17 arrest per woman with police-initiated contact. (Methodology notes: The measures are slightly different in these two surveys, with the 1999 measure being “police initiated contact was only contact” and the 2015 measure including any police-initiated contact during the year. We calculated the ratios using data from the 1999 Contacts Between Police and the Publicspreadsheet cpp99f2.csv, estimates of women and men experiencing any contact with police in table 1 of the 1999 Contacts report, Table 1 in the 2015 Contacts report, the BJS Arrest Tool for 1999 arrest estimates, and Crime in the United States 2015 tables 39 and 40.) ↩
1999 is the first year BJS published a Contacts Between Police and the Public report that is comparable to later reports. A pilot test of the PPCS was conducted in 1996 but it used a smaller sample size and a less detailed set of questions. We did not attempt to compare those results to later years. ↩
BJS estimates that there were more women drivers in 2015, which would explain the increase in the total number of stops of women drivers. ↩
It should also be noted that the survey uses U.S. Census definitions of race and ethnicity: Black, Latinx, and white are mutually exclusive categories. ↩
The U.S. Department of Labor data indicate that car ownership varies by race and ethnicity, with 90 percent of white, 74 percent of African-American and 83 percent of Latinx households owning at least one car in 2015. In addition, a National Highway Traffic Safety report indicates that, on average, men drive a third more miles per year than women (13,393 miles versus 8,854 in 2017), and that higher incomes are associated with more driving. Therefore, analyzing vehicle stops on a per-mile basis could show very different patterns. For example, if Black and Latina women drive the fewest miles due to factors of race, gender and income, their vehicle stops per mile driven could be significantly higher compared to other groups than the PPCS data suggest. ↩
Use of force was defined as a push/grab/hit/kick, use of pepper spray or electroshock weapon (Taser) or having a gun pointed at them. The BJS Contacts report included handcuffing, but because that can be standard protocol during arrests, it was not included here. ↩
0.8 percent of Black women surveyed reported use or threat of force during a police-initiated stop, compared to 0.3 percent of white women and 0.32 percent of Latina women. However, this difference was not statistically significant. ↩
Appendix Table 1 provides the data behind the graph titled “Women experiencing police use of force rose dramatically between 1999 and 2015.”
Use of force has increased overall, but most dramatically among women
Appendix Table 1.
1999
1999
2015
2015
1999 to 2015
Percentage of all people who experienced use of force during a police encounter
Estimated number of people that experienced use of force during a police encounter
Percentage of all people who experienced force during a police encounter
Estimated number of people experienced use of force during a police encounter
Percent increase in number of people experiencing police use of force
Men
87%
366,533
75%
735,100
100%
Women
13%
55,181
25%
250,200
353%
Total
100%
421,714
100%
985,300
137%
Expanded tables from Part 2
Reading these tables: There are two reference groups for looking at whether differences are statistically significant. First, we look at whether the differences in contact for Black and Latina women compared to white women are statistically significant. We then look at all sex-race groups compared to white men. The level of statistical significance is indicated for each difference, for example, “p<0.1%” indicates that a difference is statistically significant at the 90% confidence level. Where there isn’t a comparison made (for example, white women are not compared to themselves), the cell is marked with “–” and when there is no statistically significant difference between groups, this is indicated simply with “No.”
Percentage of drivers who experienced a vehicle stop in 2015
Appendix Table 2.
Percentage who experienced a vehicle stop
Is difference from white women statistically significant?
Is difference from white men statistically significant?
Women
White
7.1%
—
Yes (p<.01)
Black
8.3%
Yes (p<.05)
Yes (p<.01)
Latina
5.5%
Yes (p<.01)
Yes (p<.01)
Men
White
9.9%
—
—
Black
11.1%
—
Yes (p<.1)
Latino
9.2%
—
No
Percentage who experienced a street stop in 2015
Appendix Table 3.
Percentage who experienced a street stop
Is difference from white women statistically significant?
Is difference from white men statistically significant?
Women
White
0.7%
N/A
Yes (p<.01)
Black
0.7%
No
Yes (p<.1)
Latina
0.5%
No
Yes (p<.01)
Men
White
1.0%
—
—
Black
2.2%
—
Yes (p<.01)
Latino
1.2%
—
No
Percentage who were arrested during a stop in 2015
Appendix Table 4.
Percentage who were arrested during a stop
Is difference from white women statistically significant?
Is difference from white men statistically significant?
Women
White
1.5%
—
Yes (p<.01)
Black
4.4%
Yes (p<.05)
No
Latina
2.2%
No
No
Men
White
2.7%
—
—
Black
3.5%
—
No
Latino
4.2%
—
No
Percentage who experienced force during a police-initiated stop in 2015
Appendix Table 5.
Percentage who experienced force during a stop
Is difference from white women statistically significant?
Is difference from white men statistically significant?
All too often, proposals to expand local jails receive no pushback or critical attention. A new report helps counties think twice.
May 6, 2019
Easthampton, Mass. – A new Prison Policy Initiative report gives cities and counties a long-needed tool for fighting mass incarceration: a guide to preventing unnecessary jail expansion. The report, Does our county really need a bigger jail?, lays out 33 questions that local decision-makers should ask in evaluating proposals for new or bigger jails.
“It’s very common today for jails to be overcrowded, because the number of people in jails nationwide has tripled in the last 30 years,” said report author Alexi Jones. “But in too many counties, jail growth is rooted in known policy failures like an overreliance on money bail. Local policymakers owe it to their constituents to find out if there is a better fix to overcrowding than just building a new or bigger jail.”
The report’s 33 questions for policymakers include:
On a typical day, how many people are confined in the existing jail who have not been convicted?
How many people in the county are incarcerated because they cannot afford to pay fines and fees?
What specialized “diversion” courts and treatment programs is the county using to divert people struggling with substance use and mental illness into more effective treatments than jail?
Do official cost estimates for building new jail space include not only the cost of construction, but the cost of debt service on the loan, annual operation costs, and collateral costs such as adverse impacts on public health?
“Building new jail space typically costs tens of millions of dollars or more, even as other options that are both more cost-effective and more compassionate are ignored,” said Jones. “If policymakers can’t answer these questions about why more jail space is necessary, they should not be undertaking jail expansion.”
For all 33 questions, the report also offers a set of alternatives and best practices, including:
Releasing more pretrial defendants on their own recognizance, and investing in pretrial services to help them make their court dates;
Requiring judges to set fines and fees based on a defendant’s ability to pay;
Investing in specialized “problem-solving” courts for people with mental health or substance use disorders that serve as true alternatives to jail time.
The report’s recommendations are accompanied by helpful graphics, as well as examples of local and state governments successfully implementing alternatives to jail expansion. “We know that the answer to mass incarceration begins at the local level,” said Jones. “That’s why it’s critical to help cities and counties think beyond jail expansion when it comes to improving public safety.”
At a time when phone calls for the rest of us cost almost nothing, there is no reason to force the poorest families in Iowa to pay outlandish rates.
April 26, 2019
For immediate release — The Prison Policy Initiative has filed objections to five phone companies’ proposed phone rates for Iowa county jails. At a time when the cost of a typical phone call is approaching zero, phone providers in Iowa jails frequently charge incarcerated people and their families 30 cents per minute or more for a phone call. (And one provider charges as much as $4.41 for the first minute.)
In January, the Iowa Utilities Board required these providers to file rate disclosures – or “tariffs” – for state approval. By state statute, the Utilities Board must ensure that rates are just and reasonable and that “no unreasonable profit is made.” The Prison Policy Initiative’s research has found that phone calls from Iowa’s jails are among the most expensive in the nation, and more than four times as expensive as calls from the state’s prison system.
In February, the Prison Policy Initiative report State of Phone Justice uncovered the cost of phone calls in over 2,000 jails nationwide, explaining why sheriffs sign lucrative phone contracts that prey on people in jail and their families:
Phone providers compete for jail contracts by offering sheriffs large portions of the revenue – and then charge exorbitant phone rates.
Providers exploit sheriffs’ lack of experience with telecommunications contracts to slip in hidden fees that fleece consumers.
State legislators, regulators and governors traditionally pay little attention to jails, even as they continue to lower the cost of calls home from state prisons.
The report found that calls home from Iowa jails are the 13th most expensive in the nation. “There is no reason to force the poorest families in Iowa to pay these outlandish rates, particularly at a time when phone calls for the rest of us cost almost nothing,” said Peter Wagner, Executive Director of the Prison Policy Initiative.
The objections were filed with the research assistance of volunteer attorney Stephen Raher, and the organization is now being represented pro bono before the Iowa Utilities Board by David Yoshimura of Faegre Baker Daniels in Des Moines.
Yesterday, the Iowa Utilities board granted our request to intervene and docketed the tariffs for further review. Further comments about the proposed tariffs are due May 13.
People on probation are much more likely to be low-income than those who aren't, and steep monthly probation fees put them at risk of being jailed when they can't pay.
Over 3.6 million people are under probation supervision in the U.S., and in most states, they are charged a monthly probation fee. The problem? Many of them are among the nation’s poorest, and they can’t afford these fees. From our previous research in Massachusetts – and from reports from around the country – we know that the burden of probation fees often falls disproportionately on the poor. To determine the extent of the problem nationally, we examined the incomes of people on probation in a recent survey, the National Survey of Drug Use and Health. Our analysis confirms that, nationwide, people on probation are much more likely than people not on probation to have low incomes.
The National Survey of Drug Use and Health (NSDUH) is an annual survey that asks respondents about a broad range of topics, including their annual income and whether they were on probation in the past 12 months. The inclusion of recent probation history in the survey makes it a valuable data source for criminal justice research; it comes closer than any other source to offering a recent, descriptive, nationally representative picture of the population on probation.1 Prof. Michelle Phelps of the University of Minnesota, for example, used this survey in her recent analysis comparing people on probation to those in prison, using educational attainment as a measure of economic status.
Our analysis of the 2016-2017 NSDUH data shows that people on probation typically have much lower incomes than those who aren’t on probation:
People on probation are much more likely to be low-income than those who aren’t on probation, and steep monthly probation fees often put them at risk of being jailed when they can’t pay. For a more detailed comparison, see the Appendix table.
Key findings from our analysis include:
Nationwide, two-thirds (66%) of people on probation make less than $20,000 per year.
Nearly 2 in 5 people on probation (38%) make less than $10,000 per year, well below the poverty line.
On the wealthier end of the spectrum, few people (9%) on probation have annual incomes of $50,000 or more, while more than a quarter (28%) of those not on probation make at least $50,000 per year.
Monthly probation fees may be just one of several fees that someone on probation has to pay regularly. As part of the conditions of their probation, an individual might have to pay court costs, one-time fees, monthly supervision fees, electronic monitoring costs, or any combination of these charges. Sometimes the law strictly defines the cost of these fees, and sometimes “reasonableness” is the only statutory guideline. Depending on the state, courts, departments of corrections, sheriffs’ departments, and the probation programs themselves can all collect revenue from these fees.
Even though the Supreme Court has said it is unconstitutional to incarcerate someone because they cannot afford to pay court ordered fines and fees, many courts effectively do just that. Judges often fail to consider the individual’s ability to pay (as opposed to their willingness to pay) and treat nonpayment of fees as a violation of probation. This flies in the face of many state statutes that allow incarceration only when there is evidence that the individual is able to pay but refuses.2 As a result, poor people on probation face a very real risk of being incarcerated because they can’t afford monthly fees. As the National Criminal Justice Debt Initiative shows, many state laws amount to “poverty penalties” and “poverty traps” and failure to pay can mean an extended probation sentence, driver’s license revocation, mandatory work program, or incarceration.
Unaffordable fees and low-income probation populations, select states
*In Massachusetts, the fees have two tiers, $50 for administrative and $65 for supervised probation. In Oklahoma, there are two separate monthly supervision fees, one up to $40 and another up to $20.
**Due to the small number of NSDUH respondents in Maine and South Carolina who were on probation at any time in the past 12 months, the survey does not make the necessary data available for those states as part of NSDUH’s efforts to protect respondents’ identities.
This table includes states where probation fees can cost $50 or more each month, and shows that in almost all of these states, over half (and even as many as 83%) of people on probation have annual incomes below $20,000. For them, unaffordable probation fees can lead to a cycle of poverty and incarceration. (Sources: Criminal Justice Debt Reform Builder, for probation fees, and the National Survey on Drug Use and Health: 2-Year RDAS (2016-2017) for income data on the population experiencing probation in the past 12 months.)
State
Monthly supervision fee
Portion of probation population making less than $20,000 per year
Colorado
Up to $50
48%
Idaho
Up to $75
67%
Illinois
$50
65%
Louisiana
$71 to $121
69%
Maine
$10 to $50
NA**
Massachusetts
$50 or $65*
52%
Michigan
Up to $135
67%
Mississippi
$55
67%
Montana
At least $50
64%
New Mexico
$15 to $150
83%
North Dakota
$55
77%
Ohio
Up to $50
62%
Oklahoma
Up to $60*
75%
South Carolina
$20 to $120
NA**
Washington
Up to 100
50%
Such high fees – and high stakes – defeat the purpose of probation. In theory, probation (often touted as an “alternative” to incarceration) allows people to continue to work and manage family responsibilities while under supervision. But people faced with unaffordable fees are more likely to violate the conditions of supervision, experience housing and food instability, and struggle to support their children. And when failure to pay is treated as a violation of probation, individuals can be incarcerated, have their probation extended, and/or lose public benefits like food stamps and supplemental security income.
Louisiana is an especially punishing state for poor people on probation. The average probation sentence there lasts three years, and probation fees are among the highest in the country, at $71 to $121 per month, even though 69% of people on probation make less than $20,000 per year. Data from a report by the state’s Justice Reinvestment Task Force shows just how unreasonable these fees are. In Louisiana in 2015:
While under community supervision, the average person owed $1,740 in supervision fees alone. (Supervision fees were just one type of a number of court-ordered fines and fees.)
On average, people under supervision could only pay about half of the imposed fees; at the end of their supervision term, the average person still owed 48% of their supervision fees.
Louisiana’s probation system creates impossible debts that unfairly burden poor probationers. As in many states, failure to pay can lead to license suspensions, extension of supervision terms, and incarceration.
Fortunately, this is slated to change. Under a new law going into effect in August 2019, Louisiana courts will hold hearings on ability to pay, and defendants may have their fees waived or reduced if the court finds that fees will cause substantial financial hardship. While the fees are still far too high, the new law offers hope for low-income people on probation. (It’s worth noting that judges, district attorneys, and court clerks whose offices benefit from the fees have fought to delay the implementation of the law.)
As long as probation sentences include unreasonable fees and harsh punishments for failure to pay them, probation will continue to punish people just for being poor. Some states have begun to implement reforms to reduce the unnecessary incarceration and other unintended consequences of their probation fee systems. But as our analysis shows, this is a widespread problem that every state imposing probation fees should address. States must acknowledge that people on probation are mostly low-income, and driving them further into poverty through monthly fees is cruel and counterproductive.
Footnotes
Although the survey does not ask about current probation status, the recency of their probation status makes those who have been on probation in the past 12 months a reasonable proxy for the general probation population. We therefore use the term “probation population” to refer to this group in our analysis. ↩
For state statutes that allow incarceration as a response to nonpayment of supervision fees, see these results from the Criminal Justice Debt Reform Builder. ↩
Appendix table: Percentage of Probation Population vs. Non-Probation Population in Each Category of Personal Annual Income (Source: NSDUH 2016-2017)
A merger between the two companies would have curtailed the ability of prisons and jails to choose a phone provider, to the detriment of incarcerated people and their families.
April 2, 2019
Easthampton, Mass. – Prison phone industry giant Securus has abandoned its attempt to purchase ICSolutions, the industry’s third largest company, after the Federal Communications Commission and the Department of Justice’s Antitrust Division signaled that they would likely block the deal. The merger would have effectively handed the market for prison and jail phone services over to Securus and its last major competitor, GTL.
“Based on a record of nearly 1 million documents comprised of 7.7 million pages of information submitted by the applicants, as well as arguments and evidence submitted by criminal justice advocates, consumer groups, and other commenters, FCC staff concluded that this deal posed significant competitive concerns and would not be in the public interest,” said FCC chairman Ajit Pai in a press release.
“Securus and ICS [Inmate Calling Solutions] have a history of competing aggressively to win state and local contracts by offering better financial terms, lower calling rates, and more innovative technology and services. This merger would have eliminated that competition, plain and simple,” said Makan Delrahim, Assistant Attorney General of the Department of Justice’s Antitrust Division in a press release. “The companies’ decision to abandon this deal is the right outcome – correctional facilities, inmates and their friends and families will continue to benefit from the robust competition between these firms.”
“All too often, calls home from jails cost an unconscionable $1/minute,” said Peter Wagner, Executive Director of the Prison Policy Initiative. “Had the companies merged, facilities would have had a harder time negotiating contracts with lower rates for families – which, thanks to our movement’s ongoing advocacy, they’re finally beginning to do.”
In our objection to the merger, filed in July 2018 with a coalition of groups working for prison phone justice represented by probono attorneys Davina Sashkin and Cheng-yi Liu, we argued that the FCC should stop the merger.
We argued that Securus’ history of repeatedly flouting commission rules – including deliberately misleading the FCC during a similar review last year, for which it was punished with an unprecedented $1.7 million fine – made it ineligible to purchase one of its competitors. We explained that the company has repeatedly tried to circumvent regulation in order to increase its profits from prison phone calls, and as recently as May 2018 was caught enabling illegal cell phone tracking.
Our filing included a detailed analysis of the concentration of the prison and jail telephone industry. We calculated market share in two different ways; by either measure, Securus and GTL were poised to control between 74% and 83% of the market. Except for ICSolutions – which Securus was seeking to acquire – no other company had above 3% market share.
For more information about this timeline, the companies, their respective sizes, the role of companies like CenturyLink that operate only in partnership with Securus and ICSolutions, or the historical role of AT&T and Verizon, see our report, the footnotes, and appendices to State of Phone Justice: Local jails, state prisons and private phone providers.
Updated April 3, 2019 10am with FCC press release and 1pm with the Department of Justice’s press release.
For the past few years, California policymakers have been at hard work to protect in-person jail visitation from sheriffs and private companies who are eager to replace crucial human contact with impersonal video chats. While legislators were successful in preventing jails who provided in-person visits in January 2017 from later eliminating them, jails that had already banned in-person visits are permitted to continue their video-only policies.
That could change this legislative cycle thanks to Assembly Member Medina’s AB 964. AB 964 would require that all California jails provide in-person visits. Specifically, jails that are currently exempted would need to restore in-person visits by 2025.
The Assembly Public Safety Committee will be voting on AB 964 on April 2. We submitted a comment, encouraging committee members “to recognize and support the positive role families play in rehabilitation” and, more importantly, that “human beings need in person visits.”
The Massachusetts Senate is once again considering construction of a new jail for women in Middlesex County. But I would caution against any expansion of correctional facilities without first reckoning with the inherent harms of jail incarceration and exploring better alternatives.
The proposal – Senate 1851 – would “establish a commission to identify a suitable location for a justice complex” in Middlesex County. I find it interesting that the commission is to identify a location, rather than consider whether a jail is needed at all. According to the text of the bill, this proposal is in line with a law passed in 2008 to expand jail capacity. But that law was passed in the wake of the state’s highest-ever rate of jail incarceration; since then, the state’s jail rate has seen a steady decline. This begs the question: why would the state need more capacity, when jail rates are down?
The Vera Institute of Justice’s Incarceration Trends tool shows that jail incarceration rates in Massachusetts have fallen over the past decade.
Despite the overall downward trend in the state’s jail rate, two groups have been jailed at steady or increasing rates: women and people being detained pretrial – and these are the two populations being used to justify the “need” for a new jail.
The Vera Institute of Justice’s Incarceration Trends tool shows that the female jail rate in Massachusetts has risen steadily since the early 1990s.
The pretrial population in Massachusetts jails has increased for decades, while the number of people serving sentences there has fallen dramatically since 1993.
But despite the growth in the female and pretrial jail populations, there are some important arguments against building a new jail to hold these groups.
First, jails are uniquely harmful to women, and their needs are better met by community-based programs and services. Women in jails have higher rates of mental health and substance use disorders, and often have a history of abuse or other trauma; incarceration more often exacerbates these problems than alleviates them (for more information, see the “Context” sidebar in our 2018 report). As of December 2018, the Massachusetts Department of Corrections (DOC) reported that “74% [of women held by the DOC] were open mental health cases, 15% had a serious mental illness (SMI), and 56% were on psychotropic medication” – all rates roughly double those of the male population. Women in jails (especially women of color) are also poorer, on average, than their male counterparts, and therefore often are detained pretrial because they can’t afford even low bail amounts. Furthermore, separation from children leads many women to accept plea deals just to get out of jail sooner, which in turn leaves them with criminal records that may not reflect actual guilt or innocence.
Second, pretrial detention leads to worse outcomes, from high risk of suicide to increased likelihood of conviction, longer sentences, and reoffending. Yet pretrial detention has driven all of the jail growth in the U.S. over the last 20 years, which means that jails – like the one being proposed – are being built because more people who have not been convicted and are legally presumed innocent are being locked up. This trend reflects an increasing reliance on money bail – essentially, wealth-based release decisions – rather than an increase in “dangerousness” or flight risk. According to DOC data, the female pretrial population held by the DOC has increased 18% since 2010. If Massachusetts wants to relieve jail overcrowding, it should start by minimizing the number of people held pretrial, especially those who are there because they can’t afford bail.
Another problem that should be addressed before expanding jail capacity is the racial disparity evident in the state’s female pretrial population. As of Jan. 1, 2018, nearly a third (32%) of the women held by the DOC (in Framingham) were being detained pretrial. However, this proportion varied by race and ethnicity. 44% of Hispanic women and 35% of Black women held by the DOC, versus 31% of “Other” and 29% of white women, were held pretrial.
The idea to build a new women’s jail is not a new one. For years, a handful of Massachusetts counties have sent women detained pretrial to the women’s prison, MCI-Framingham, because they didn’t have separate jail space for women in the county jails. And for years, MCI-Framingham was overcrowded for precisely that reason. In 2007, the state opened a new jail for women farther west, and sent women from counties without separate women’s facilities that were west of Worcester to the new jail to await trial or serve their sentences. The result? Women jailed there were farther from crucial contacts, including their families and children, and their lawyers – which in turn made it harder to prepare their defense. Now, lawmakers want to build again, this time near the existing Framingham facility in southern Middlesex County.
The legislators behind the new jail project undoubtedly see a new jail as an “upgrade” for the state’s incarcerated women, since it would alleviate crowding and would be more updated housing than the nearly 150-year-old prison. But the real solution for women in jails would be to return to their communities. They would be better served awaiting trial at home, participating in diversion programs, and getting needed treatment and support for underlying problems through community-based programs. If legislators care about improving conditions for justice-involved women, they should focus on investing in community services and alternatives to incarceration that interrupt women’s distinct pathways to prison – not just building them newer, bigger, jails.
How has mass incarceration impacted the city you live in? This question frequently drives our readers to ask about the incarceration rates of specific cities. Because of the decentralized nature of criminal justice data, drilling down to the city level is difficult-to-impossible, but now you can calculate the prison (but not jail) incarceration rate of a city’s surrounding county using the Vera Institute’s Incarceration Trends Database. Using that tool, we calculated the imprisonment rates of the most populous counties in 39 states (all those where data were available) – and uncovered a few surprises.
Rates are per every 100,000 residents. In its Incarceration Trends tool, the Vera Institute presents rates for counties per every 100,000 residents aged 15-64; we calculated the rates using the total populations in their downloadable dataset to make them comparable with the Bureau of Justice Statistics’ total state incarceration rates. (BJS state incarceration rates are for the jurisdictional population sentenced to greater than 1 year.)
State
Most Populous County
Associated City
County Residents in State Prisons: Rate per 100,000 residents
Total State Prison Incarceration: Rate per 100,000 residents
Okla.
Oklahoma County
Oklahoma City
937
703
Pa.
Philadelphia County
Philadelphia
897
387
Wis.
Milwaukee County
Milwaukee
812
372
Mich.
Wayne County
Detroit
737
430
Ariz.
Maricopa County
Phoenix
666
600
Ala.
Jefferson County
Birmingham
627
613
Ohio
Cuyahoga County
Cleveland
627
444
Ind.
Marion County
Indianapolis
596
413
Texas
Harris County
Houston
574
572
Tenn.
Shelby County
Memphis
564
427
Colo.
Denver County
Denver
551
367
Iowa
Polk County
Des Moines
526
282
Ga.
Fulton County
Atlanta
508
506
Miss.
Hinds County
Jackson
502
609
Ill.
Cook County
Chicago
464
378
Ky.
Jefferson County
Louisville
453
490
Nev.
Clark County
Las Vegas
451
448
S.D.
Minnehaha County
Sioux Falls
443
423
Calif.
Los Angeles County
Los Angeles
427
330
S.C.
Greenville County
Greenville
416
416
Ore.
Multnomah County
Portland
401
379
Wyo.
Laramie County
Cheyenne
336
408
Neb.
Douglas County
Omaha
336
280
W. Va.
Kanawha County
Charleston
335
372
Hawaii
Honolulu County
Honolulu
326
263
Mo.
St. Louis County
St. Louis
304
531
Fla.
Miami-Dade County
Miami
301
500
N.C.
Mecklenburg County
Charlotte
273
354
N.Y.
New York County
New York City
262
261
Minn.
Hennepin County
Minneapolis
211
197
Utah
Salt Lake County
Salt Lake City
207
217
N.H.
Hillsborough County
Manchester and Nashua
186
218
Wash.
King County
Seattle
167
256
N.D.
Cass County
Fargo
157
236
Maine
Cumberland County
Portland
139
132
Va.
Fairfax County
Washington DC suburbs
118
448
Md.
Montgomery County
Washington DC suburbs
117
354
N.J.
Bergen County
Hackensack
92
229
Mass.
Middlesex County
Boston
81
132
With many large cities currently making criminal justice reform a priority – and with the highest rates of incarceration now in small cities and towns – you might expect large cities to be less punitive than the states they belong to. But 14 counties I evaluated (such as Philadelphia County and Los Angeles County) still have disproportionately high prison incarceration rates compared to the rest of their states. And only 13 of the counties I evaluated had incarceration rates significantly (that is, more than 10%) lower than the states they belong to.
You might also wonder: How does my city compare to other cities on incarceration? For the most part, cities in famously punitive states tend to be punitive compared to other cities. But there are some notable exceptions. For instance, while Missouri and Florida have some of the highest state rates of incarceration, St. Louis County and Miami-Dade County not only have lower rates than their states do; they have lower rates than most other urban areas nationwide.
Likewise, a few states that have relatively low incarceration rates should note that their major cities tell a wildly different story. Colorado, Michigan and Iowa have lower incarceration rates than many states, but the counties containing their major cities – Denver, Detroit and Des Moines, respectively – have some of the highest incarceration rates of all the urban areas I evaluated. These counties send disproportionately high numbers of people to prison.
So why do most of these counties differ significantly from the states they’re located in when it comes to incarceration? Clearly, local incarceration rates are impacted by much more than sentencing laws and other factors determined at the state level.
To state the obvious, cities and towns vary widely in their levels of poverty and in the quality of their social services (such as education, drug treatment and health care), both of which impact crime. But other factors matter too. Police departments and prosecutors differ in how aggressively they target crime, especially low-level crime. Cities and towns that invest in diversion programs for veterans, people with mental illness, and people with a substance use disorder may send fewer people to prison than areas without the same community services. The same is true for states with well-funded public defenders’ offices. And the availability of reentry services (like affordable housing), as well as the punitiveness of the community, affects the likelihood that a city’s formerly incarcerated people will be sent back to prison.
Given the wide variation among cities and towns, it’s clear that incarceration rates are just the beginning of any local analysis. If you’re curious to learn more about your city or state, check out Vera’s database, our extensive Research Library, and our state profiles.
 In the past two decades, the total number of arrests in the U.S. has dropped by more than 30 percent, from
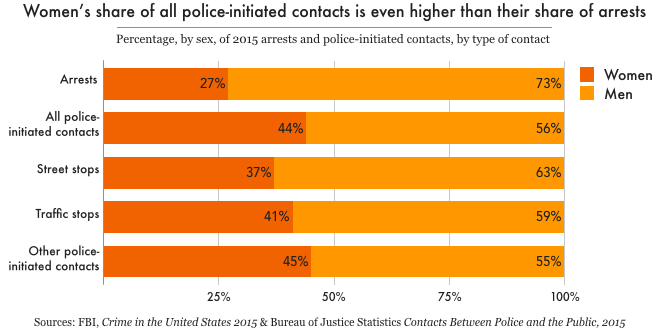
 As with women’s share of arrests, women’s share of police encounters that involve the use or threat of force has increased significantly since 1999.
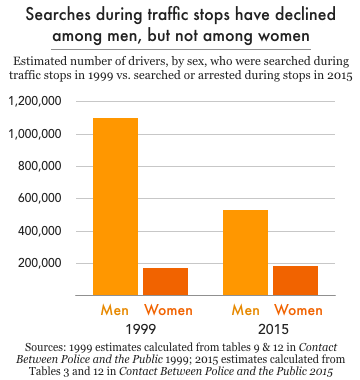 Women also make up a larger percentage of all people searched during traffic stops. In 1999, men who were stopped while driving were about four times as likely to be searched during the stop than women; by 2015, men were just twice as likely to be searched. The narrowing of this gap reflects a decline in searches of men; for women, the share of stops that resulted in search remained the same, at 2.3 percent. In 1999, police searched the driver or vehicle in 9.4 percent of stops of men, which amounts to over one million stops involving a search. In 2015, however, the percentage of stops involving male drivers that resulted in search or arrest dropped by half, to 4.7 percent – or over 500,000 stops. Female drivers, however, saw no change in their likelihood of search or arrest during a traffic stop.
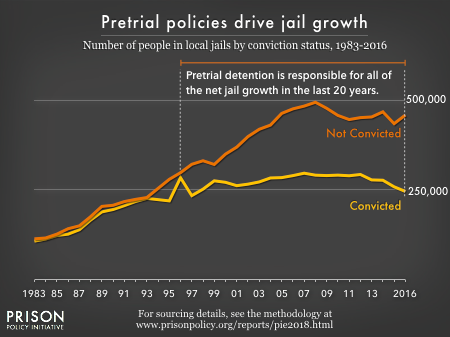
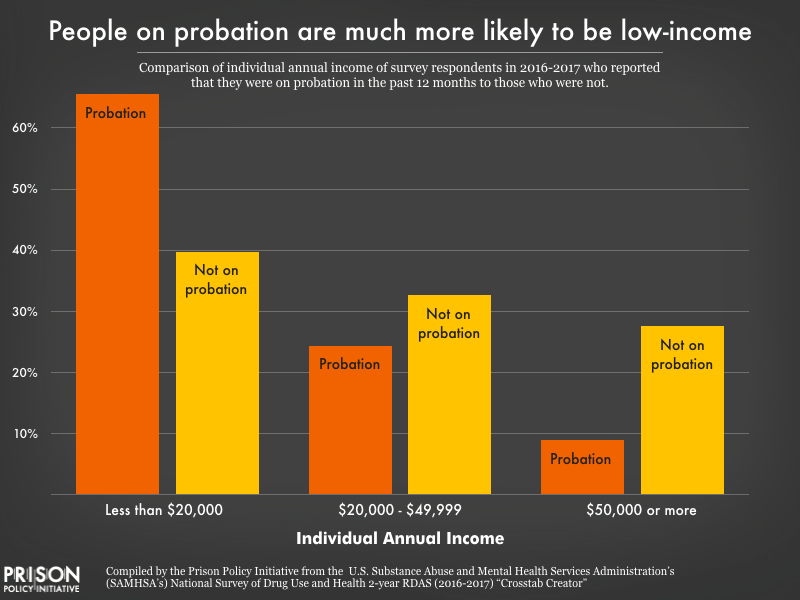 People on probation are much more likely to be low-income than those who aren’t on probation, and steep monthly probation fees often put them at risk of being jailed when they can’t pay. For a more detailed comparison, see the
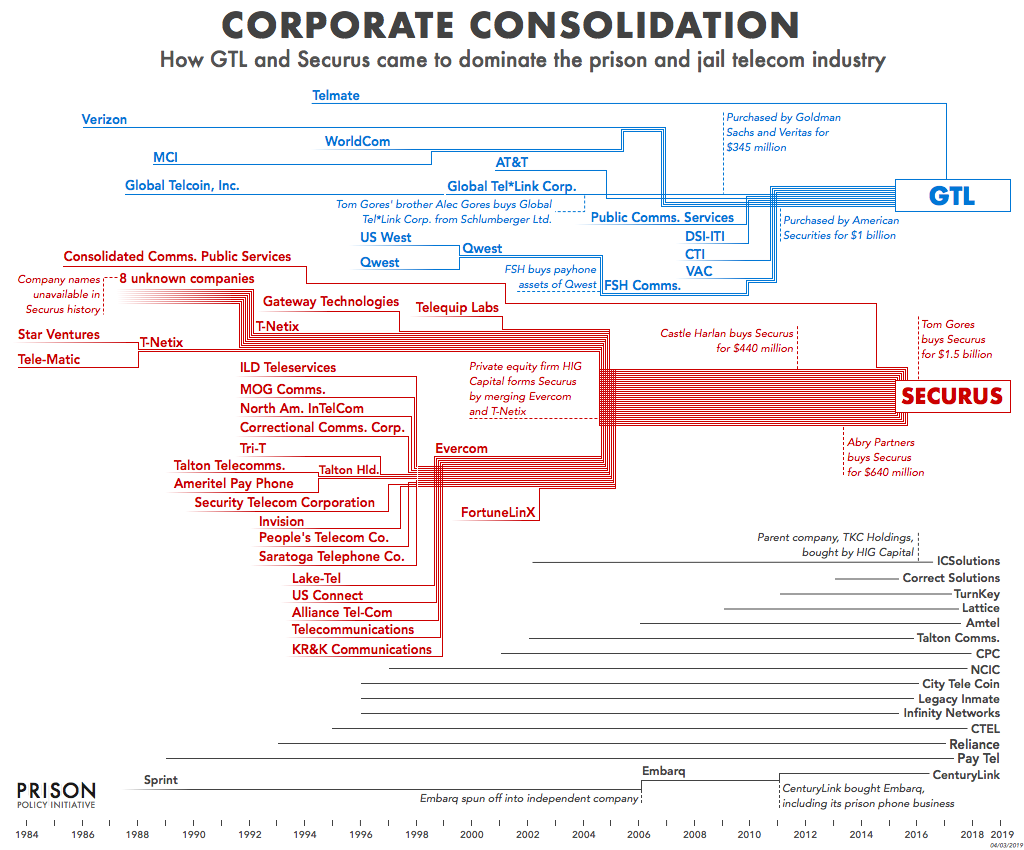
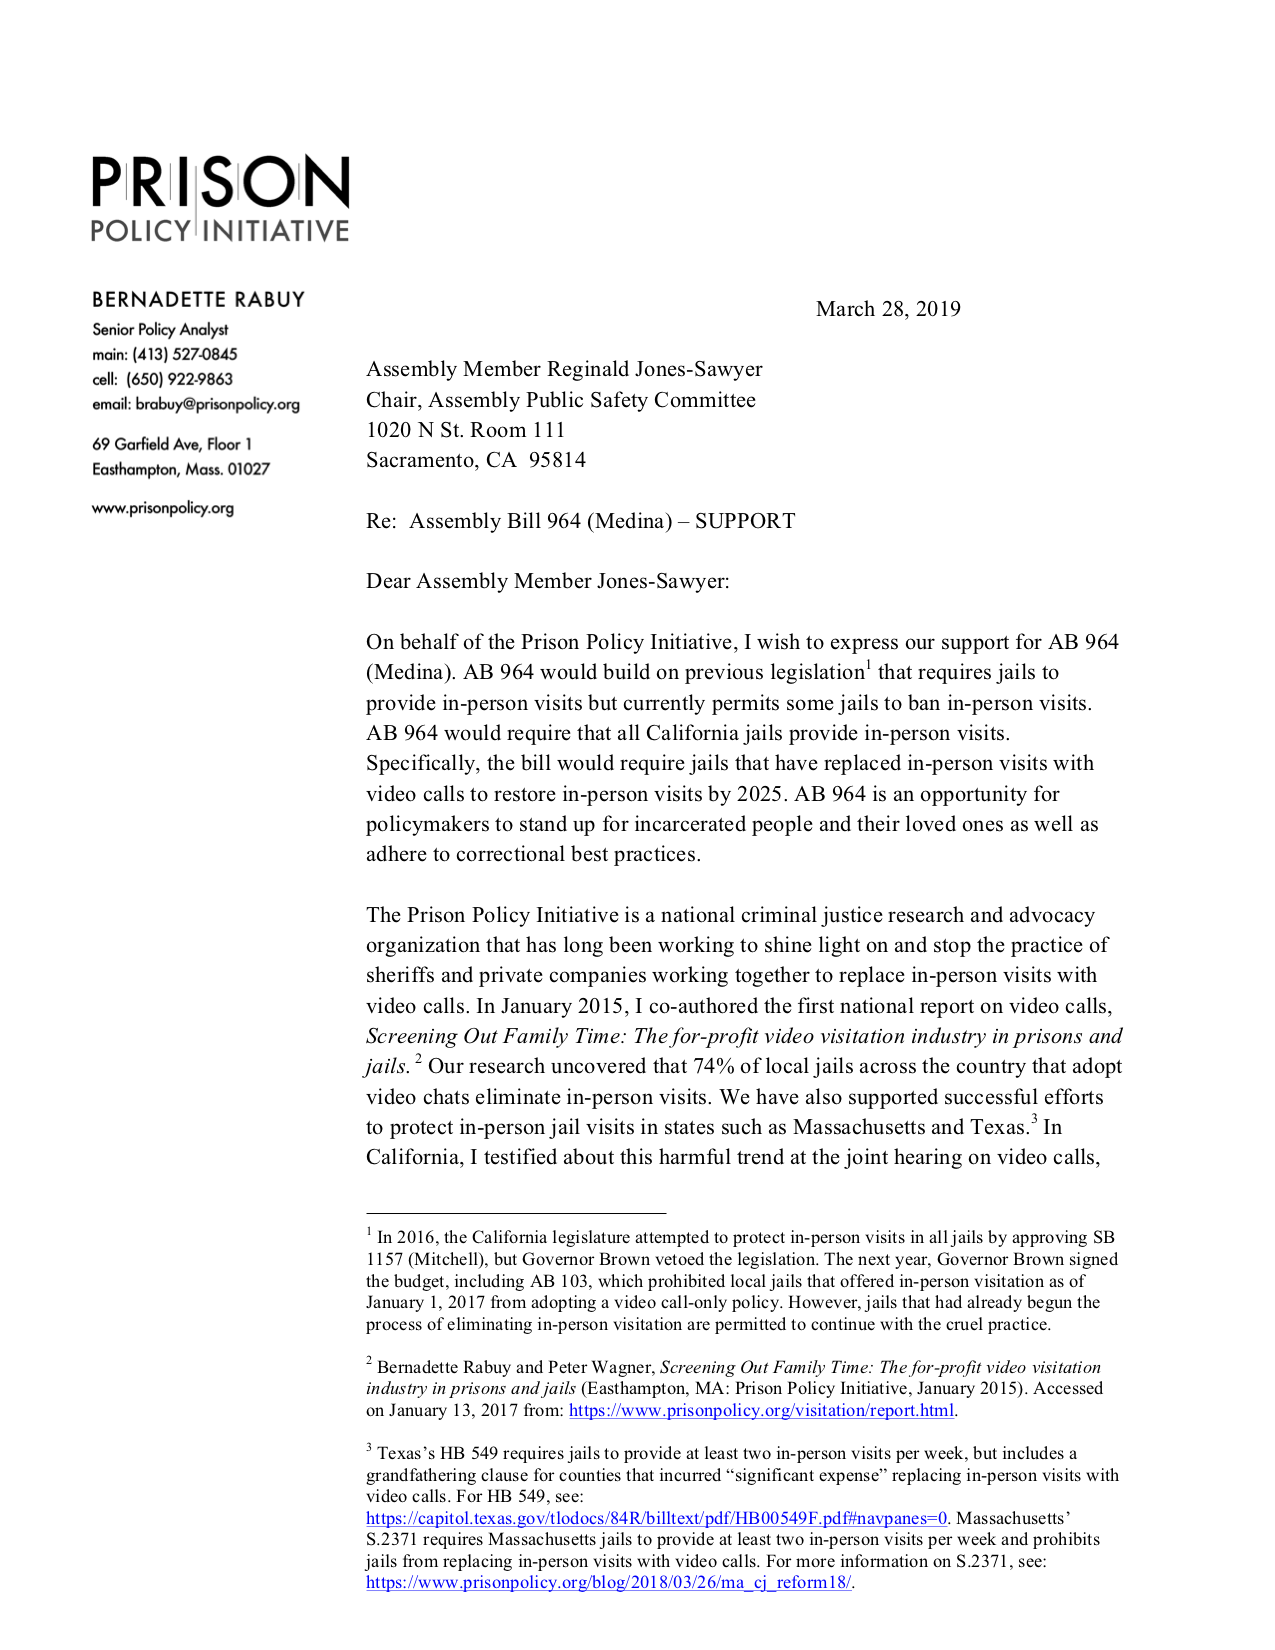
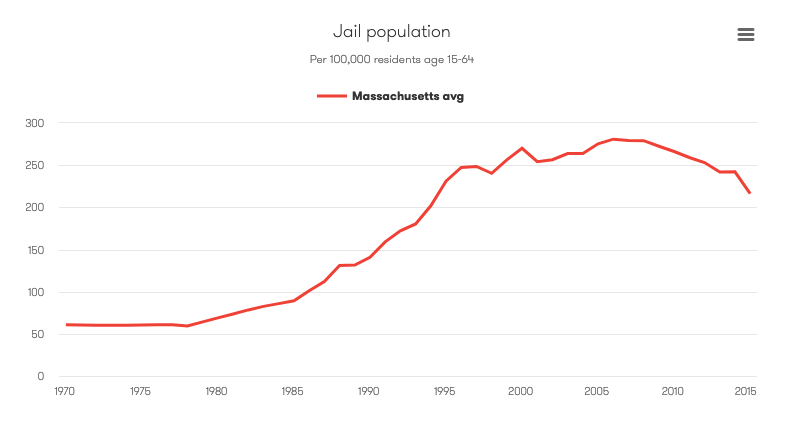 The Vera Institute of Justice’s
 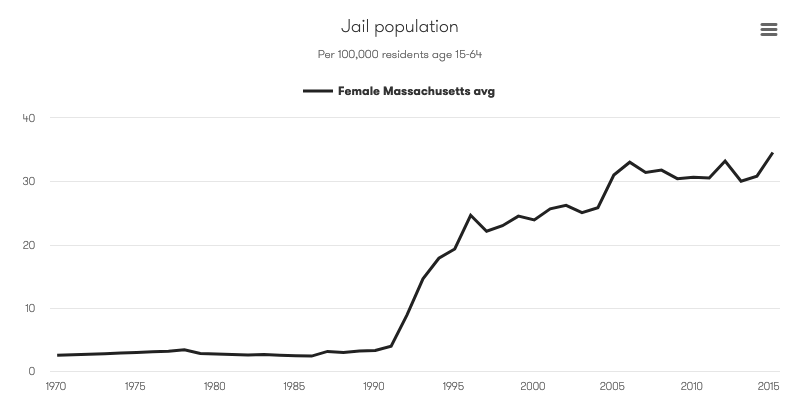 The Vera Institute of Justice’s
 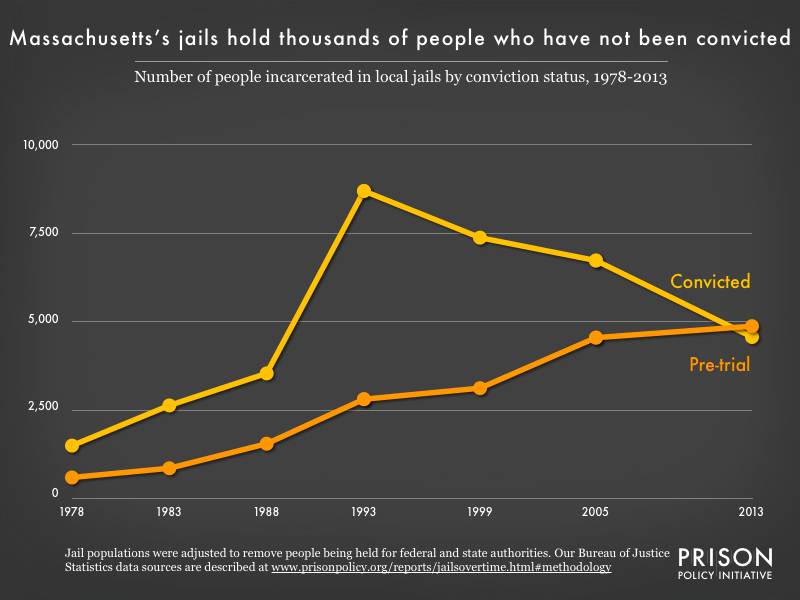 The pretrial population in Massachusetts jails has increased for decades, while the number of people serving sentences there has fallen dramatically since 1993.


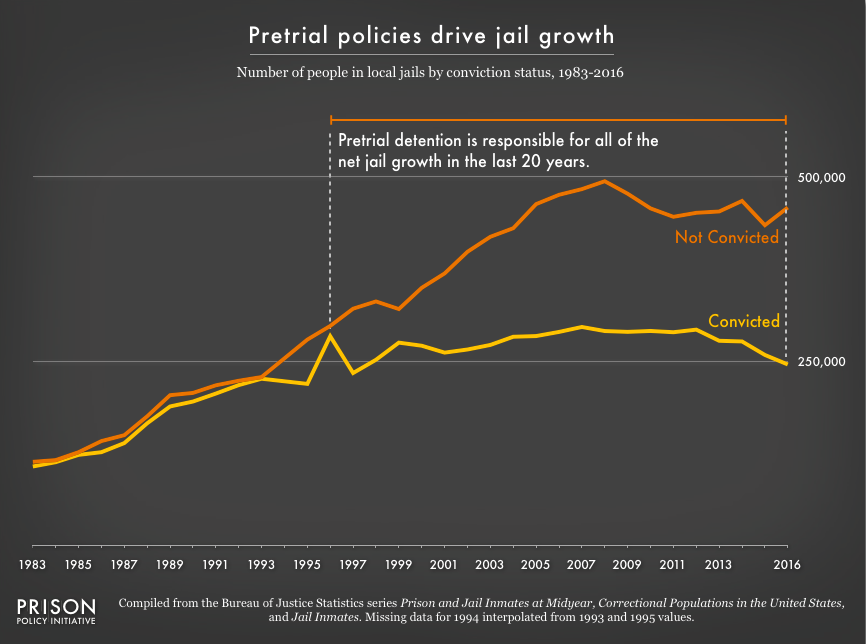