State prisons and local jails appear indifferent to COVID outbreaks, refuse to depopulate dangerous facilities
While some prison systems and local jails have maintained historically low populations, others have returned to pre-pandemic levels, despite the ongoing dangers of COVID-19 and new, more transmissible variants.
by Emily Widra, February 10, 2022
The COVID-19 pandemic is far from over, particularly inside prisons and jails. The death rate from COVID-19 in prisons is more than double that of the general U.S. population.1 As cases and hospitalizations climb outside prison walls, there is no doubt that cases are spiking in jails and prisons across the country. In state and federal prisons, over 2,900 people have died of COVID-19, almost 476,000 people have been infected, and thousands of additional cases are linked to individual county jails. Even now, when more than 75% of people in the U.S. have received at least one dose of the vaccine, correctional staff are hesitant to get vaccinated or receive boosters, and prison systems are slow to roll out boosters to incarcerated people.2 As the more contagious Omicron variant ravages parts of the nation and renders hospitals completely overrun, nearly three quarters of prisons3 are experiencing COVID-19 outbreaks; public health officials continue to recommend reducing prison populations as a primary method of risk reduction. In fact, in October 2021, the American Public Health Association4 adopted a policy in support of decarceration as a public health matter and new research shows the detrimental effect of COVID-19 on all-cause mortality in state prisons. Despite the clear need for smaller confined populations, the data show that with just a few exceptions, state and local authorities are allowing their prison and jail populations to return to dangerous, pre-pandemic levels.
The federal Bureau of Prisons, state governments and departments of corrections, and local justice system officials have a responsibility to protect the health and lives of those who are incarcerated. After almost two years of outbreak after outbreak in prisons and jails, correctional authorities must be held accountable for their repeated failure to reduce populations enough to prevent the illness and death of those who are incarcerated and in surrounding communities.
Prisons
Even in states where prison populations have dropped, there are still too many people behind bars to accommodate social distancing, effective isolation and quarantine, and the increased health care needs of incarcerated people. For example, although California has reduced the state prison population by about 18% since the start of the pandemic, it has not been enough to prevent large COVID-19 outbreaks in the state’s prisons, and the prison system has witnessed a 300% increase in infections among incarcerated people over the past few weeks and a 212% increase in cases among staff. In fact, as of December 15th, 2021, California’s prisons were still holding more people than they were designed for, at 113% of their design capacity (and up from 103% in January 2021). Considering the continued overcrowding in the California prison system, it’s not surprising that the state is responsible for eight out of the ten largest COVID-19 prison clusters.
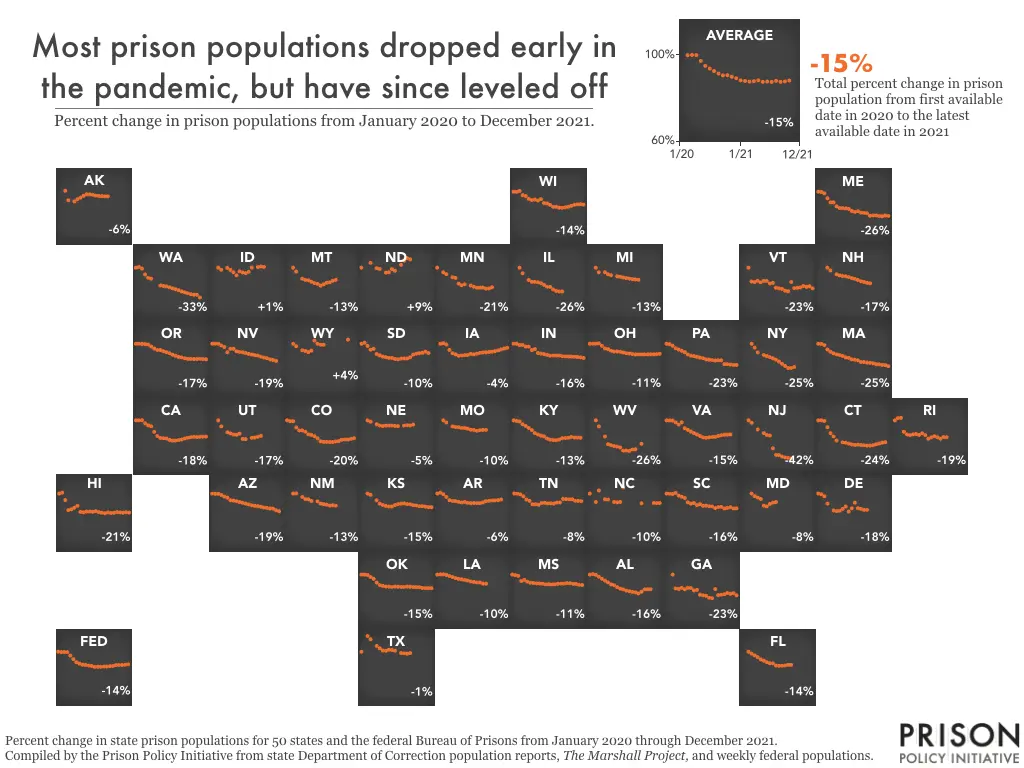
Many states’ prison populations are the lowest they’ve been in decades, but this is not because more people are being released from prisons; in fact, fewer people are. Data from 2020, recently released by the Bureau of Justice Statistics, shows that prisons nationwide released 10% fewer people in 2020 than in 2019. Instead, data suggest most of the population drops we’ve seen over the past 20 months are due to reduced prison admissions, not increasing releases. In the states for which we have recent data, both admissions and releases have decreased in recent years, making clear that prisons are not using all available tools at their disposal to stop the spread of the virus in their facilities. The significant drop in admissions to prisons was largely an unintended consequence of court delays and suspension of transfers from local jails early in the pandemic, rather than any dedicated decarceration efforts. Finding ways to continue reducing the number of people admitted to correctional facilities is critical to lowering the number of people behind bars, but to quickly decarcerate, states should release far more people, too.

Despite evidence that large-scale releases — which have been used periodically in states across the U.S. — do not inherently endanger public safety, most states have elected to release people from prison on a mostly case-by-case basis, which an October 2020 report from the National Academies of Sciences, Engineering, and Medicine charitably described as “procedurally slow and not well suited to crisis situations.” In short, this choice ignores the crisis of COVID-19.
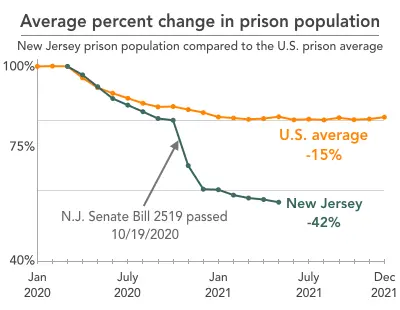
Thankfully, some states have recognized the inefficiency of case-by-case releases and the necessity of larger-scale releases. For example, in New Jersey, Governor Phil Murphy signed bill S2519 in October 2020, which allowed for the early release of people with less than a year left on their sentences. A few weeks after the bill was signed, more than 2,000 people were released from New Jersey state prisons on November 4th, 2020.5 In February 2021, North Carolina Governor Roy Cooper announced a legal settlement had been reached to release 3,500 people in state custody (with 1,500 of those releases to take place within 90 days). The releases were the result of a NAACP lawsuit challenging prison conditions in North Carolina during COVID-19. The state said it would release people using discretionary sentence credits (similar to “good time credits”), home confinement, and post-release supervision. But these instances of larger-scale release efforts taking place in state prison systems are the exception, not the rule.
Jails
Jail populations, like prison populations, are lower now than they were pre-pandemic. Initially, many local officials — including sheriffs, prosecutors, and judges — responded quickly to COVID-19 and reduced their jail populations. In a national sample of 415 county jails of varying sizes, almost all (98%) decreased their populations from March to May of 2020, resulting in an average change of a 33% population decrease across all 415 jails at the start of COVID-19. These population reductions came as the result of various policy changes, including police issuing citations in lieu of arrests, prosecutors declining to charge people for “low-level offenses,” courts reducing cash bail amounts, and jail administrators releasing people detained pretrial or those serving short sentences for “nonviolent” offenses.
But those early-pandemic, common-sense policy changes didn’t last long. Between May 2020 and February 2021, the populations of 83% of the jails in our sample increased, reversing course from the earlier months of the pandemic. As of December 2021, 28% of the jails in our sample have higher populations now than they did in March 2020.6 Overall, the average population change across these 415 jails from March 2020 to December 2021 has diminished to only a 10% decrease, while the average population change from July 2021 to December 2021 has dropped to 0%, suggesting that the early reforms instituted to mitigate COVID-19 have largely been abandoned.
For example, by mid-April 2020, the Philadelphia city jail population reportedly dropped by more than 17% after city police suspended low-level arrests and judges released “certain nonviolent detainees” jailed for “low-level charges.” But just two weeks later — as the pandemic raged on — the Philadelphia police force announced that they would resume arrests for property crimes, effectively reversing the earlier reduction efforts. Similarly, on July 10th, 2020, the sheriff of Jefferson County (Birmingham), Alabama, announced that the jail would limit admissions to only “violent felons that cannot make bond.” That effort was quickly abandoned when the jail resumed normal admission operations just one week later. The increasing jail populations across the country suggest that after the first wave of responses to COVID-19, many local officials have allowed jail admissions to return to business as usual.

In New York City, the jail population sharply declined after the pandemic was declared. Importantly, NYC jails – particularly Rikers Island – were some of the first jails in the country to witness a COVID-19 outbreak. And yet, across different demographics, NYC jail populations have slowly leveled out, suggesting that the policies responsible for the necessary decarceration are no longer in practice. In addition to suffering the effects of COVID-19, Rikers Island is also facing an unprecedented crisis following a history of over-incarceration and, according to a federal monitor, “decades of mismanagement.” At a time when jail populations should be at an all-time low, Rikers Island’s confined population surpassed the pre-COVID-19 population in July 2021. The population only dropped back down below the pre-pandemic level at the end of September 2021, when Gov. Hochul signed the Less is More Act, which reduced the number jailed for technical violations of supervision.

(Dotted lines connect periods with missing data, so the start of each dotted line and their bends represent specific historical data points.)
Even before COVID-19, prisons and jails were a threat to public health and considered notoriously dangerous places during any sort of viral outbreak. As the U.S. Supreme Court recognized years before the pandemic, by taking away a person’s ability to care for their own medical needs, carceral facilities must make sure that those who are incarcerated receive proper medical care–failure to do so can constitute a violation of of the Eighth Amendment’s guarantee against cruel and unusual punishment and necessitate a reduction in the carceral population. And yet, correctional facilities continue to be the source of a large number of infections in the U.S. The COVID-19 death rate in prisons is almost three times higher than among the general U.S. population, even when adjusted for age and sex (as the prison population is disproportionately young and male). Since the early days of the pandemic, public health professionals, corrections officials, and criminal justice reform advocates have agreed that decarceration is necessary to protect incarcerated people and the community at large from COVID-19. Decarceration efforts must include releasing more people from prisons and jails. Despite this knowledge, state, federal, and local authorities have failed to release people from prisons and jails on a scale sufficient to protect incarcerated people’s lives – and by extension, the lives of everyone in the communities where incarcerated people eventually return, and where correctional staff live and work.
Footnotes
-
The COVID-19 death rate in prisons at the end of April 2021 stood at a staggering 200 deaths per 100,000 incarcerated people, much higher than the death rate among the general U.S. population of 81 deaths per 100,000 residents. These rates, calculated by the UCLA COVID-19 Behind Bars Data Project, were adjusted to account for differences in age and sex between the prison population and the general U.S. population. For more details about how these rates were calculated, see “COVID-19 Incidence and Mortality in Federal and State Prisons Compared With the US Population, April 5, 2020, to April 3, 2021” published in the Journal of the American Medical Association. ↩
-
Among correctional staff exempt from vaccination mandates, adherence to other protective measures is also inadequate. In California, the twice-weekly testing requirement applies to about 10,000 unvaccinated correctional staff, but “nearly a third of [those employees] weren’t complying [with testing] from mid-October through mid-November, according to the most recent data provided by corrections officials.” ↩
-
A recent report from the UCLA COVID-19 Behind Bars Data Project reveals that among the 984 prisons publishing COVID-19 data, 72% reported a COVID-19 outbreak in January 2022. ↩
-
The American Public Health Association (APHA) stance includes recommendations for “moving toward the abolition of carceral systems and building in their stead just and equitable structures that advance the public’s health by (1) urgently reducing the incarcerated population; (2) divesting from carceral systems and investing in the societal determinants of health (e.g., housing, employment); (3) committing to noncarceral measures for accountability, safety, and well-being; (4) restoring voting rights to formerly and currently incarcerated people; and (5) funding research to evaluate policy determinants of exposure to the carceral system and proposed alternatives.” ↩
-
Unfortunately, this major victory for public health was immediately undercut by the federal Immigration and Custom Enforcement (ICE) agency which quickly arrested 88 people who were released under bill S2519. A spokesperson from ICE claimed that these 88 individuals were “violent offenders or have convictions for serious crimes such as homicide, aggravated assault, drug trafficking and child sexual exploitation.” However, these claims are brought into question when considering that the releases that took place under bill S2519 specifically excluded “people serving time for murder or sexual assault” and those serving time for sexual offenses. Although we did not include ICE facilities in our analysis, there is evidence that ICE detention facilities have a COVID-19 case rate that is up to 13 times higher than that of the general U.S. population. ↩
-
118 jails (28% of our sample) have higher populations now than they had before COVID-19. Some of those jails include large county jails with more than 500 people, including Wayne County, Mich., Lubbock and Galveston Counties, Tex., St. Lucie County, Fla., Prince George’s County, Md., and Bergen County, N.J. ↩
Appendix A: State and federal prison populations during COVID‑19
Prison populations for the federal Bureau of Prisons and all 50 state prison systems from January 2020 through December 2021. When available, we used prison populations as reported by Departments of Correction to The Marshall Project. If that data point was not available, we then used either the monthly average daily population (ADP) or point-in-time population counts. For the federal system, we used the first weekly population each week as reported by the Bureau of Prisons.
| Prison system | January 2020 | February 2020 | March 2020 | April 2020 | May 2020 | June 2020 | July 2020 | August 2020 | September 2020 | October 2020 | November 2020 | December 2020 | January 2021 | February 2021 | March 2021 | April 2021 | May 2021 | June 2021 | July 2021 | August 2021 | September 2021 | October 2021 | November 2021 | December 2021 | Sources |
|---|---|---|---|---|---|---|---|---|---|---|---|---|---|---|---|---|---|---|---|---|---|---|---|---|---|
| Alabama | 21,154 | 21,272 | 21,114 | 20,655 | 20,170 | 19,752 | 19,342 | 18,901 | 18,693 | 18,262 | 17,914 | 17,725 | 17,454 | 17,308 | 17,134 | 17,051 | 16,792 | 17,189 | 17,724 | 17,765 | 17,769 | The Marshall Project & DOC Monthly Reports |
|||
| Alaska | 4,776 | 4,277 | 4,216 | 4,334 | 4,414 | 4,511 | 4,586 | 4,581 | 4,559 | 4,523 | 4,505 | 4,493 | 4,478 | 4,487 | The Marshall Project | ||||||||||
| Arizona | 42,422 | 42,282 | 42,360 | 41,777 | 41,005 | 40,529 | 39,339 | 39,153 | 38,894 | 38,495 | 38,141 | 37,731 | 37,396 | 36,975 | 36,704 | 36,569 | 36,266 | 35,954 | 35,746 | 35,489 | 35,410 | 34,643 | 34,202 | 33,855 | The Marshall Project & DOC monthly capacity reports |
| Arkansas | 17,989 | 18,181 | 17,860 | 17,331 | 16,694 | 16,552 | 16,511 | 16,367 | 16,215 | 16,311 | 16,165 | 16,094 | 16,119 | 16,120 | 16,085 | 16,250 | 16,476 | 16,560 | 16,638 | 16,655 | 16,698 | 16,821 | DOC monthly director’s board reports | ||
| California | 117,454 | 117,432 | 117,639 | 113,632 | 111,072 | 109,800 | 102,715 | 97,342 | 94,852 | 94,433 | 94,179 | 92,350 | 91,341 | 91,516 | 92,079 | 92,836 | 94,103 | 95,107 | 95,809 | 96,194 | 95,950 | 96,253 | 96,556 | 96,478 | The Marshall Project & CDCR weekly population reports |
| Colorado | 17,751 | 17,600 | 17,585 | 16,382 | 15,797 | 15,807 | 15,531 | 15,022 | 14,935 | 14,673 | 14,257 | 13,687 | 13,558 | 13,556 | 13,553 | 13,537 | 13,650 | 13,730 | 13,968 | 14,042 | 14,009 | 14,149 | 14,271 | 14,322 | The Marshall Project & DOC end-of-month population reports |
| Connecticut | 12,381 | 12,386 | 12,290 | 11,454 | 10,640 | 10,206 | 9,645 | 9,391 | 9,348 | 9,233 | 9,111 | 9,053 | 9,100 | 9,039 | 9,011 | 8,947 | 8,965 | 9,009 | 9,143 | 9,253 | 9,357 | 9,426 | 9,518 | The Marshall Project & DOC monthly reports |
|
| Delaware | 5,194 | 5,156 | 5,042 | 4,624 | 4,233 | 4,195 | 4,216 | 4,322 | 4,457 | 4,168 | 4,358 | 4,677 | 4,360 | 4,326 | 4,269 | 4,267 | The Marshall Project | ||||||||
| Federal | 164,284 | 163,635 | 163,886 | 163,498 | 157,340 | 151,066 | 145,399 | 143,071 | 140,970 | 140,540 | 139,446 | 138,776 | 137,084 | 137,361 | 137,260 | 137,686 | 137,633 | 138,394 | 138,773 | 140,295 | 140,627 | 140,518 | 140,803 | 141,598 | BOP weekly population report |
| Florida | 93,764 | 91,828 | 88,305 | 85,839 | 84,601 | 82,997 | 82,027 | 81,795 | 79,523 | 79,322 | 79,476 | 79,660 | 80,298 | 80,271 | The Marshall Project | ||||||||||
| Georgia | 55,218 | 55,221 | 55,025 | 55,019 | 53,642 | 51,219 | 51,213 | 50,446 | 49,848 | 49,365 | 48,433 | 48,132 | 47,703 | 47,027 | 46,530 | 46,309 | 46,195 | 46,296 | 47,364 | 47,515 | 47,409 | 47,736 | 47,658 | 47,815 | The Marshall Project & DOC weekly reports |
| Hawaii | 5,208 | 5,258 | 4,836 | 4,260 | 4,311 | 4,404 | 4,508 | 4,162 | 4,140 | 4,184 | 4,183 | 4,171 | 4,200 | 4,153 | 4,117 | 4,084 | 4,134 | 4,104 | 4,113 | 4,149 | 4,134 | 4,114 | 4,145 | 4,126 | The Marshall Project & DPS monthly reports |
| Idaho | 7,816 | 7,641 | 7,798 | 7,626 | 7,426 | 7,155 | 7,496 | 7,407 | 7,343 | 7,461 | 7,827 | 7,867 | 7,921 | 7,878 | The Marshall Project | ||||||||||
| Illinois | 36,931 | 34,668 | 31,945 | 31,195 | 31,236 | 31,002 | 30,651 | 30,001 | 29,225 | 29,151 | 28,160 | 27,503 | 27,313 | 27,313 | The Marshall Project | ||||||||||
| Indiana | 27,268 | 27,298 | 26,891 | 26,936 | 26,418 | 26,409 | 25,385 | 25,691 | 24,513 | 24,350 | 24,203 | 23,978 | 23,726 | 23,745 | 23,745 | 23,769 | 23,554 | 23,510 | 23,464 | 23,435 | 23,388 | 23,332 | 23,229 | 23,035 | The Marshall Project & DOC monthly reports |
| Iowa | 8,474 | 8,533 | 8,401 | 7,902 | 7,600 | 7,493 | 7,362 | 7,395 | 7,415 | 7,441 | 7,542 | 7,489 | 7,554 | 7,627 | 7,673 | 7,680 | 7,717 | 7,741 | 7,790 | 7,852 | 7,951 | 8,042 | 8,106 | The Marshall Project & DOC daily statistics |
|
| Kansas | 9,804 | 9,673 | 9,091 | 8,735 | 8,580 | 8,486 | 8,414 | 8,408 | 8,574 | 8,665 | 8,719 | 8,745 | 8,682 | 8,650 | 8,556 | 8,530 | 8,445 | 8,457 | 8,400 | 8,345 | 8,351 | The Marshall Project & DOC end-of-month reports |
|||
| Kentucky | 12,306 | 12,225 | 12,162 | 11,782 | 11,549 | 11,272 | 11,002 | 10,589 | 10,391 | 10,242 | 10,151 | 9,854 | 9,706 | 9,655 | 9,625 | 9,708 | 9,899 | 9,930 | 9,967 | 10,084 | 9,990 | 9,986 | 9,955 | 9,835 | The Marshall Project & DOC daily count sheets |
| Louisiana | 15,019 | 15,067 | 15,066 | 14,967 | 14,775 | 14,623 | 14,443 | 14,313 | 14,241 | 14,134 | 14,052 | 13,903 | 13,822 | 13,722 | 13,724 | 13,546 | 13,522 | The Marshall Project & DOC population trends report |
|||||||
| Maine | 2,176 | 2,170 | 2,138 | 2,019 | 1,922 | 1,922 | 1,828 | 1,788 | 1,783 | 1,779 | 1,766 | 1,718 | 1,695 | 1,712 | 1,679 | 1,672 | 1,661 | 1,603 | 1,614 | 1,609 | 1,597 | 1,592 | 1,610 | 1,599 | The Marshall Project & DOC monthly reports |
| Maryland | 20,314 | 19,731 | 19,109 | 17,635 | 17,455 | 18,003 | 18,280 | 18,426 | The Marshall Project | ||||||||||||||||
| Massachusetts | 7,958 | 7,950 | 7,841 | 7,466 | 7,260 | 7,125 | 7,033 | 6,973 | 6,891 | 6,778 | 6,729 | 6,609 | 6,570 | 6,524 | 6,374 | 6,363 | 6,318 | 6,303 | 6,268 | 6,180 | 6,165 | 6,117 | 6,098 | 6,002 | The Marshall Project & DOC weekly counts |
| Michigan | 37,687 | 35,798 | 35,798 | 34,973 | 34,561 | 34,134 | 33,917 | 33,617 | 33,370 | 33,185 | 32,962 | 32,822 | 32,698 | The Marshall Project | |||||||||||
| Minnesota | 9,381 | 8,904 | 8,718 | 8,402 | 8,330 | 7,736 | 7,576 | 7,674 | 7,549 | 7,427 | 7,315 | 7,327 | 7,342 | 7,228 | 7,251 | 7,369 | 7,511 | The Marshall Project & DOC population summary reports |
|||||||
| Mississippi | 19,147 | 19,031 | 18,886 | 17,794 | 18,045 | 17,651 | 17,448 | 17,390 | 17,303 | 17,274 | 17,224 | 17,118 | 17,137 | 17,070 | 17,099 | 17,225 | 17,267 | 17,264 | 17,380 | 17,316 | 17,209 | 17,187 | 17,011 | 16,953 | The Marshall Project & DOC daily population reports |
| Missouri | 25,740 | 25,133 | 24,000 | 23,877 | 23,777 | 23,602 | 23,554 | 23,397 | 23,106 | 23,037 | 22,783 | 22,939 | 23,044 | 23,057 | The Marshall Project | ||||||||||
| Montana | 4,508 | 4,318 | 3,962 | 3,907 | 3,886 | 3,812 | 3,746 | 3,709 | 3,620 | 3,686 | 3,762 | 3,782 | 3,858 | 3,908 | The Marshall Project | ||||||||||
| Nebraska | 5,621 | 5,539 | 5,384 | 5,307 | 5,272 | 5,297 | 5,296 | 5,308 | 5,275 | 5,265 | 5,302 | 5,320 | 5,301 | 5,363 | The Marshall Project | ||||||||||
| Nevada | 12,379 | 12,403 | 12,384 | 12,152 | 11,937 | 11,231 | 11,696 | 11,696 | 11,354 | 11,273 | 11,222 | 11,134 | 11,007 | 10,926 | 10,841 | 10,777 | 10,640 | 10,505 | 10,429 | 10,260 | 10,183 | 10,059 | 10,015 | The Marshall Project & DOC weekly fact sheets |
|
| New Hampshire | 2,433 | 2,359 | 2,256 | 2,228 | 2,209 | 2,203 | 2,184 | 2,155 | 2,136 | 2,107 | 2,071 | 2,053 | 2,030 | 2,016 | The Marshall Project | ||||||||||
| New Jersey | 18,439 | 17,958 | 16,613 | 15,866 | 15,480 | 15,380 | 12,800 | 11,463 | 11,434 | 11,128 | 10,962 | 10,875 | 10,722 | The Marshall Project | |||||||||||
| New Mexico | 6,573 | 6,588 | 6,328 | 6,175 | 6,159 | 6,040 | 6,012 | 5,847 | 5,817 | 5,772 | 5,710 | 5,731 | 5,708 | The Marshall Project | |||||||||||
| New York | 42,784 | 40,956 | 38,723 | 37,559 | 37,053 | 36,528 | 35,983 | 35,353 | 34,446 | 33,376 | 32,384 | 31,412 | 31,456 | 31,890 | The Marshall Project | ||||||||||
| North Carolina | 32,933 | 33,347 | 29,886 | 34,046 | 30,877 | 30,873 | 30,779 | 30,198 | 29,922 | 29,740 | 29,916 | 35,140 | 29,415 | 29,535 | 29,487 | 29,528 | The Marshall Project & DPS population reports |
||||||||
| North Dakota | 1,254 | 1,519 | 1,321 | 1,247 | 1,237 | 1,185 | 1,191 | 1,235 | 1,211 | 1,293 | 1,351 | 1,384 | 1,368 | The Marshall Project | |||||||||||
| Ohio | 48,697 | 48,695 | 48,765 | 48,927 | 47,620 | 46,212 | 45,876 | 44,972 | 44,536 | 44,598 | 44,441 | 44,027 | 43,665 | 43,495 | 43,246 | 43,005 | 43,014 | 43,046 | 42,963 | 43,080 | 43,134 | 43,056 | 43,193 | 43,405 | The Marshall Project & DRC weekly population count reports |
| Oklahoma | 25,055 | 25,039 | 24,956 | 24,395 | 23,891 | 22,875 | 22,201 | 21,980 | 21,769 | 21,747 | 21,678 | 21,778 | 21,718 | 21,665 | 21,670 | 21,772 | 21,725 | 21,615 | 21,601 | 21,597 | 21,398 | 21,353 | 21,347 | 21,315 | The Marshall Project & DOC weekly counts |
| Oregon | 14,483 | 14,497 | 14,459 | 14,407 | 14,351 | 14,055 | 13,721 | 13,507 | 13,484 | 13,306 | 13,149 | 12,989 | 12,742 | 12,593 | 12,404 | 12,322 | 12,190 | 12,098 | 12,068 | 12,067 | 12,045 | 12,097 | 12,044 | 12,020 | The Marshall Project & DOC population trend report |
| Pennsylvania | 47,579 | 47,382 | 46,559 | 45,251 | 44,556 | 43,916 | 43,204 | 41,964 | 41,438 | 41,140 | 40,786 | 40,403 | 40,088 | 39,499 | 39,296 | 39,080 | 38,868 | 38,998 | 38,950 | 36,979 | 36,954 | 36,740 | 36,541 | 36,555 | The Marshall Project & DOC monthly population reports |
| Rhode Island | 2,601 | 2,664 | 2,674 | 2,275 | 2,198 | 2,180 | 2,200 | 2,211 | 2,184 | 2,233 | 2,179 | 2,076 | 2,118 | 2,150 | 2,120 | 2,078 | 2,125 | 2,118 | The Marshall Project & DOC monthly reports |
||||||
| South Carolina | 18,106 | 18,074 | 18,028 | 18,229 | 17,687 | 17,455 | 17,224 | 16,361 | 16,121 | 16,230 | 15,806 | 16,013 | 15,676 | 15,720 | 15,586 | 15,548 | 15,213 | 15,420 | 15,458 | 15,171 | 15,275 | 15,408 | 15,151 | 15,182 | DOC daily population counts |
| South Dakota | 3,790 | 3,833 | 3,701 | 3,546 | 3,580 | 3,367 | 3,309 | 3,258 | 3,235 | 3,205 | 3,205 | 3,159 | 3,145 | 3,174 | 3,180 | 3,181 | 3,228 | 3,339 | 3,381 | 3,418 | 3,462 | 3,406 | The Marshall Project & DOC monthly reports |
||
| Tennessee | 21,826 | 21,793 | 21,616 | 21,150 | 20,394 | 20,079 | 19,249 | 19,279 | 19,143 | 19,566 | 19,605 | 19,453 | 19,510 | 19,433 | 19,687 | 19,687 | 20,537 | 20,502 | 20,429 | 20,485 | 20,098 | 20,069 | 19,998 | 19,998 | The Marshall Project & DOC monthly reports |
| Texas | 119,541 | 140,124 | 135,833 | 127,200 | 124,181 | 121,128 | 120,709 | 122,177 | 121,876 | 120,873 | 117,843 | 117,491 | 116,926 | 117,838 | The Marshall Project | ||||||||||
| Utah | 6,900 | 6,441 | 5,993 | 5,915 | 5,824 | 5,814 | 5,898 | 5,496 | 5,485 | 5,581 | 5,602 | 5,663 | 5,728 | The Marshall Project | |||||||||||
| Vermont | 1,656 | 1,406 | 1,395 | 1,417 | 1,390 | 1,417 | 1,413 | 1,369 | 1,380 | 1,292 | 1,281 | 1,272 | 1,238 | 1,228 | 1,395 | 1,285 | 1,291 | 1,300 | 1,322 | 1,308 | 1,319 | 1,281 | The Marshall Project & DOC daily population reports |
||
| Virginia | 29,233 | 29,208 | 29,161 | 28,559 | 27,871 | 28,595 | 26,749 | 26,190 | 25,659 | 25,156 | 24,731 | 24,235 | 23,811 | 23,644 | 23,796 | 23,897 | 23,966 | 24,229 | 24,467 | 24,625 | 24,694 | 24,738 | 24,584 | The Marshall Project & DOC monthly reports |
|
| Washington | 18,998 | 19,151 | 18,797 | 17,587 | 16,906 | 16,703 | 15,313 | 15,185 | 15,093 | 14,900 | 14,682 | 14,518 | 14,312 | 14,064 | 13,875 | 13,693 | 13,497 | 13,380 | 13,348 | 12,809 | 13,200 | DOC monthly population reports | |||
| West Virginia | 5,952 | 5,556 | 4,898 | 4,398 | 4,331 | 4,275 | 4,247 | 4,189 | 3,977 | 3,987 | 3,962 | 4,053 | 4,071 | 4,425 | The Marshall Project | ||||||||||
| Wisconsin | 23,392 | 23,362 | 23,591 | 22,507 | 22,304 | 21,576 | 21,252 | 21,372 | 21,136 | 21,495 | 20,494 | 20,401 | 20,033 | 19,513 | 19,539 | 19,301 | 19,271 | 19,380 | 19,548 | 19,796 | 20,070 | 20,142 | 20,188 | 20,088 | The Marshall Project & DOC weekly population counts |
| Wyoming | 2,156 | 2,098 | 2,001 | 1,986 | 1,959 | 1,996 | 2,232 | 2,157 | 2,134 | 2,133 | 2,252 | The Marshall Project |
Appendix B: County jail populations during COVID-19
This table shows the jail populations for 415 county jails where data was available where data was available for March 10th, 2020 (the day before the pandemic was declared) and for 75% of the days between March 10th, 2020 and December, 2021. (This table is a subset of the population data available for over 1,000 local jails from the NYU Public Safety Lab Jail Data Initiative.)
| State | County | Jail population on 3/10/2020 | Jail population on 5/1/2020 | Jail population on 8/22/2020 | Jail popualtion on 2/3/2021 | Jail population on 7/18/2021 | Jail population on 12/31/2021 | Percent change in jail population from 3/10/20 to 5/1/20 | Percent change in jail population from 5/1/20 to 12/31/21 | Percent change in jail population from 3/10/20 to 12/31/21 |
|---|---|---|---|---|---|---|---|---|---|---|
| Ala. | Autauga | 172 | 155 | 156 | 184 | 151 | 115 | -10% | -26% | -33% |
| Ala. | Chilton | 212 | 170 | 157 | 204 | 221 | 211 | -20% | 24% | 0% |
| Ala. | Clay | 39 | 27 | 31 | 37 | 56 | 50 | -31% | 85% | 28% |
| Ala. | Cleburne | 84 | 66 | 64 | 52 | 72 | 47 | -21% | -29% | -44% |
| Ala. | Coffee | 127 | 63 | 88 | 111 | 151 | 111 | -50% | 76% | -13% |
| Ala. | Coosa | 27 | 17 | 25 | 21 | 31 | 37 | -37% | 118% | 37% |
| Ala. | Dale | 75 | 65 | 74 | 62 | 85 | 82 | -13% | 26% | 9% |
| Ala. | DeKalb | 169 | 105 | 171 | 167 | 196 | 105 | -38% | 0% | -38% |
| Ala. | Houston | 394 | 246 | 350 | 393 | 382 | 344 | -38% | 40% | -13% |
| Ala. | Jackson | 177 | 122 | 202 | 209 | 191 | 136 | -31% | 11% | -23% |
| Ala. | Marion | 131 | 89 | 98 | 155 | 166 | 121 | -32% | 36% | -8% |
| Ala. | Morgan | 617 | 529 | 575 | 582 | 635 | 502 | -14% | -5% | -19% |
| Ala. | Pike | 63 | 39 | 50 | 59 | 68 | 64 | -38% | 64% | 2% |
| Ala. | Randolph | 64 | 55 | 51 | 69 | 66 | 50 | -14% | -9% | -22% |
| Ala. | St. Clair | 222 | 195 | 185 | 218 | 249 | 201 | -12% | 3% | -9% |
| Ala. | Talladega | 301 | 205 | 238 | 318 | 324 | 287 | -32% | 40% | -5% |
| Ala. | Washington | 58 | 31 | 31 | 37 | 67 | 80 | -47% | 158% | 38% |
| Ariz. | Yavapai | 537 | 398 | 498 | 479 | 543 | 496 | -26% | 25% | -8% |
| Ariz. | Yuma | 432 | 370 | 389 | 456 | 461 | 422 | -14% | 14% | -2% |
| Ark. | Baxter | 121 | 74 | 94 | 124 | 129 | 126 | -39% | 70% | 4% |
| Ark. | Crawford | 217 | 121 | 176 | 242 | 232 | 277 | -44% | 129% | 28% |
| Ark. | Franklin | 36 | 17 | 58 | 84 | 81 | 91 | -53% | 435% | 153% |
| Ark. | Howard | 41 | 18 | 21 | 20 | 32 | 39 | -56% | 117% | -5% |
| Ark. | Johnson | 64 | 28 | 44 | 83 | 79 | 90 | -56% | 221% | 41% |
| Ark. | Marion | 42 | 23 | 24 | 61 | 77 | 57 | -45% | 148% | 36% |
| Ark. | Nevada | 56 | 39 | 69 | 52 | 49 | 55 | -30% | 41% | -2% |
| Ark. | Poinsett | 81 | 39 | 66 | 79 | 92 | 88 | -52% | 126% | 9% |
| Ark. | Pope | 193 | 115 | 162 | 159 | 205 | 191 | -40% | 66% | -1% |
| Ark. | Saline | 235 | 124 | 139 | 185 | 218 | 233 | -47% | 88% | -1% |
| Ark. | Stone | 36 | 29 | 39 | 36 | 42 | 30 | -19% | 3% | -17% |
| Ark. | Union | 199 | 127 | 135 | 170 | 184 | 156 | -36% | 23% | -22% |
| Ark. | Van Buren | 78 | 33 | 31 | 40 | 80 | 70 | -58% | 112% | -10% |
| Ark. | Washington | 679 | 343 | 415 | 548 | 630 | 728 | -49% | 112% | 7% |
| Ark. | White | 287 | 105 | 110 | 217 | 258 | 269 | -63% | 156% | -6% |
| Calif. | El Dorado | 390 | 306 | 331 | 339 | 313 | 306 | -22% | 0% | -22% |
| Calif. | Shasta | 379 | 373 | 473 | 422 | 379 | 384* | -2% | 3% | 1% |
| Calif. | Siskiyou | 94 | 55 | 82 | 70 | 79 | 72 | -41% | 31% | -23% |
| Calif. | Stanislaus | 1,357 | 1,118 | 1,118 | 1,183 | 1,204 | 1,283 | -18% | 15% | -5% |
| Calif. | Tulare | 1,571 | 1,095 | 1,265 | 1,355 | 1,444 | 1,319* | -30% | 20% | -16% |
| Calif. | Yuba | 385 | 257 | 243 | 222 | 198 | 189 | -33% | -26% | -51% |
| Colo. | Arapahoe | 1,134 | 709 | 675 | 820 | 768 | 738 | -37% | 4% | -35% |
| Colo. | Bent | 55 | 29 | 42 | 77 | 53 | 60 | -47% | 107% | 9% |
| Colo. | Boulder | 652 | 385 | 418 | 411 | 474 | 493 | -41% | 28% | -24% |
| Colo. | Douglas | 341 | 209 | 212 | 269 | 291 | 342 | -39% | 64% | 0% |
| Colo. | Jefferson | 1,265 | 691 | 748 | 795 | 1,039 | 1,052 | -45% | 52% | -17% |
| Colo. | Pueblo | 646 | 396 | 427 | 416 | 484 | 509 | -39% | 29% | -21% |
| Fla. | Alachua | 735 | 592 | 693 | 839 | 762 | 784 | -19% | 32% | 7% |
| Fla. | DeSoto | 147 | 132 | 157 | 154 | 158 | 171 | -10% | 30% | 16% |
| Fla. | Flagler | 205 | 165 | 163 | 191 | 193 | 201 | -20% | 22% | -2% |
| Fla. | Lake | 21 | 17 | 22 | 12 | 27 | 34 | -19% | 100% | 62% |
| Fla. | Monroe | 514 | 383 | 395 | 484 | 478 | 517 | -25% | 35% | 1% |
| Fla. | Nassau | 243 | 168 | 197 | 236 | 214 | 270 | -31% | 61% | 11% |
| Fla. | Sarasota | 872 | 788 | 820 | 891 | 938 | 964 | -10% | 22% | 11% |
| Fla. | St. Lucie | 1,301 | 1,176 | 1,278 | 1,384 | 1,350 | 1,332 | -10% | 13% | 2% |
| Fla. | Walton | 436 | 375 | 404 | 432 | 425 | 438 | -14% | 17% | 0% |
| Ga. | Bartow | 673 | 506 | 594 | 610 | 588 | 501 | -25% | -1% | -26% |
| Ga. | Berrien | 98 | 61 | 90 | 86 | 83 | 76 | -38% | 25% | -22% |
| Ga. | Brantley | 122 | 99 | 135 | 109 | 109 | 97 | -19% | -2% | -20% |
| Ga. | Bulloch | 343 | 251 | 251 | 346 | 367 | 348 | -27% | 39% | 1% |
| Ga. | Burke | 106 | 87 | 91 | 109 | 103 | 121 | -18% | 39% | 14% |
| Ga. | Camden | 112 | 103 | 130 | 140 | 136 | 125 | -8% | 21% | 12% |
| Ga. | Carroll | 444 | 294 | 343 | 394 | 527 | 447 | -34% | 52% | 1% |
| Ga. | Columbia | 276 | 197 | 177 | 218 | 279 | 269 | -29% | 37% | -3% |
| Ga. | Decatur | 117 | 103 | 121 | 146 | 123 | 115 | -12% | 12% | -2% |
| Ga. | Dodge | 123 | 118 | 121 | 125 | 134 | 140 | -4% | 19% | 14% |
| Ga. | Dougherty | 586 | 378 | 477 | 514 | 542 | 599 | -35% | 58% | 2% |
| Ga. | Douglas | 683 | 395 | 472 | 359 | 664 | 631 | -42% | 60% | -8% |
| Ga. | Effingham | 237 | 184 | 139 | 158 | 224 | 191 | -22% | 4% | -19% |
| Ga. | Elbert | 95 | 54 | 55 | 73 | 68 | 64 | -43% | 19% | -33% |
| Ga. | Fayette | 205 | 120 | 141 | 198 | 266 | 230 | -41% | 92% | 12% |
| Ga. | Floyd | 645 | 425 | 538 | 566 | 561 | 532 | -34% | 25% | -18% |
| Ga. | Gordon | 290 | 192 | 230 | 270 | 227 | 235 | -34% | 22% | -19% |
| Ga. | Habersham | 164 | 100 | 120 | 143 | 111 | 119 | -39% | 19% | -27% |
| Ga. | Haralson | 185 | 124 | 131 | 136 | 158 | 116 | -33% | -6% | -37% |
| Ga. | Jackson | 143 | 93 | 116 | 184 | 166 | 117 | -35% | 26% | -18% |
| Ga. | Lamar | 58 | 45 | 41 | 52 | 64 | 50 | -22% | 11% | -14% |
| Ga. | Laurens | 337 | 273 | 244 | 318 | 322 | 280 | -19% | 3% | -17% |
| Ga. | Liberty | 209 | 156 | 194 | 187 | 202 | 159 | -25% | 2% | -24% |
| Ga. | Monroe | 128 | 100 | 105 | 140 | 133 | 118 | -22% | 18% | -8% |
| Ga. | Oconee | 28 | 16 | 22 | 18 | 32 | 60 | -45% | 287% | 114% |
| Ga. | Pickens | 77 | 50 | 65 | 93 | 96 | 53 | -34% | 5% | -31% |
| Ga. | Polk | 179 | 117 | 146 | 107 | 205 | 260 | -35% | 122% | 45% |
| Ga. | Rabun | 108 | 42 | 66 | 78 | 95 | 74 | -61% | 76% | -31% |
| Ga. | Richmond | 1,033 | 876 | 914 | 988 | 989 | 928 | -15% | 6% | -10% |
| Ga. | Spalding | 388 | 245 | 284 | 343 | 423 | 405 | -37% | 65% | 4% |
| Ga. | Sumter | 159 | 106 | 130 | 151 | 172 | 136 | -33% | 28% | -14% |
| Ga. | Tattnall | 86 | 37 | 44 | 82 | 88 | 100 | -57% | 170% | 16% |
| Ga. | Tift | 229 | 198 | 230 | 268 | 272 | 264 | -14% | 33% | 15% |
| Ga. | Turner | 67 | 52 | 56 | 50 | 80 | 58 | -22% | 12% | -13% |
| Ga. | Union | 52 | 27 | 37 | 46 | 55 | 44 | -48% | 63% | -15% |
| Ga. | Upson | 104 | 53 | 74 | 104 | 131 | 147 | -49% | 177% | 41% |
| Ga. | Ware | 421 | 319 | 361 | 450 | 443 | 387 | -24% | 21% | -8% |
| Ga. | Washington | 79 | 74 | 81 | 91 | 93 | 102 | -6% | 38% | 29% |
| Ga. | Whitfield | 486 | 333 | 389 | 442 | 435 | 366* | -31% | 10% | -25% |
| Ga. | Worth | 69 | 54 | 92 | 75 | 122 | 85 | -22% | 57% | 23% |
| Idaho | Blaine | 67 | 52 | 45 | 13 | 12 | 12 | -22% | -77% | -82% |
| Idaho | Bonneville | 392 | 283 | 290 | 256 | 296 | 293 | -28% | 4% | -25% |
| Idaho | Canyon | 446 | 343 | 410 | 350 | 365 | 391 | -23% | 14% | -12% |
| Idaho | Nez Perce | 126 | 83 | 103 | 94 | 102 | 88 | -34% | 6% | -30% |
| Idaho | Power | 15 | 9 | 11 | 5 | 9 | 8 | -42% | -9% | -47% |
| Idaho | Washington | 40 | 28 | 35 | 37 | 35 | 23 | -30% | -18% | -43% |
| Ill. | Kendall | 157 | 132 | 129 | 142 | 144 | 130 | -16% | -2% | -17% |
| Ill. | Macon | 300 | 236 | 307 | 314 | 282 | 310 | -21% | 31% | 3% |
| Ill. | Randolph | 25 | 12 | 13 | 22 | 23 | 19 | -52% | 60% | -24% |
| Ill. | Will | 693 | 570 | 568 | 614 | 542 | 617* | -18% | 8% | -11% |
| Ill. | Woodford | 52 | 34 | 65 | 72 | 65 | 66 | -35% | 94% | 27% |
| Ind. | Dearborn | 233 | 186 | 283 | 279 | 284 | 235 | -20% | 26% | 1% |
| Ind. | Hamilton | 298 | 171 | 250 | 283 | 287 | 292 | -43% | 71% | -2% |
| Ind. | Hendricks | 266 | 172 | 229 | 206 | 257 | 230 | -35% | 34% | -14% |
| Ind. | Jackson | 250 | 156 | 199 | 196 | 235 | 220 | -38% | 41% | -12% |
| Ind. | Starke | 119 | 98 | 87 | 107 | 133 | 129 | -17% | 31% | 8% |
| Iowa | Buena Vista | 23 | 6 | 7 | 21 | 18 | 14 | -74% | 133% | -39% |
| Iowa | Cerro Gordo | 69 | 42 | 55 | 53 | 57 | 60 | -39% | 43% | -13% |
| Iowa | Clinton | 59 | 26 | 49 | 54 | 56 | 77 | -56% | 196% | 31% |
| Iowa | Dallas | 28 | 26 | 43 | 33 | 47 | 43 | -7% | 65% | 54% |
| Iowa | Dickinson | 13 | 5 | 7 | 6 | 7 | 7 | -62% | 40% | -46% |
| Iowa | Hardin | 85 | 38 | 75 | 62 | 44 | 34 | -55% | -11% | -60% |
| Iowa | Polk | 896 | 481 | 691 | 728 | 819 | 701 | -46% | 46% | -22% |
| Iowa | Scott | 449 | 241 | 272 | 215 | 224 | 219 | -46% | -9% | -51% |
| Iowa | Story | 73 | 30 | 46 | 62 | 48 | 49 | -59% | 63% | -33% |
| Kans. | Brown | 12 | 12 | 21 | 19 | 21 | 11 | 0% | -8% | -8% |
| Kans. | Crawford | 76 | 51 | 49 | 65 | 87 | 95 | -33% | 86% | 25% |
| Kans. | Dickinson | 20 | 16 | 18 | 4 | 15 | 30 | -20% | 88% | 50% |
| Kans. | Doniphan | 9 | 11 | 4 | 3 | 7 | 5 | 22% | -55% | -44% |
| Kans. | Finney | 95 | 56 | 90 | 57 | 99 | 84 | -41% | 50% | -12% |
| Kans. | Geary | 101 | 64 | 88 | 89 | 93 | 87 | -37% | 36% | -14% |
| Kans. | Jackson | 83 | 58 | 57 | 71 | 59 | 70 | -30% | 21% | -16% |
| Kans. | Shawnee | 553 | 368 | 450 | 476 | 535 | 541 | -33% | 47% | -2% |
| Kans. | Sherman | 18 | 14 | 18 | 15 | 20 | 9 | -22% | -36% | -50% |
| Kans. | Sumner | 143 | 47 | 58 | 94 | 117 | 118 | -67% | 151% | -17% |
| Kans. | Thomas | 14 | 11 | 18 | 14 | 12 | 19 | -21% | 73% | 36% |
| Kans. | Wabaunsee | 9 | 7 | 5 | 9 | 9 | 8 | -21% | 12% | -11% |
| Ky. | Allen | 80 | 29 | 54 | 58 | 87 | 81* | -64% | 181% | 1% |
| Ky. | Bell | 117 | 62 | 111 | 131 | 130 | 136 | -47% | 121% | 16% |
| Ky. | Boone | 457 | 348 | 450 | 438 | 480 | 375 | -24% | 8% | -18% |
| Ky. | Campbell | 591 | 434 | 495 | 524 | 392 | 355 | -27% | -18% | -40% |
| Ky. | Christian | 768 | 566 | 605 | 633 | 639 | 780 | -26% | 38% | 2% |
| Ky. | Clark | 305 | 156 | 135 | 175 | 166 | 225 | -49% | 44% | -26% |
| Ky. | Daviess | 740 | 485 | 552 | 622 | 586 | 598 | -34% | 23% | -19% |
| Ky. | Franklin | 293 | 179 | 198 | 167 | 242 | 238 | -39% | 33% | -19% |
| Ky. | Graves | 183 | 137 | 147 | 140 | 168 | 195* | -25% | 42% | 7% |
| Ky. | Jackson | 128 | 82 | 79 | 80 | 91 | 103 | -36% | 25% | -20% |
| Ky. | Jessamine | 143 | 77 | 83 | 106 | 154 | 117 | -47% | 53% | -18% |
| Ky. | Larue | 143 | 95 | 85 | 138 | 131 | 152 | -33% | 59% | 6% |
| Ky. | Mason | 188 | 104 | 113 | 98 | 170 | 163 | -45% | 57% | -13% |
| Ky. | Muhlenberg | 278 | 200 | 230 | 234 | 244 | 276 | -28% | 38% | -1% |
| Ky. | Nelson | 118 | 73 | 116 | 114 | 84 | 93 | -38% | 27% | -21% |
| Ky. | Pike | 449 | 347 | 317 | 368 | 392 | 379 | -23% | 9% | -16% |
| Ky. | Pulaski | 352 | 192 | 282 | 266 | 300 | 363 | -45% | 89% | 3% |
| Ky. | Rockcastle | 104 | 52 | 60 | 53 | 74 | 83 | -50% | 60% | -20% |
| Ky. | Todd | 135 | 114 | 91 | 127 | 143 | 146 | -16% | 28% | 8% |
| Ky. | Wayne | 197 | 127 | 136 | 123 | 136 | 138 | -36% | 9% | -30% |
| La. | Allen | 103 | 58 | 62 | 57 | 90 | 96 | -44% | 66% | -7% |
| La. | Assumption | 101 | 84 | 85 | 126 | 135 | 200 | -17% | 138% | 98% |
| La. | Avoyelles | 424 | 358 | 340 | 320 | 325 | 373 | -16% | 4% | -12% |
| La. | Beauregard | 164 | 122 | 130 | 145 | 156 | 225 | -26% | 84% | 37% |
| La. | Bienville | 42 | 29 | 30 | 22 | 21 | 23 | -31% | -21% | -45% |
| La. | Bogalusa City | 19 | 12 | 11 | 13 | 8 | 20 | -39% | 71% | 5% |
| La. | Caldwell | 611 | 560 | 508 | 572 | 586 | 585 | -8% | 4% | -4% |
| La. | Catahoula | 72 | 28 | 49 | 51 | 71 | 75 | -61% | 168% | 4% |
| La. | Claiborne | 579 | 502 | 488 | 430 | 465 | 561 | -13% | 12% | -3% |
| La. | East Feliciana | 244 | 220 | 239 | 238 | 237 | 233 | -10% | 6% | -5% |
| La. | Evangeline | 74 | 54 | 60 | 63 | 67 | 60 | -27% | 11% | -19% |
| La. | Franklin | 815 | 705 | 721 | 818 | 809 | 773 | -13% | 10% | -5% |
| La. | Hammond City | 14 | 7 | 9 | 10 | 2 | 11 | -50% | 57% | -21% |
| La. | Iberville | 106 | 99 | 124 | 110 | 95 | 89 | -7% | -10% | -16% |
| La. | Jefferson Davis | 159 | 100 | 79 | 101 | 113 | 102 | -37% | 2% | -36% |
| La. | Lafayette | 997 | 657 | 500 | 552 | 612 | 636 | -34% | -3% | -36% |
| La. | Lafourche | 458 | 324 | 320 | 358 | 510 | 586 | -29% | 81% | 28% |
| La. | LaSalle | 73 | 55 | 66 | 76 | 114 | 111 | -25% | 102% | 52% |
| La. | Morehouse | 464 | 440 | 491 | 432 | 393 | 383 | -5% | -13% | -17% |
| La. | Pointe Coupee | 100 | 74 | 73 | 86 | 103 | 81 | -26% | 10% | -19% |
| La. | Rapides | 877 | 743 | 806 | 869 | 904 | 896 | -15% | 21% | 2% |
| La. | Red River | 64 | 59 | 49 | 56 | 57 | 46 | -8% | -22% | -28% |
| La. | Richland | 751 | 654 | 645 | 696 | 696 | 666 | -13% | 2% | -11% |
| La. | Sabine | 203 | 161 | 167 | 165 | 185 | 230 | -21% | 43% | 13% |
| La. | Shreveport | 63 | 14 | 30 | 40 | 47 | 42 | -78% | 200% | -33% |
| La. | St. Charles | 458 | 409 | 415 | 394 | 379 | 385 | -11% | -6% | -16% |
| La. | St. James | 68 | 50 | 45 | 57 | 64 | 80 | -26% | 60% | 18% |
| La. | St. John | 147 | 132 | 106 | 81 | 72 | 67 | -10% | -49% | -54% |
| La. | Sulphur | 11 | 7 | 18 | 19 | 8 | 6 | -36% | -14% | -45% |
| La. | Tangipahoa | 573 | 460 | 506 | 563 | 580 | 548 | -20% | 19% | -4% |
| La. | Terrebonne | 647 | 514 | 533 | 539 | 573 | 548 | -21% | 7% | -15% |
| La. | Vermilion | 147 | 124 | 122 | 162 | 142 | 152 | -16% | 23% | 3% |
| La. | Vernon | 131 | 94 | 125 | 119 | 107 | 131 | -28% | 40% | 0% |
| La. | Ville Platte | 15 | 19 | 15 | 11 | 9 | 16 | 27% | -16% | 7% |
| La. | Washington | 163 | 116 | 177 | 186 | 187 | 207 | -29% | 78% | 27% |
| La. | Webster | 627 | 563 | 538 | 555 | 605 | 618 | -10% | 10% | -1% |
| La. | West Feliciana | 25 | 12 | 35 | 123 | 116 | 113 | -54% | 878% | 352% |
| Maine | Cumberland | 354 | 240 | 329 | 305 | 304 | 255 | -32% | 6% | -28% |
| Mass. | Worcester | 771 | 524 | 498 | 494 | 545 | 572* | -32% | 9% | -26% |
| Md. | Allegany | 191 | 125 | 153 | 134 | 184 | 169 | -35% | 35% | -12% |
| Md. | Prince Georges | 885 | 699 | 865 | 975 | 1,004 | 1,016* | -21% | 45% | 15% |
| Mich. | Delta | 125 | 81 | 103 | 90 | 105 | 122 | -35% | 51% | -2% |
| Mich. | Midland | 108 | 70 | 78 | 64 | 67 | 87 | -36% | 25% | -19% |
| Mich. | Wayne | 2,103 | 1,746 | 2,377 | 3,042 | 3,051 | 3,211 | -17% | 84% | 53% |
| Minn. | Beltrami | 117 | 63 | 78 | 86 | 81 | 82 | -46% | 30% | -30% |
| Minn. | Blue Earth | 114 | 70 | 89 | 74 | 71 | 59* | -39% | -16% | -48% |
| Minn. | Brown | 18 | 8 | 17 | 17 | 19 | 20 | -56% | 150% | 11% |
| Minn. | Carlton | 33 | 13 | 13 | 24 | 28 | 14 | -61% | 8% | -58% |
| Minn. | Chisago | 61 | 22 | 30 | 31 | 35 | 34 | -64% | 55% | -44% |
| Minn. | Clay | 121 | 65 | 66 | 99 | 110 | 117 | -47% | 81% | -3% |
| Minn. | Clearwater | 17 | 6 | 12 | 7 | 23 | 20 | -65% | 233% | 18% |
| Minn. | Crow Wing | 157 | 88 | 100 | 87 | 114 | 115 | -44% | 31% | -27% |
| Minn. | Fillmore | 7 | 8 | 5 | 6 | 9 | 6 | 14% | -25% | -14% |
| Minn. | Hubbard | 64 | 27 | 44 | 49 | 40 | 63 | -58% | 133% | -2% |
| Minn. | Isanti | 60 | 22 | 35 | 28 | 29 | 25 | -63% | 14% | -58% |
| Minn. | Kanabec | 40 | 16 | 16 | 17 | 12 | 11 | -60% | -31% | -73% |
| Minn. | Kandiyohi | 91 | 60 | 75 | 45 | 52 | 79 | -34% | 32% | -13% |
| Minn. | Koochiching | 4 | 2 | 5 | 10 | 11 | 11 | -50% | 450% | 175% |
| Minn. | Le Sueur | 24 | 16 | 12 | 13 | 7 | 19 | -33% | 19% | -21% |
| Minn. | McLeod | 36 | 10 | 20 | 24 | 30 | 16 | -72% | 60% | -56% |
| Minn. | Mille Lacs | 81 | 32 | 38 | 40 | 43 | 47 | -60% | 47% | -42% |
| Minn. | Morrison | 33 | 19 | 30 | 25 | 37 | 31 | -42% | 63% | -6% |
| Minn. | Nicollet | 26 | 11 | 14 | 15 | 13 | 12 | -58% | 9% | -54% |
| Minn. | Pipestone | 14 | 2 | 9 | 8 | 12 | 2 | -86% | 3% | -85% |
| Minn. | Redwood | 12 | 10 | 14 | 14 | 12 | 13 | -17% | 30% | 8% |
| Minn. | Renville | 39 | 10 | 20 | 23 | 21 | 36 | -74% | 260% | -8% |
| Minn. | Roseau | 21 | 9 | 15 | 7 | 9 | 10 | -57% | 11% | -52% |
| Minn. | Scott | 141 | 53 | 61 | 103 | 126 | 112 | -62% | 111% | -21% |
| Minn. | Sherburne | 307 | 237 | 255 | 242 | 274 | 300* | -23% | 27% | -2% |
| Minn. | Sibley | 10 | 8 | 4 | 6 | 8 | 8 | -20% | 0% | -20% |
| Minn. | Swift | 4 | 2 | 3 | 3 | 9 | 5 | -50% | 150% | 25% |
| Minn. | Wilkin | 9 | 2 | 6 | 5 | 5 | 15 | -78% | 650% | 67% |
| Minn. | Winona | 31 | 18 | 28 | 16 | 24 | 18 | -42% | 0% | -42% |
| Minn. | Wright | 186 | 92 | 108 | 145 | 122 | 132 | -51% | 43% | -29% |
| Minn. | Yellow Medicine | 15 | 10 | 13 | 11 | 17 | 19 | -33% | 90% | 27% |
| Miss. | Adams | 77 | 69 | 58 | 71 | 90 | 86 | -10% | 25% | 12% |
| Miss. | Clay | 68 | 59 | 53 | 67 | 83 | 84 | -13% | 43% | 24% |
| Miss. | Hancock | 203 | 171 | 211 | 177 | 204 | 193 | -16% | 13% | -5% |
| Miss. | Jackson | 340 | 292 | 352 | 368 | 379 | 423 | -14% | 45% | 24% |
| Miss. | Jasper | 30 | 20 | 33 | 24 | 27 | 24 | -33% | 20% | -20% |
| Miss. | Lamar | 107 | 74 | 92 | 80 | 115 | 86 | -31% | 16% | -20% |
| Miss. | Lee | 194 | 182 | 205 | 232 | 33 | 33 | -6% | -82% | -83% |
| Miss. | Tunica | 27 | 23 | 21 | 27 | 23 | 31 | -15% | 35% | 15% |
| Mo. | Barry | 46 | 43 | 53 | 65 | 68 | 73 | -7% | 70% | 59% |
| Mo. | Bates | 31 | 19 | 9 | 14 | 22 | 22 | -39% | 16% | -29% |
| Mo. | Benton | 35 | 9 | 19 | 25 | 35 | 31 | -74% | 244% | -11% |
| Mo. | Boone | 253 | 183 | 225 | 240 | 239 | 171 | -28% | -7% | -32% |
| Mo. | Buchanan | 222 | 128 | 177 | 196 | 205 | 145 | -42% | 13% | -35% |
| Mo. | Cape Girardeau | 148 | 149 | 174 | 196 | 222 | 240 | 1% | 61% | 62% |
| Mo. | Christian | 102 | 49 | 68 | 74 | 71 | 61 | -52% | 24% | -40% |
| Mo. | Clay | 301 | 179 | 236 | 207 | 262 | 228 | -41% | 27% | -24% |
| Mo. | Jackson | 851 | 643 | 753 | 786 | 777 | 718 | -24% | 12% | -16% |
| Mo. | Johnson | 202 | 80 | 108 | 119 | 149 | 165 | -60% | 106% | -18% |
| Mo. | Joplin | 54 | 30 | 34 | 36 | 36 | 49 | -45% | 64% | -9% |
| Mo. | Lewis | 9 | 10 | 8 | 15 | 14 | 9 | 11% | -10% | 0% |
| Mo. | Marion | 81 | 41 | 64 | 82 | 82 | 72 | -49% | 76% | -11% |
| Mo. | McDonald | 35 | 19 | 36 | 32 | 45 | 40 | -46% | 111% | 14% |
| Mo. | Saline | 57 | 41 | 48 | 44 | 63 | 57 | -29% | 40% | 0% |
| Mo. | Stone | 65 | 38 | 66 | 44 | 50 | 38 | -42% | 0% | -42% |
| Mont. | Big Horn | 38 | 28 | 27 | 33 | 33 | 28 | -26% | 0% | -26% |
| Mont. | Lewis and Clark | 106 | 86 | 103 | 113 | 102 | 102 | -19% | 19% | -4% |
| Mont. | Ravalli | 41 | 26 | 44 | 49 | 50 | 41 | -37% | 58% | 0% |
| Mont. | Valley | 42 | 20 | 22 | 17 | 19 | 17 | -53% | -14% | -60% |
| N.C. | Alamance | 363 | 237 | 218 | 243 | 256 | 323 | -35% | 36% | -11% |
| N.C. | Burke | 135 | 95 | 124 | 118 | 128 | 88 | -30% | -7% | -35% |
| N.C. | Cabarrus | 327 | 202 | 188 | 206 | 238 | 254 | -38% | 26% | -22% |
| N.C. | Carteret | 167 | 128 | 140 | 103 | 103 | 102 | -23% | -20% | -39% |
| N.C. | Catawba | 302 | 183 | 249 | 215 | 299 | 261 | -39% | 43% | -14% |
| N.C. | Clay | 316 | 228 | 197 | 169 | 261 | 317 | -28% | 39% | 0% |
| N.C. | Cleveland | 325 | 168 | 203 | 232 | 282 | 286 | -48% | 70% | -12% |
| N.C. | Davidson | 340 | 219 | 207 | 234 | 287 | 276 | -36% | 26% | -19% |
| N.C. | Gaston | 585 | 393 | 505 | 496 | 567 | 501 | -33% | 27% | -14% |
| N.C. | Guilford | 1,093 | 813 | 764 | 731 | 832 | 860 | -26% | 6% | -21% |
| N.C. | Lee | 119 | 92 | 124 | 117 | 131 | 134 | -23% | 46% | 13% |
| N.C. | Lincoln | 153 | 80 | 63 | 111 | 129 | 116 | -48% | 45% | -24% |
| N.C. | Moore | 140 | 113 | 115 | 146 | 153 | 142 | -19% | 26% | 1% |
| N.C. | Pender | 89 | 72 | 74 | 78 | 81 | 94 | -19% | 31% | 6% |
| N.C. | Randolph | 260 | 182 | 263 | 171 | 244 | 227 | -30% | 25% | -13% |
| N.C. | Richmond | 114 | 76 | 92 | 76 | 96 | 99 | -33% | 30% | -13% |
| N.C. | Rowan | 345 | 216 | 243 | 243 | 333 | 279 | -37% | 29% | -19% |
| N.C. | Sampson | 254 | 157 | 164 | 169 | 234 | 262 | -38% | 67% | 3% |
| N.C. | Stanly | 157 | 121 | 145 | 139 | 160 | 150 | -23% | 24% | -4% |
| N.C. | Transylvania | 77 | 39 | 43 | 31 | 51 | 45 | -49% | 15% | -42% |
| N.C. | Wake | 1,266 | 1,113 | 1,074 | 1,201 | 1,229 | 1,289 | -12% | 16% | 2% |
| N.C. | Washington | 457 | 332 | 303 | 291 | 341 | 323 | -27% | -3% | -29% |
| N.D. | Stutsman | 47 | 42 | 50 | 44 | 47 | 39 | -11% | -7% | -17% |
| N.D. | Williams | 91 | 88 | 105 | 105 | 83 | 57 | -3% | -35% | -37% |
| N.J. | Bergen | 618 | 246 | 301 | 375 | 379 | 663 | -60% | 170% | 7% |
| N.J. | Cumberland | 341 | 221 | 278 | 289 | 339 | 344 | -35% | 56% | 1% |
| N.J. | Ocean | 329 | 191 | 292 | 280 | 290 | 319 | -42% | 67% | -3% |
| N.J. | Salem | 303 | 216 | 292 | 340 | 357 | 352 | -29% | 63% | 16% |
| N.M. | Curry | 184 | 121 | 174 | 174 | 164 | 149 | -34% | 23% | -19% |
| N.M. | Hobbs | 12 | 7 | 13 | 24 | 8 | 13* | -42% | 86% | 8% |
| N.M. | Lea | 238 | 121 | 145 | 159 | 180 | 186 | -49% | 54% | -22% |
| N.M. | San Juan | 519 | 287 | 410 | 428 | 542 | 515 | -45% | 79% | -1% |
| N.Y. | Monroe | 769 | 634 | 675 | 745 | 744 | 704 | -18% | 11% | -8% |
| Nebr. | Hall | 276 | 178 | 227 | 204 | 226 | 251 | -36% | 41% | -9% |
| Nebr. | Lancaster | 629 | 446 | 535 | 568 | 647 | 661* | -29% | 48% | 5% |
| Nebr. | Lincoln | 117 | 101 | 115 | 120 | 150 | 115 | -14% | 14% | -2% |
| Ohio | Adams | 43 | 14 | 34 | 18 | 37 | 32 | -67% | 129% | -26% |
| Ohio | Clermont | 379 | 255 | 337 | 333 | 316 | 300 | -33% | 18% | -21% |
| Ohio | Clinton | 81 | 52 | 68 | 51 | 71 | 46 | -36% | -12% | -43% |
| Ohio | Delaware | 235 | 118 | 161 | 138 | 157 | 154 | -50% | 31% | -34% |
| Ohio | Franklin | 2,009 | 1,350 | 1,591 | 1,663 | 1,683 | 1,601 | -33% | 19% | -20% |
| Ohio | Gallia | 59 | 33 | 40 | 59 | 63 | 61 | -44% | 85% | 3% |
| Ohio | Guernsey | 105 | 54 | 92 | 77 | 105 | 108 | -49% | 100% | 3% |
| Ohio | Hamilton | 1,512 | 925 | 1,298 | 1,342 | 1,276 | 1,249 | -39% | 35% | -17% |
| Ohio | Morrow | 104 | 79 | 73 | 66 | 110 | 107 | -24% | 35% | 3% |
| Ohio | Ottawa | 92 | 48 | 59 | 51 | 74 | 61 | -48% | 27% | -34% |
| Ohio | Pickaway | 121 | 61 | 106 | 90 | 82 | 99 | -50% | 62% | -18% |
| Okla. | Carter | 36 | 8 | 40 | 18 | 32 | 6 | -78% | -25% | -83% |
| Okla. | Comanche | 357 | 331 | 218 | 289 | 364 | 326 | -7% | -2% | -9% |
| Okla. | Garvin | 67 | 35 | 68 | 66 | 81 | 59 | -48% | 69% | -12% |
| Okla. | Okmulgee | 176 | 161 | 234 | 139 | 130 | 130 | -9% | -19% | -26% |
| Okla. | Pottawatomie | 204 | 119 | 201 | 228 | 225 | 158 | -42% | 33% | -23% |
| Ore. | Baker | 32 | 14 | 12 | 24 | 23 | 16 | -56% | 14% | -50% |
| Ore. | Clackamas | 434 | 138 | 221 | 229 | 244 | 216 | -68% | 57% | -50% |
| Ore. | Clatsop | 58 | 32 | 45 | 50 | 61 | 55 | -45% | 72% | -5% |
| Ore. | Douglas | 206 | 72 | 78 | 147 | 175 | 133 | -65% | 85% | -35% |
| Ore. | Harney | 8 | 2 | 4 | 7 | 8 | 7 | -71% | 204% | -13% |
| Ore. | Jackson | 327 | 243 | 264 | 257 | 282 | 266* | -26% | 9% | -19% |
| Ore. | Josephine | 192 | 94 | 167 | 97 | 181 | 147 | -51% | 56% | -23% |
| Ore. | Klamath | 136 | 75 | 79 | 84 | 111 | 115 | -45% | 53% | -15% |
| Ore. | Lincoln | 161 | 70 | 97 | 108 | 110 | 117 | -57% | 67% | -27% |
| Ore. | Linn | 207 | 105 | 129 | 122 | 154 | 116 | -49% | 10% | -44% |
| Ore. | Marion | 430 | 275 | 289 | 318 | 297 | 348 | -36% | 27% | -19% |
| Ore. | Marion Work Center | 91 | 31 | 70 | 55 | 59* | 59* | -66% | 90% | -35% |
| Ore. | Multnomah | 1,122 | 718 | 625 | 812 | 802 | 796 | -36% | 11% | -29% |
| Ore. | Polk | 110 | 24 | 72 | 67 | 98 | 80 | -78% | 233% | -27% |
| Ore. | Tillamook | 65 | 38 | 37 | 26 | 36 | 17 | -42% | -55% | -74% |
| Ore. | Wasco | 132 | 51 | 49 | 65 | 78 | 69 | -61% | 35% | -48% |
| Ore. | Washington | 878 | 477 | 527 | 456 | 583 | 580 | -46% | 22% | -34% |
| Ore. | Yamhill | 167 | 53 | 60 | 77 | 75 | 85 | -68% | 60% | -49% |
| Pa. | Clinton | 46 | 46 | 191 | 175 | 185 | 138 | 0% | 200% | 200% |
| Pa. | Cumberland | 409 | 265 | 252 | 242 | 299 | 311 | -35% | 17% | -24% |
| Pa. | Dauphin | 1,110 | 890 | 871 | 975 | 970 | 1,003 | -20% | 13% | -10% |
| Pa. | Lancaster | 786 | 625 | 670 | 619 | 710 | 740 | -20% | 18% | -6% |
| S.C. | Aiken | 460 | 380 | 418 | 430 | 302 | 289 | -17% | -24% | -37% |
| S.C. | Anderson City | 97 | 83 | 88 | 93 | 94 | 80 | -14% | -4% | -18% |
| S.C. | Berkeley | 439 | 327 | 326 | 396 | 414 | 434 | -26% | 33% | -1% |
| S.C. | Cherokee | 358 | 265 | 297 | 316 | 344 | 330 | -26% | 25% | -8% |
| S.C. | Darlington | 164 | 160 | 142 | 181 | 204 | 165 | -2% | 3% | 1% |
| S.C. | Kershaw | 80 | 73 | 111 | 92 | 110 | 116 | -9% | 59% | 45% |
| S.C. | Laurens | 226 | 165 | 177 | 175 | 229 | 185 | -27% | 12% | -18% |
| S.C. | Lexington | 493 | 314 | 339 | 424 | 504 | 457 | -36% | 46% | -7% |
| S.C. | Marion | 7 | 7 | 1 | 1 | 2 | 1 | 0% | -86% | -86% |
| S.C. | Pickens | 303 | 203 | 253 | 209 | 252 | 305 | -33% | 50% | 1% |
| S.C. | Sumter | 310 | 266 | 259 | 295 | 334 | 325 | -14% | 22% | 5% |
| S.D. | Clay | 12 | 7 | 13 | 19 | 15 | 18 | -42% | 157% | 50% |
| Tenn. | Blount | 533 | 371 | 517 | 444 | 463 | 465 | -30% | 25% | -13% |
| Tenn. | Macon | 300 | 236 | 307 | 314 | 283 | 308 | -21% | 31% | 3% |
| Tenn. | Polk | 181 | 147 | 147 | 149 | 144 | 125 | -19% | -15% | -31% |
| Tenn. | Shelby | 1,857 | 1,576 | 1,339 | 1,228 | 1,021 | 1,355 | -15% | -14% | -27% |
| Tenn. | Wayne | 152 | 124 | 121 | 128 | 138 | 134 | -18% | 8% | -12% |
| Tex. | Archer | 26 | 20 | 31 | 20 | 25 | 34 | -23% | 70% | 31% |
| Tex. | Bell | 869 | 623 | 815 | 1,028 | 1,222 | 1,281 | -28% | 106% | 47% |
| Tex. | Brown | 166 | 135 | 173 | 165 | 162 | 194* | -19% | 44% | 17% |
| Tex. | Calhoun | 78 | 64 | 73 | 83 | 77 | 69 | -18% | 8% | -12% |
| Tex. | Coleman | 33 | 32 | 40 | 35 | 37 | 38 | -3% | 19% | 15% |
| Tex. | Cooke | 163 | 148 | 155 | 145 | 148 | 150 | -9% | 1% | -8% |
| Tex. | DeWitt | 81 | 79 | 87 | 90 | 96 | 90 | -2% | 14% | 11% |
| Tex. | Ellis | 375 | 295 | 328 | 394 | 464 | 435 | -21% | 47% | 16% |
| Tex. | Erath | 80 | 45 | 73 | 55 | 95 | 79 | -44% | 76% | -1% |
| Tex. | Galveston | 997 | 697 | 862 | 987 | 1,020 | 1,028 | -30% | 47% | 3% |
| Tex. | Hopkins | 159 | 129 | 191 | 162 | 177 | 181 | -19% | 40% | 14% |
| Tex. | Jim Wells | 62 | 60 | 44 | 46 | 54 | 69 | -3% | 15% | 11% |
| Tex. | Lavaca | 27 | 17 | 15 | 11 | 23 | 26 | -37% | 53% | -4% |
| Tex. | Lubbock | 1,255 | 1,154 | 1,295 | 1,227 | 1,340 | 1,315* | -8% | 14% | 5% |
| Tex. | Parmer | 28 | 19 | 21 | 24 | 22 | 25 | -32% | 32% | -11% |
| Tex. | Polk | 188 | 143 | 193 | 193 | 207 | 224 | -24% | 57% | 19% |
| Tex. | Randall | 416 | 356 | 411 | 393 | 411 | 357 | -14% | 0% | -14% |
| Tex. | Rockwall | 226 | 184 | 236 | 188 | 208 | 189 | -19% | 3% | -16% |
| Tex. | Terry | 84 | 77 | 93 | 97 | 91 | 88 | -8% | 14% | 5% |
| Tex. | Titus | 133 | 82 | 101 | 79 | 93 | 88 | -38% | 7% | -34% |
| Tex. | Tom Green | 393 | 341 | 454 | 462 | 516 | 491 | -13% | 44% | 25% |
| Tex. | Wharton | 145 | 83 | 117 | 102 | 123 | 122 | -43% | 47% | -16% |
| Utah | Salt Lake | 2,144 | 1,356 | 1,215 | 1,489 | 1,725 | 1,724 | -37% | 27% | -20% |
| Va. | Blue Ridge Bedford | 100 | 81 | 98 | 88 | 93 | 82 | -19% | 2% | -18% |
| Va. | Blue Ridge Halifax | 180 | 184 | 164 | 183 | 40 | 149 | 2% | -19% | -17% |
| Va. | Blue Ridge Lynchburg | 470 | 397 | 415 | 491 | 516 | 299 | -15% | -25% | -36% |
| Va. | Chesapeake | 1,031 | 965 | 912 | 1,001 | 1,026 | 904 | -6% | -6% | -12% |
| Va. | Danville | 364 | 298 | 328 | 300 | 274 | 268 | -18% | -10% | -26% |
| Va. | Middle Peninsula | 178 | 144 | 161 | 168 | 159 | 147 | -19% | 2% | -17% |
| Va. | Middle River | 901 | 747 | 836 | 840 | 786 | 789 | -17% | 6% | -12% |
| Va. | Norfolk | 935 | 727 | 717 | 963 | 912 | 801 | -22% | 10% | -14% |
| Va. | Pamunkey | 391 | 265 | 406 | 444 | 400 | 362 | -32% | 37% | -7% |
| Va. | Riverside | 1,376 | 1,154* | 1,203* | 1,262* | 1,231* | 1,069 | -16% | -7% | -22% |
| Va. | Roanoke | 172 | 149 | 195 | 164 | 178 | 125 | -13% | -16% | -27% |
| Va. | Virginia Beach | 1,509 | 1,207* | 1,172* | 1,299 | 1,269 | 1,120 | -20% | -7% | -26% |
| Va. | Virginia Peninsula | 377 | 336 | 339 | 358 | 367 | 354 | -11% | 5% | -6% |
| Va. | Western Virginia | 944 | 765 | 808 | 811 | 848 | 789 | -19% | 3% | -16% |
| Wash. | Chelan | 197 | 141 | 160 | 135 | 125 | 101 | -28% | -28% | -49% |
| Wash. | Clallam Forks | 17 | 11 | 11 | 12 | 17 | 9 | -35% | -18% | -47% |
| Wash. | Clark | 663 | 364 | 429 | 432 | 353 | 350 | -45% | -4% | -47% |
| Wash. | Grays Harbor | 180 | 109 | 139 | 136 | 118 | 132 | -39% | 21% | -27% |
| Wash. | Grays Harbor Aberdeen | 22 | 9 | 9 | 10 | 11 | 10 | -59% | 11% | -55% |
| Wash. | Grays Harbor Hoquiam | 31 | 15 | 29 | 23 | 17 | 18 | -52% | 20% | -42% |
| Wash. | Island | 68 | 37 | 41 | 51 | 42 | 44 | -46% | 19% | -35% |
| Wash. | Jefferson | 30 | 21 | 29 | 15 | 25 | 23 | -30% | 10% | -23% |
| Wash. | King Issaquah | 57 | 19 | 30 | 39 | 28 | 38 | -67% | 100% | -33% |
| Wash. | Kitsap | 385 | 167 | 237 | 274 | 258 | 285 | -57% | 71% | -26% |
| Wash. | Klickitat | 40 | 19 | 40 | 40 | 40 | 38 | -53% | 100% | -5% |
| Wash. | Lewis | 192 | 106 | 167 | 189 | 151 | 139 | -45% | 31% | -28% |
| Wash. | Okanogan | 161 | 71 | 79 | 106 | 92 | 83 | -56% | 17% | -48% |
| Wash. | Skagit | 280 | 131 | 137 | 176 | 170 | 174 | -53% | 33% | -38% |
| Wash. | Skamania | 25 | 9 | 23 | 20 | 16 | 12 | -64% | 33% | -52% |
| Wash. | Snohomish | 747 | 336 | 443 | 403 | 464 | 399 | -55% | 19% | -47% |
| Wash. | Snohomish Lynnwood | 49 | 9 | 18 | 15 | 14 | 10 | -82% | 11% | -80% |
| Wash. | Snohomish Marysville | 35 | 4 | 7 | 14 | 24 | 10 | -89% | 150% | -71% |
| Wash. | Thurston Olympia | 23 | 13 | 13 | 7 | 12 | 18 | -43% | 38% | -22% |
| Wash. | Walla Walla | 89 | 66 | 72 | 80 | 52 | 46 | -26% | -30% | -48% |
| Wash. | Whatcom | 291 | 150 | 211 | 207 | 222 | 240 | -48% | 60% | -18% |
| Wash. | Whitman | 31 | 19 | 24 | 26 | 23 | 27 | -38% | 41% | -13% |
| Wash. | Yakima | 879 | 489 | 444 | 585 | 615 | 578 | -44% | 18% | -34% |
| Wis. | Brown | 719 | 634 | 587 | 652 | 660 | 663 | -12% | 5% | -8% |
| Wis. | Eau Claire | 275 | 168 | 168 | 186 | 213 | 173 | -39% | 3% | -37% |
| Wis. | La Crosse | 152 | 64 | 81 | 98 | 115 | 85 | -58% | 33% | -44% |
| Wis. | Lincoln | 105 | 61 | 74 | 80 | 66 | 53 | -42% | -13% | -50% |
| Wis. | Manitowoc | 209 | 180 | 161 | 131 | 211 | 166 | -14% | -8% | -21% |
| Wis. | Sawyer | 114 | 80 | 84 | 88 | 108 | 100 | -29% | 24% | -12% |
| Wyo. | Big Horn | 70 | 68 | 60 | 59 | 60 | 53 | -3% | -22% | -24% |
| Wyo. | Lincoln | 44 | 37 | 35 | 21 | 21 | 26 | -16% | -30% | -41% |
| Wyo. | Park | 42 | 31 | 26 | 33 | 42 | 44 | -26% | 42% | 5% |


