The company was fined $6 million for exploiting people leaving prison.

by Wanda Bertram, October 28, 2021

Last week, the Consumer Financial Protection Bureau fined JPay, a prison services provider, $6 million for exploiting people leaving prison. Below, we explain why the Bureau’s enforcement order against JPay — which builds on some arguments we made in 2015 — is a victory for criminal justice reform.

JPay is a private company widely known for selling video calls, emails and other technology to incarcerated people, but it has a less-well-known business providing pre-paid debit cards to incarcerated people upon release. This update concerns that last business.

We’ve previously discussed how a growing number of prisons force people leaving custody to receive money — such as wages earned inside, unused “trust account”1 balances, or small reentry stipends — on pre-paid debit cards riddled with high fees. The companies issuing these “release cards,” including JPay, have imposed fees for checking one’s account balance at an ATM, making a purchase, closing an account, and simply having an account at all, eating up formerly incarcerated people’s meager account balances.

The CFPB’s enforcement order against JPay will protect many people from these unreasonable and unjust fees going forward. The order takes four important steps:

  1. The order prevents JPay from charging any fees on release cards in the future, other than an “inactivity fee” that can only be triggered after someone does not use their account for 90 days. For JPay customers, the complex matrix of extraneous fees is now gone, hopefully forever (though the consent order does expire after five years).
  2. The order affirms that the CFPB has the jurisdiction to regulate release cards under the Electronic Fund Transfer Act, basically staking a claim for the Bureau to oversee JPay and other release-card issuers and take enforcement action when necessary. (In 2016, when the CFPB was conducting a rulemaking concerning prepaid cards, the Prison Policy Initiative brought the growing use of release cards to the agency’s attention.)
  3. The order clarifies that under the Electronic Fund Transfer Act, people being released from prison cannot be forced to receive “gate money” (stipends for reentry) on prepaid debit cards. Instead, people must be given multiple options for receiving gate money, such as a paper check or cash. The CFPB has previously noted that the same protection applies to wages earned in prison, but it’s not entirely clear how this works with accumulated wages that are paid out in a lump sum when someone leaves custody.
  4. The order spells out in detail how some of JPay’s business practices are unfair or abusive under the Dodd-Frank Act. This part of the order may prove critical for lawyers and activists fighting for further consumer protections for incarcerated people: Dodd-Frank prohibits unfair, deceptive, or abusive practices, but these are broad terms that need refinement, and the CFPB’s order provides that kind of refinement so that advocates can hone their strategies.

Readers who want further reading on this topic, particularly journalists, might find the following resources helpful:

Footnotes

  1. The term “trust account” is a term of art in the correctional sector, referring to a pooled bank account that holds funds for incarcerated people whose individual balances are sometimes treated as subaccounts. The term “trust” is used because the correctional facility typically holds the account as trustee, for the benefit of the individual beneficiaries (or subaccount holders).  ↩


A study by members of the New York University Prison Education Program Research Collective gives important first-hand accounts of the damage done when prisons shift financial costs to incarcerated people.

by Tommaso Bardelli, Zach Gillespie and Thuy Linh Tu, October 27, 2021

Note: We are pleased to present research from members of the New York University Prison Education Program Research Collective, a collaboration between faculty and formerly incarcerated students. Their research, based on interviews with 51 men who have been released from the New York State prison system, provides unique, first-hand accounts of how prisons are shifting more financial costs onto people who are incarcerated.

How much does it cost to take care of basic needs in prison? Our research team at New York University’s Prison Education Program set out to find an answer to this question. We looked not just for a specific dollar amount, but also at intangible human costs.

Going to jail or prison increasingly comes with a hefty price tag for the person who is incarcerated. As states continue to cut public spending, individuals are often expected to pay money to meet their basic needs in confinement facilities. Today, for instance, most states spend less than $4 per day to feed one incarcerated person—with some states like Alabama, Kansas, and West Virginia spending less than $2 per person. Such budgets are not enough to provide healthy and nutritious meals, so most people have no choice but to purchase extra food from the commissary store and/or to rely on care packages sent from home. At the same time that public expenditures have decreased, prison wages have stagnated, and the prices of food, phone calls, and other consumer items have increased. This has resulted in a greater economic burden on those individuals and families who can manage to absorb the costs, and a “surplus” (or exacerbation) of harm and punishment for those who cannot.

Our research team recently conducted interviews with fifty-one formerly incarcerated men in New York, all of whom had been released from state prisons in the last five years. The interviews provide a personal perspective on the ideology of fiscal austerity that has become commonplace in correctional administration. The people we interviewed also shed light on a dynamic that may surprise some readers: despite the common assumption that prisons are homogenous spaces, economic hierarchies do, in fact, exist inside. Our interviewees alluded to the concept of being “jail rich”(i.e., having access to some level of financial resources), and also discussed the significant portion of the prison population that cannot afford to pay for essential goods. Our research finds that a person’s inability to absorb the cost of fiscal austerity makes them more vulnerable to the harmful effects of a prison sentence, with consequences that are likely to last well after they have left prison.


A basic prison budget

While it is difficult to determine exactly how much it costs to cover basic needs inside a New York State facility, most of our interviewees estimated that they needed at least $175 per month to get by (translating to a minimum budget of $2,100 per year). With that sum, they explained, people can purchase just enough commissary food to integrate the paltry meals served by the facility, while also having some left to spend on other essentials, such as clothes, personal care products, and a few phone calls to family each month.

Average annual budget

Item/Category Amount Spent
Commissary $1,249
Tobacco $257
Clothes $130
Phone/Mail $1,972
Fines $110
Total $3,718


Family support

Since our respondents reported making on average less than $0.25 per hour, or about $31 per month, from in-prison employment, none could reach a monthly “living wage” without regular support from friends and family. Out of the fifty-one people we interviewed for this study, only eighteen said they could count on steady financial support from their loved ones, while twenty-two said they received some support but that it was not regular and/or not always sufficient to cover basic needs. Eleven participants reported receiving little to no support during most of their sentences. The experiences of the individuals with no financial resources are discussed in the following sections.

What kind of financial support did people receive from friends and family?

Support amount/frequency Number of respondents
Received steady support 18
Received irregular/insufficient support 22
Received little/no support 11


Food insecurity and health consequences

Hunger was the first thing most of our participants mentioned when talking about what it was like to be poor in prison. The food provided by the prison, everybody agreed, was insufficient, unhealthy, and sometimes inedible. To get by, people who had no external support invested the little money they earned from in-prison employment in a “survival kit” consisting of peanut butter, jelly, and a few ramen soups, which they would use to integrate—or at times replace—prison meals. These individuals were more likely to report health problems such as gastrointestinal diseases, foodborne illness, and drastic weight loss, as well as frequent headaches and chronic fatigue. Tim1, who was incarcerated for seven and a half years with little family support, for instance, remembered feeling constantly hungry during his last incarceration, to the point that he was often too weak or too ill to even leave his cell:

“When I was hungry, man, I had to lay—I just got to go and lay down. Because yeah you get, I got headaches, you know? I got headaches, I got cranky, I got moody, you know? Yeah, you get real moody when you want something to eat, believe me.”

Steven, who spent thirteen years in New York State prisons, said lack of access to food caused him to miss out on the few educational and training opportunities in the prison:

“I could never accomplish much while I was in there, he explained, because my stomach was always hurting, I could never get my body physically right. I was just deteriorating, day after day.”


Isolation from friends and family

While all incarcerated people experience dramatic disruption of social and intimate relationships, those who are unable to have regular contact with their loved ones during their prison sentence suffer its effects more acutely. Although costs of in-prison phone calls have significantly declined over the past decade—thanks to political action by families and to rate caps introduced by the Federal Communication Commission (FCC) – people who live off their wages from prison labor still cannot afford regular contact with family. Some of our participants reported speaking to family only a few times and receiving less than one visit per year during their incarceration. For many, the two free postage stamps provided by the facility each month offered the only means of communication with loved ones outside. Such an extreme and prolonged social disconnection is likely to heighten feelings of isolation and loneliness, and to negatively affects both people’s well-being inside carceral facilities and their re-entry after prison, when they must rely on family members for emotional and material support.

Monthly expenses for phone calls

Amount spent per month Number of respondents
$0 – 49 19
$50 – 99 6
$100 – 199 8
$200+ 16
N/A 2


Psychological consequences of prison poverty

Not being able to shop at commissary, or to regularly call home, can also affect how people experience the emotional and psychological harms of incarceration. Cooking their own meals or wearing their own clothes helps to counter some of the daily degradations of prison life. Having to continually eat unappetizing food or wear worn-out uniforms makes it harder to maintain a sense of self. Even more so than their peers, our interviewees who were indigent reported feeling stripped of their dignity and humanity by the prison system. For Steven, for instance, not being able to shop at commissary meant not just being constantly hungry, but also being unable to cook something nice on special occasions:

“I would not celebrate Thanksgiving, nor any other holiday. I don’t even celebrate holidays. I don’t celebrate New Year’s. I don’t celebrate any of that stuff, not in prison. I did no celebrating in prison. Every day was a living hell.”

For those with no access to personal resources, the inability to mitigate against material deprivation negatively affected their psychological well-being.


Conclusion

The carceral system has become even more unjust: incarcerated individuals have no access to gainful employment, and yet are required to pay for their basic necessities. While this system affects all incarcerated people, those who do not have the resources to cover basic needs experience its effects more acutely. Without regular access to commissary and telecommunications, people are more vulnerable to the negative health and psychological harms associated with a prison sentence. As a consequence, individuals and their families often face an impossible choice: drain the household’s resources to support their loved ones inside or leave them exposed to the most brutal forms of deprivation. This modern-day “prisoner’s dilemma” harms the well-being of the most disadvantaged people in prison and amplifies the negative impacts of incarceration far past the prison gate by draining financial resources from already vulnerable families and communities.


The authors are members of the New York University Prison Education Program Research Collective, a collaboration between faculty and formerly incarcerated students at NYU conducting research on the true costs of incarceration on families and communities in New York State.


Footnotes

  1. All names have been changed to protect the privacy of research participants  ↩


While some prison systems and local jails have maintained historically low populations, others have returned to pre-pandemic levels, despite the ongoing dangers of COVID-19.

by Emily Widra, October 21, 2021

This article was updated on February 10, 2022 with more recent jail and prison population data. That version should be used instead of this one.

The COVID-19 pandemic is far from over, particularly inside prisons and jails. The death rate from COVID-19 in prisons is more than double that of the general U.S. population.1 In state and federal prisons across the country, over 2,800 people have died of COVID-19 and almost 438,000 people in prison have been infected, and thousands of additional cases are linked to individual county jails. As the more contagious Delta variant ravages parts of the nation, public health officials continue to recommend prison population decreases as a primary method of risk reduction. Our data show that with just a few exceptions, state and local leaders are continuing to fail to reduce their prison and jail populations.

The federal Bureau of Prisons, state governments and departments of corrections, and local officials have a responsibility to protect the health and lives of those who are incarcerated. After 18 months of outbreak after outbreak in prisons and jails, it is clear correctional authorities must be held accountable for their failure to reduce their populations enough to prevent the illness and death of those who are incarcerated and in surrounding communities.

Prisons

Even in states where prison populations have dropped, there are still too many people behind bars to accommodate social distancing, effective isolation and quarantine, and increased health care requirements. For example, although California has reduced the state prison population by about 18% since the start of the pandemic, it has not been enough to prevent large COVID-19 outbreaks in the state’s prisons. In fact, as of October 6th, 2021, California’s prisons were still holding more people than they were designed for, at 112% of their design capacity (and up from 103% in January 2021). Considering the continued overcrowding in the California prison system, it’s not surprising that the state is responsible for seven out of the ten largest COVID-19 prison clusters.

line graph showing 50 state prison and federal prison population changes from March 2020 to October 2021 Figure 1. Prison population data for 50 states prison systems as reported directly from the state Departments of Correction and the Marshall Project and federal data as published weekly by the federal Bureau of Prisons. For the available population data for these 50 states and the Bureau of Prisons, see Appendix A.

Many states’ prison populations are the lowest they’ve been in decades, but this is not because more people are being released from prisons. The limited data available from eleven states shows that the average number of monthly prison releases have actually decreased since 2019.

bar graph showing 11 states with decreasing number of average monthly releases from 2019 to 2021 Figure 2. These eleven states published monthly release data for 2019, 2020, and the beginning of 2021. Although we cannot be certain that this analysis is representative of the other 39 state prison systems and the federal Bureau of Prisons, these data do show us a pattern of responses to the COVID-19 pandemic: fewer people have been released from these state prisons in response to COVID-19 in 2020 than in 2019, and, in 2021, prison releases are even lower than the two prior years.

Instead, data suggest most of the population drops we’ve seen over the past 18 months are due to reduced prison admissions, not increasing releases. In the ten states for which we have data, both admissions and releases have decreased in recent years, making clear that prisons are not using all available tools at their disposal to stop the spread of the virus in their facilities. Reducing the number of people admitted to correctional facilities is critical to reducing the number of people behind bars, but to quickly decarcerate, states should release far more people, too.

ten line graphs comparing monthly releases to admissions for ten state prison systems from 2018 to 2021 Figure 3. These ten states publish monthly release and admission data for 2018, 2019, 2020, and at least the first half of 2021. Although we cannot be certain that this analysis is representative of the other 40 state prison systems and the federal Bureau of Prisons, these data do show us a pattern of responses to the COVID-19 pandemic: reducing prison admissions, while releasing fewer people from prison.

Despite evidence that large-scale releases do not inherently endanger public safety, states have elected to release people from prison on a mostly case-by-case basis, which an October 2020 report from the National Academies described as “procedurally slow and not well suited to crisis situations.”

Thankfully, some states have recognized the inefficiency of case-by-case releases and the necessity of larger-scale releases. For example, in New Jersey, Governor Phil Murphy signed bill S2519 in October 2020, which allowed for the early release of people with less than a year left on their sentences. A few weeks after the bill was signed, more than 2,000 people were released from New Jersey state prisons on November 4th.2 In February 2021, North Carolina Governor Roy Cooper announced plans to release 3,500 people in state custody (with 1,500 of those releases to take place within 90 days). The releases were the result of a NAACP lawsuit challenging prison conditions in North Carolina during COVID-19. The state said it would release people using discretionary sentence credits (similar to “good time credits”), home confinement, and post-release supervision. But these are the only two instances we are aware of where large-scale release efforts are actually taking place in state prison systems.

Jails

Jail populations, like prison populations, are lower now than they were pre-pandemic. Initially, many local officials — including sheriffs, prosecutors, and judges — responded quickly to COVID-19 and reduced their jail populations. In a national sample of 415 county jails of varying sizes, most (88%) decreased their populations from March to July of 2020, resulting in an average change of a 24% population decrease across all 415 jails. These population reductions came as the result of various policy changes, including police issuing citations in lieu of arrests, prosecutors declining to charge people for “low-level offenses,” courts reducing cash bail amounts, and jail administrators releasing people detained pretrial or those serving short sentences for “nonviolent” offenses.

But later in the pandemic, those trends reversed. Between July 2020 and January 2021, the populations of 69% of the jails in our sample increased, reversing course from the earlier months of the pandemic. As of October 2021, 29% of the jails in our sample have higher populations now than they did in March 2020.3 Overall, the average population change across these 415 jails since March 2020 has diminished to only a 7% decrease, suggesting that the early reforms instituted to mitigate COVID-19 have largely been abandoned. For example, by mid-April 2020, the Philadelphia city jail population reportedly dropped by more than 17% after city police suspended low-level arrests and judges released “certain nonviolent detainees” jailed for “low-level charges.” But just two weeks later — as the pandemic raged on — the Philadelphia police force announced that they would resume arrests for property crimes, effectively reversing the earlier reduction efforts. Similarly, on July 10th, 2020, the sheriff of Jefferson County (Birmingham), Alabama, announced that the jail would limit admissions to only “violent felons that cannot make bond.” That effort was quickly abandoned when the jail resumed normal admission operations just one week later. The increasing jail populations across the country suggest that after the first wave of responses to COVID-19, many local officials have allowed jail admissions to return to business as usual.

line graph showing increasing jail population across 415 county jails after initial population drops in early 2020 Figure 4. Despite the continued dangers of COVID-19 and the Delta variant across the country, the number of people held in our sample of 415 county jails across the country has not continued to decrease over the past year, following initial reductions in early 2020. In fact, the data show a trend of jail populations slowly increasing. This graph contains aggregated data collected and provided by NYU’s Public Safety Lab and updates a graph in our June 2021 analysis. It includes all jails where the Lab was able to report data on March 10th and for at least 75% of the days in our research period, which ended October 7th, 2021. (Data are not available for all facilities for all days.) This graph presents the data as 7-day rolling averages, which smooths out most of the variations caused by individual facilities not reporting population data on particular days. The temporary population drops during the last weeks of May, August, and November 2020 and February 2021 and August 2021 are the result of more facilities than usual not being included in the dataset for various reasons, rather than any known policy changes. To see county level data for all 415 jails included in this analysis, see Appendix B.

In New York City, the jail population sharply declined after the pandemic was declared. Importantly, NYC jails – particularly Rikers Island – were some of the first jails in the country to witness a COVID-19 outbreak. And yet, across different demographics, NYC jail populations have slowly leveled out, suggesting that the policies responsible for the necessary decarceration are no longer in practice. In addition to suffering the effects of COVID-19, Rikers Island is also facing an unprecedented crisis following a history of over-incarceration and, according to a federal monitor, “decades of mismanagement.” At a time when jail populations should be at an all time low, Rikers Island’s confined population has surpassed the pre-COVID-19 population.

line graph showing increasing jail population across 415 county jails after initial population drops in early 2020 Figure 5. Graph showing the daily count of the NYC jail population by 5 key metrics. By all metrics, the NYC jail population dropped quickly at the start of the pandemic, but then started to rise again. As of July 29, 2021 the total NYC jail population was higher than before the pandemic. Critically, the number of people detained pretrial has actually grown — from 4,284 on January 1, 2020 to 5,152 people on October 1, 2021 — likely because of the rollback of significant bail reform efforts last year. The population drops in September 2021 are encouraging but are likely the consequence of Governor Hochul signing the Less is More Act, releasing people on technical violations from jail, and would therefore represent a helpful policy change that will reduce the population. However, the steep slope of the decline in September 2021 is unlikely to continue at that rate on its own without additional policy changes. Even with these reforms, the October 1st NYC jail population was only 3% below its pre-pandemic levels.
(Dotted lines connect periods with missing data, so the start of each dotted line and their bends represent specific historical data points.)

Even before COVID-19, prisons and jails were a threat to public health and considered notoriously dangerous places during any sort of viral outbreak. And yet, correctional facilities continue to be the source of a large number of infections in the U.S. The COVID-19 death rate in prisons is almost three times higher than among the general U.S. population, even when adjusted for age and sex (as the prison population is disproportionately young and male). Since the early days of the pandemic, public health professionals, corrections officials, and criminal justice reform advocates have agreed that decarceration is necessary to protect incarcerated people and the community at large from COVID-19. Decarceration efforts must include releasing more people from prisons and jails. Despite this knowledge, state, federal, and local authorities have failed to release people from prisons and jails on a scale sufficient to protect incarcerated people’s lives – and by extension, the lives of everyone in the communities where incarcerated people eventually return, and where correctional staff live and work.

Footnotes

  1. The COVID-19 death rate in prisons stands at a staggering 200 deaths per 100,000 incarcerated people, much higher than the death rate among the general U.S. population of 81 deaths per 100,000 residents. These rates, calculated by the UCLA COVID-19 Behind Bars Data Project, are adjusted to account for differences in age and sex between the prison population and the general U.S. population. For more details about how these rates were calculated, see “COVID-19 Incidence and Mortality in Federal and State Prisons Compared With the US Population, April 5, 2020, to April 3, 2021” published in JAMA.  ↩

  2. Unfortunately, this major victory for public health was immediately undercut by the federal Immigration and Custom Enforcement (ICE) agency which quickly arrested 88 people who were released under bill S2519. A spokesperson from ICE claimed that these 88 individuals were “violent offenders or have convictions for serious crimes such as homicide, aggravated assault, drug trafficking and child sexual exploitation.” However, these claims are brought into question when considering that the releases that took place under bill S2519 specifically excluded “people serving time for murder or sexual assault” and those serving time for sexual offenses. Although we did not include ICE facilities in our analysis, there is evidence that ICE detention facilities have a COVID-19 case rate that is up to 13 times higher than that of the general U.S. population.  ↩

  3. 129 jails (29% of our sample) have higher populations now than they had before COVID-19. Some of those jails include large county jails with more than 500 people, including Wayne County, MI, Lubbock and Galveston Counties, TX, and St. Lucie County, FL.  ↩

Appendix A: State and federal prison populations during COVID‑19

Prison populations for the federal Bureau of Prisons and all 50 state prison systems from January 2020 to October 2021. When available, we used point-in-time population counts from the last day of the month. If that data point was not available, we then used either the monthly average daily population (ADP) or the point-in-time population count for latest date available in each month.

January 2020 February 2020 March 2020 April 2020 May 2020 June 2020 July 2020 August 2020 September 2020 October 2020 November 2020 December 2020 January 2021 February 2021 March 2021 April 2021 May 2021 June 2021 July 2021 August 2021 September 2021 October 2021 Sources
Alabama 21,114 20,655 19,752 19,342 18,901 18,693 18,262 17,914 17,725 17,454 17,308 17,134 17,051 16,792 17,189 17,724 The Marshall Project & DOC Monthly Reports
Alaska 4,776 4,277 4,216 4,334 4,414 4,511 4,586 4,581 4,559 4,523 4,505 4,493 4,478 4,487 The Marshall Project
Arizona 42,360 41,777 40,529 39,339 39,153 38,894 38,495 38,141 37,731 37,396 36,975 36,704 36,569 36,266 35,954 35,746 35,489 35,410 The Marshall Project & DOC monthly capacity reports
Arkansas 17,989 18,181 17,860 17,331 16,694 16,552 16,511 16,367 16,215 16,311 16,165 16,094 16,119 16,120 16,085 16,250 16,476 16,560 16,638 DOC monthly director’s board reports
California 117,454 117,639 113,632 111,072 109,800 102,715 97,342 94,852 94,433 94,179 92,350 91,341 91,516 92,079 92,836 94,103 95,107 95,809 96,194 95,950 The Marshall Project & CDCR weekly population reports
Colorado 17,585 16,382 15,807 15,531 15,022 14,935 14,673 14,257 13,687 13,558 13,556 13,553 13,537 13,650 13,730 13,968 14,042 14,009 The Marshall Project & DOC end-of-month population reports
Connecticut 12,381 12,290 11,454 10,640 10,206 9,645 9,545 9,391 9,348 9,233 9,111 9,053 9,100 9,039 9,011 8,947 The Marshall Project & DOC monthly reports
Delaware 5,042 4,624 4,233 4,195 4,216 4,322 4,457 4,168 4,358 4,677 4,360 4,326 4,269 4,267 The Marshall Project
Federal 163,886 163,498 157,340 145,399 143,071 140,970 140,540 139,446 138,776 137,084 137,361 137,260 137,686 137,633 138,394 138,773 140,295 140,627 140,518 BOP weekly population report
Florida 93,764 91,828 88,305 85,839 84,601 82,997 82,027 81,795 79,523 79,322 79,476 79,660 80,298 The Marshall Project
Georgia 55,019 53,642 51,213 50,446 49,848 49,365 48,433 48,132 47,703 47,027 46,530 46,309 46,195 44,540 46,296 47,147 47,092 47,334 47,405 The Marshall Project & DOC weekly repors
Hawaii 5,208 4,836 4,260 4,311 4,404 4,508 4,162 4,140 4,184 4,183 4,171 4,200 4,153 4,117 4,084 4,134 4,104 4,113 4,149 4,134 The Marshall Project & DPS monthly reports
Idaho 7,816 7,641 7,798 7,626 7,426 7,155 7,496 7,407 7,343 7,461 7,827 7,921 7,878 The Marshall Project
Illinois 36,931 34,668 31,945 31,195 31,002 30,651 30,001 29,225 29,151 28,160 27,503 27,313 27,313 The Marshall Project
Indiana 26,952 26,891 26,936 26,418 25,385 25,385 25,023 24,513 24,350 24,203 23,978 23,726 23,745 23,745 23,769 23,554 23,510 23,464 23,435 23,388 The Marshall Project & DOC monthly reports
Iowa 8,474 8,533 8,401 8,515 7,600 7,493 7,362 7,395 7,415 7,441 7,542 7,489 7,554 7,627 7,673 7,680 7,717 7,741 7,790 7,852 The Marshall Project & DOC daily statistics
Kansas 9,804 9,673 9,091 8,735 8,580 8,486 8,414 8,408 8,574 8,665 8,719 8,745 8,682 8,650 8,556 8,530 8,445 8,457 The Marshall Project & DOC end-of-month reports
Kentucky 12,306 12,162 11,782 11,549 11,272 11,002 10,589 10,391 10,242 10,151 9,854 9,706 9,655 9,625 9,708 9,899 9,930 9,967 10,084 9,990 The Marshall Project & DOC daily count sheets
Louisiana 15,019 15,067 15,066 14,967 14,775 14,623 14,443 14,313 14,241 14,134 14,052 13,903 13,822 13,722 13,724 13,546 13,522 The Marshall Project & DOC population trends report
Maine 2,176 2,138 2,019 1,922 1,828 1,788 1,783 1,779 1,766 1,718 1,712 1,695 1,679 1,672 1,661 1,603 1,607 1,614 1,609 1,597 The Marshall Project & DOC monthly reports
Massachusetts 7,958 7,950 7,969 7,626 7,260 7,125 7,033 6,973 6,891 6,778 6,729 6,609 6,570 6,524 6,374 6,363 6,318 6,303 6,268 6,180 6,165 The Marshall Project & DOC weekly counts
Michigan 37,687 35,798 34,973 34,561 34,330 34,134 33,917 33,617 33,370 33,185 32,962 32,822 32,698 The Marshall Project
Minnesota 9,381 8,904 8,718 8,402 8,330 7,736 7,674 7,549 7,427 7,315 7,327 7,342 7,228 7,251 7,369 The Marshall Project & DOC population summary reports
Mississippi 19,147 19,031 18,886 17,794 18,045 17,651 17,448 17,390 17,288 17,274 17,224 17,118 17,137 17,070 17,099 17,225 17,267 17,264 17,318 17,275 17,162 17,155 The Marshall Project & DOC daily population reports
Missouri 25,740 25,133 24,000 23,877 23,777 23,602 23,554 23,397 23,106 23,037 22,783 22,939 23,044 23,057 The Marshall Project
Montana 4,508 4,318 3,962 3,907 3,886 3,812 3,746 3,709 3,620 3,686 3,762 3,782 3,858 3,908 The Marshall Project
Nebraska 5,621 5,539 5,384 5,307 5,272 5,297 5,296 5,308 5,275 5,265 5,302 5,320 5,301 5,363 The Marshall Project
Nevada 12,379 12,403 12,384 12,152 11,937 11,231 11,696 11,696 11,354 11,273 11,222 11,134 11,007 10,926 10,841 10,777 10,640 10,505 10,429 10,260 The Marshall Project & DOC weekly fact sheets
New Hampshire 2,433 2,359 2,256 2,228 2,209 2,203 2,184 2,155 2,136 2,107 2,071 2,053 2,030 2,016 The Marshall Project
New Jersey 18,439 17,958 16,613 15,866 15,480 15,380 12,800 11,463 11,434 11,128 10,962 10,875 10,722 The Marshall Project
New Mexico 6,573 6,588 6,328 6,175 6,159 6,040 6,012 5,847 5,817 5,772 5,710 5,731 5,708 The Marshall Project
New York 42,784 40,956 38,723 37,559 37,053 36,528 35,983 35,353 34,446 33,376 32,384 31,412 31,456 31,890 The Marshall Project
North Carolina 29,023 34,256 33,790 31,485 31,471 31,341 30,657 30,278 29,321 28,714 28,679 28,746 28,765 29,415 29,165 28,687 The Marshall Project & DPS population reports
North Dakota 1,254 1,519 1,321 1,247 1,237 1,185 1,191 1,235 1,211 1,293 1,351 1,384 1,368 The Marshall Project
Ohio 48,697 48,765 48,927 47,620 46,212 45,876 44,972 44,536 44,598 44,441 44,027 43,665 43,495 43,246 43,005 43,014 43,046 42,963 43,080 43,134 43,056 The Marshall Project & DRC weekly population count reports
Oklahoma 25,055 25,039 24,956 24,395 23,891 22,875 22,201 21,980 21,769 21,747 21,678 21,778 21,718 21,665 21,670 21,772 21,725 21,615 21,601 21,597 21,398 21,353 The Marshall Project & DOC weekly counts
Oregon 14,483 12,593 14,459 14,407 14,351 14,055 13,721 13,507 13,484 13,306 13,149 12,989 12,742 12,593 12,404 12,322 12,190 12,098 12,068 12,067 12,045 12,097 The Marshall Project & DOC population trend report
Pennsylvania 47,579 47,382 46,559 45,251 44,556 43,916 43,204 41,964 41,438 41,140 40,786 40,403 40,088 39,499 39,296 39,080 38,868 38,998 38,950 36,979 36,954 36,740 The Marshall Project & DOC monthly population reports
Rhode Island 2,601 2,664 2,674 2,275 2,198 2,180 2,200 2,211 2,184 2,233 2,179 2,076 2,118 2,150 2,120 2,078 2,125 2,118 The Marshall Project & DOC monthly reports
South Carolina 18,106 18,074 18,028 18,229 17,687 17,455 17,224 16,361 16,121 16,230 15,806 16,013 15,676 15,720 15,586 15,548 15,213 15,420 15,458 15,171 15,275 15,408 DOC daily population counts
South Dakota 3,790 3,833 3,701 3,546 3,580 3,367 3,309 3,258 3,235 3,205 3,205 3,159 3,145 3,174 3,180 3,181 3,228 3,339 3,381 3,418 The Marshall Project & DOC monthly reports
Tennessee 21,826 21,793 21,616 21,150 20,394 20,079 19,249 19,279 19,143 19,566 19,605 19,453 19,510 19,433 19,687 19,687 20,537 20,502 20,429 20,485 20,098 The Marshall Project & DOC monthly reports
Texas 119,541 140,124 135,833 127,200 124,181 121,128 120,709 122,177 121,876 120,873 117,843 117,491 116,926 117,838 The Marshall Project
Utah 6,900 6,441 5,993 5,915 5,824 5,814 5,898 5,496 5,485 5,485 5,581 5,602 5,663 5,728 The Marshall Project
Vermont 1,656 1,406 1,395 1,417 1,390 1,417 1,413 1,369 1,380 1,292 1,281 1,272 1,238 1,228 1,395 1,285 1,291 1,300 1,322 The Marshall Project & DOC daily population reports
Virginia 29,233 29,208 29,161 28,559 27,871 28,595 26,749 26,190 25,659 25,156 24,731 24,235 23,811 23,644 23,796 23,897 23,966 24,229 24,467 24,625 The Marshall Project & DOC monthly reports
Washington 18,998 19,151 18,797 17,587 16,906 16,703 15,313 15,185 15,093 14,900 14,682 14,518 14,312 14,064 13,875 13,693 13,497 13,380 13,348 DOC monthly population reports
West Virginia 5,952 5,556 4,898 4,398 4,331 4,275 4,247 4,189 3,977 3,987 3,962 4,053 4,071 4,425 The Marshall Project
Wisconsin 23,349 23,251 23,591 22,507 21,788 21,576 21,252 21,312 21,136 21,495 20,494 20,137 20,033 19,513 19,452 19,301 19,271 19,380 19,548 19,796 20,070 20,142 The Marshall Project & DOC weekly population counts
Wyoming 2,156 2,098 2,001 1,986 1,959 1,996 2,232 2,157 2,134 2,133 2,252 The Marshall Project

Appendix B: County jail populations during COVID-19

This table shows the jail populations for 415 county jails where data was available where data was available for March 10th (the day the pandemic was declared) and for 75% of the days between March 10th, 2020 and October 7, 2021. (This table is a subset of the population data available for over 1,000 local jails from the NYU Public Safety Lab Jail Data Initiative.)

County State March 2020 population July 2020 population January 2021 population July 2021 population Most recent population Date of March 2020 population Date of July 2020 population Date of January 2021 population Date of July 2021 population Date of most recent population Percent change from March 2020 to July 2020 Percent change from July 2020 to January 2021 Percent change from January 2021 to July 2021 Percent change from July 2021 to most recent population Net percent change from March 2020 to most recent population
Autauga Ala. 172 170 187 158 157 3/10/20 7/6/20 1/4/21 7/5/21 10/7/21 -1% 10% -16% -1% -9%
Chilton Ala. 212 184 196 198 211 3/10/20 7/6/20 1/4/21 7/5/21 10/7/21 -13% 7% 1% 7% 0%
Clay Ala. 39 34 36 60 56 3/10/20 7/6/20 1/4/21 7/5/21 10/7/21 -13% 6% 67% -7% 44%
Cleburne Ala. 84 61 59 70 56 3/10/20 7/6/20 1/4/21 7/5/21 10/7/21 -27% -3% 19% -20% -33%
Coffee Ala. 127 76 89 146 125 3/10/20 7/6/20 1/4/21 7/5/21 10/7/21 -40% 17% 64% -14% -2%
Coosa Ala. 27 32 21 32 43 3/10/20 7/6/20 1/4/21 7/5/21 10/7/21 19% -34% 52% 34% 59%
Dale Ala. 75 69 83 90 69 3/10/20 7/6/20 1/4/21 7/5/21 10/7/21 -8% 20% 8% -23% -8%
DeKalb Ala. 169 164 155 192 131 3/10/20 7/6/20 1/4/21 7/5/21 10/7/21 -3% -5% 24% -32% -22%
Houston Ala. 394 324 386 377 328 3/10/20 7/6/20 1/4/21 8/1/21 10/7/21 -18% 19% -2% -13% -17%
Jackson Ala. 177 184 205 184 175 3/10/20 7/6/20 1/4/21 7/5/21 10/7/21 4% 11% -10% -5% -1%
Marion Ala. 131 139 157 160 121 3/10/20 7/6/20 1/4/21 7/5/21 10/7/21 6% 13% 2% -24% -8%
Morgan Ala. 617 556 561 635 573 3/10/20 7/6/20 1/4/21 8/19/21 10/14/21 -10% 1% 13% -10% -7%
Pike Ala. 63 34 58 70 75 3/10/20 7/6/20 1/4/21 7/5/21 10/7/21 -46% 71% 21% 7% 19%
Randolph Ala. 64 49 55 73 69 3/10/20 7/6/20 1/4/21 7/5/21 10/7/21 -23% 12% 33% -5% 8%
St Clair Ala. 222 229 196 235 229 3/10/20 7/6/20 1/4/21 7/5/21 10/7/21 3% -14% 20% -3% 3%
Talladega Ala. 301 225 303 365 323 3/10/20 7/6/20 1/4/21 7/5/21 10/7/21 -25% 35% 20% -12% 7%
Washington Ala. 58 39 27 71 86 3/10/20 7/6/20 1/4/21 7/5/21 10/7/21 -33% -31% 163% 21% 48%
Yavapai Ariz. 537 448 456 545 538 3/10/20 7/6/20 1/4/21 7/5/21 10/7/21 -17% 2% 20% -1% 0%
Yuma Ariz. 432 370 461 489 447 3/10/20 7/6/20 1/4/21 7/5/21 10/7/21 -14% 25% 6% -9% 3%
Baxter Ark. 121 87 117 124 143 3/10/20 7/6/20 1/4/21 7/5/21 10/7/21 -28% 34% 6% 15% 18%
Crawford Ark. 217 166 246 205 280 3/10/20 7/6/20 1/4/21 7/5/21 10/7/21 -24% 48% -17% 37% 29%
Franklin Ark. 36 24 76 78 89 3/10/20 7/6/20 1/4/21 7/5/21 10/7/21 -33% 217% 3% 14% 147%
Howard Ark. 41 15 21 35 35 3/10/20 7/6/20 1/4/21 7/5/21 10/7/21 -63% 40% 67% 0% -15%
Johnson Ark. 64 37 56 79 89 3/10/20 7/6/20 1/4/21 7/5/21 10/7/21 -42% 51% 41% 13% 39%
Marion Ark. 42 22 56 83 70 3/10/20 7/6/20 1/4/21 7/5/21 10/7/21 -48% 155% 48% -16% 67%
Nevada Ark. 56 33 52 56 60 3/10/20 7/6/20 1/4/21 7/5/21 10/7/21 -41% 58% 8% 7% 7%
Poinsett Ark. 81 49 73 80 86 3/10/20 7/6/20 1/4/21 7/5/21 10/7/21 -40% 49% 10% 8% 6%
Pope Ark. 193 135 155 202 156 3/10/20 7/6/20 1/4/21 7/5/21 10/7/21 -30% 15% 30% -23% -19%
Saline Ark. 235 131 189 223 215 3/10/20 7/6/20 1/4/21 7/5/21 10/7/21 -44% 44% 18% -4% -9%
Stone Ark. 36 39 23 52 35 3/10/20 7/6/20 1/4/21 7/5/21 10/7/21 8% -41% 126% -33% -3%
Union Ark. 199 137 152 182 189 3/10/20 7/6/20 1/4/21 7/5/21 10/7/21 -31% 11% 20% 4% -5%
Van Buren Ark. 78 29 36 75 69 3/10/20 7/6/20 1/4/21 7/5/21 10/7/21 -63% 24% 108% -8% -12%
Washington Ark. 679 407 547 591 673 3/10/20 7/6/20 1/4/21 7/5/21 10/7/21 -40% 34% 8% 14% -1%
White Ark. 287 80 202 277 278 3/10/20 7/6/20 1/4/21 7/5/21 10/7/21 -72% 153% 37% 0% -3%
El Dorado Calif. 390 325 339 288 306 3/10/20 7/6/20 1/4/21 7/5/21 10/7/21 -17% 4% -15% 6% -22%
Shasta Calif. 379 476 432 376 377 3/10/20 7/6/20 1/4/21 7/5/21 10/7/21 26% -9% -13% 0% -1%
Siskiyou Calif. 94 80 72 85 77 3/10/20 7/6/20 1/4/21 7/5/21 10/7/21 -15% -10% 18% -9% -18%
Stanislaus Calif. 1,357 1,060 1,138 1,216 1,327 3/10/20 7/7/20 1/4/21 7/5/21 10/7/21 -22% 7% 7% 9% -2%
Tulare Calif. 1,571 1,196 1,377 1,471 1,443 3/10/20 7/6/20 1/4/21 7/5/21 10/7/21 -24% 15% 7% -2% -8%
Yuba Calif. 385 219 237 206 207 3/10/20 7/6/20 1/4/21 7/5/21 10/7/21 -43% 8% -13% 0% -46%
Arapahoe Colo. 1,134 682 770 738 831 3/10/20 7/6/20 1/4/21 7/5/21 10/7/21 -40% 13% -4% 13% -27%
Bent Colo. 55 31 75 50 69 3/10/20 7/6/20 1/4/21 7/5/21 10/7/21 -44% 142% -33% 38% 25%
Boulder Colo. 652 411 407 455 484 3/10/20 7/6/20 1/4/21 7/5/21 10/7/21 -37% -1% 12% 6% -26%
Douglas Colo. 341 216 242 283 333 3/10/20 7/6/20 1/4/21 7/5/21 10/7/21 -37% 12% 17% 18% -2%
Jefferson Colo. 1,265 633 790 998 1,060 3/10/20 7/6/20 1/4/21 7/5/21 10/7/21 -50% 25% 26% 6% -16%
Pueblo Colo. 646 387 410 457 517 3/10/20 7/6/20 1/4/21 7/5/21 10/7/21 -40% 6% 11% 13% -20%
Alachua Fla. 735 667 808 783 813 3/10/20 7/6/20 1/4/21 7/5/21 10/7/21 -9% 21% -3% 4% 11%
DeSoto Fla. 147 161 165 154 172 3/10/20 7/6/20 1/4/21 7/5/21 10/7/21 10% 2% -7% 12% 17%
Flagler Fla. 205 176 199 202 194 3/10/20 7/6/20 1/4/21 7/5/21 10/7/21 -14% 13% 2% -4% -5%
Lake Fla. 21 12 21 22 20 3/10/20 7/6/20 1/4/21 7/5/21 10/7/21 -43% 75% 5% -9% -5%
Monroe Fla. 514 394 456 477 513 3/10/20 7/6/20 1/4/21 7/5/21 10/7/21 -23% 16% 5% 8% 0%
Nassau Fla. 243 172 232 220 243 3/10/20 7/6/20 1/4/21 7/5/21 10/7/21 -29% 35% -5% 10% 0%
Sarasota Fla. 872 781 943 918 910 3/10/20 7/6/20 1/4/21 7/5/21 10/7/21 -10% 21% -3% -1% 4%
St Lucie Fla. 1,301 1,221 1,314 1,333 1,363 3/10/20 7/6/20 1/4/21 7/5/21 10/7/21 -6% 8% 1% 2% 5%
Walton Fla. 436 404 448 442 460 3/10/20 7/6/20 1/4/21 7/5/21 10/7/21 -7% 11% -1% 4% 6%
Bartow Ga. 673 531 557 577 583 3/10/20 7/6/20 1/4/21 7/5/21 10/7/21 -21% 5% 4% 1% -13%
Berrien Ga. 98 69 86 83 79 3/10/20 7/6/20 1/4/21 8/1/21 10/7/21 -30% 25% -3% -5% -19%
Brantley Ga. 122 124 110 108 88 3/10/20 7/6/20 1/4/21 8/1/21 10/7/21 2% -11% -2% -19% -28%
Bulloch Ga. 343 255 336 358 371 3/10/20 7/6/20 1/4/21 7/5/21 10/7/21 -26% 32% 7% 4% 8%
Burke Ga. 106 93 108 102 117 3/10/20 7/6/20 1/4/21 7/5/21 10/7/21 -12% 16% -6% 15% 10%
Camden Ga. 112 132 139 150 131 3/10/20 7/6/20 1/4/21 7/5/21 10/7/21 18% 5% 8% -13% 17%
Carroll Ga. 444 302 362 546 426 3/10/20 7/6/20 1/4/21 7/5/21 10/7/21 -32% 20% 51% -22% -4%
Columbia Ga. 276 182 203 262 287 3/10/20 7/6/20 1/4/21 7/5/21 10/7/21 -34% 12% 29% 10% 4%
Decatur Ga. 117 117 145 123 110 3/10/20 7/6/20 1/4/21 7/5/21 10/7/21 0% 24% -15% -11% -6%
Dodge Ga. 123 116 117 128 135 3/10/20 7/6/20 1/4/21 7/5/21 10/7/21 -6% 1% 9% 5% 10%
Dougherty Ga. 586 415 541 537 573 3/10/20 7/6/20 1/4/21 7/5/21 10/7/21 -29% 30% -1% 7% -2%
Douglas Ga. 683 344 384 676 576 3/10/20 7/6/20 1/4/21 7/5/21 10/7/21 -50% 12% 76% -15% -16%
Effingham Ga. 237 142 150 224 214 3/10/20 7/6/20 1/4/21 7/5/21 10/7/21 -40% 6% 49% -4% -10%
Elbert Ga. 95 48 78 64 68 3/10/20 7/6/20 1/4/21 7/5/21 10/7/21 -49% 63% -18% 6% -28%
Fayette Ga. 205 127 189 276 244 3/10/20 7/6/20 1/4/21 7/5/21 10/7/21 -38% 49% 46% -12% 19%
Floyd Ga. 645 472 520 608 529 3/10/20 7/6/20 1/4/21 7/5/21 10/7/21 -27% 10% 17% -13% -18%
Gordon Ga. 290 240 262 224 241 3/10/20 7/6/20 1/4/21 7/5/21 10/7/21 -17% 9% -15% 8% -17%
Habersham Ga. 164 114 128 114 118 3/10/20 7/6/20 1/4/21 7/5/21 10/7/21 -30% 12% -11% 4% -28%
Haralson Ga. 184 117 182 142 113 3/10/20 7/6/20 1/4/21 7/5/21 10/7/21 -36% 56% -22% -20% -39%
Jackson Ga. 143 112 181 174 134 3/10/20 7/6/20 1/4/21 7/5/21 10/7/21 -22% 62% -4% -23% -6%
Lamar Ga. 58 38 44 66 67 3/10/20 7/6/20 1/4/21 7/5/21 10/7/21 -34% 16% 50% 2% 16%
Laurens Ga. 337 285 296 298 317 3/10/20 7/6/20 1/4/21 7/5/21 10/7/21 -15% 4% 1% 6% -6%
Liberty Ga. 209 176 194 196 167 3/10/20 7/6/20 1/4/21 7/5/21 10/7/21 -16% 10% 1% -15% -20%
Monroe Ga. 128 102 145 135 142 3/10/20 7/6/20 1/4/21 7/5/21 10/7/21 -20% 42% -7% 5% 11%
Oconee Ga. 28 23 19 33 38 3/10/20 7/6/20 1/4/21 7/5/21 10/7/21 -18% -17% 74% 15% 36%
Pickens Ga. 77 85 93 102 84 3/10/20 7/6/20 1/4/21 7/5/21 10/7/21 10% 9% 10% -18% 9%
Polk Ga. 179 158 122 188 169 3/10/20 7/6/20 1/4/21 7/5/21 10/7/21 -12% -23% 54% -10% -6%
Rabun Ga. 108 61 70 100 90 3/10/20 7/6/20 1/4/21 7/5/21 10/7/21 -44% 15% 43% -10% -17%
Richmond Ga. 1,033 905 950 957 994 3/10/20 7/6/20 1/4/21 7/5/21 10/7/21 -12% 5% 1% 4% -4%
Spalding Ga. 388 260 340 391 473 3/10/20 7/6/20 1/4/21 7/5/21 10/7/21 -33% 31% 15% 21% 22%
Sumter Ga. 159 129 152 165 153 3/10/20 7/6/20 1/4/21 7/5/21 10/7/21 -19% 18% 9% -7% -4%
Tattnall Ga. 86 36 74 87 83 3/10/20 7/6/20 1/4/21 7/5/21 10/7/21 -58% 106% 18% -5% -3%
Tift Ga. 229 217 240 277 253 3/10/20 7/6/20 1/4/21 7/5/21 10/7/21 -5% 11% 15% -9% 10%
Turner Ga. 67 61 64 76 52 3/10/20 7/6/20 1/4/21 7/5/21 10/7/21 -9% 5% 19% -32% -22%
Union Ga. 52 39 46 42 53 3/10/20 7/6/20 1/4/21 7/5/21 8/19/21 -25% 18% -9% 26% 2%
Upson Ga. 104 59 88 124 131 3/10/20 7/6/20 1/4/21 7/5/21 10/7/21 -43% 49% 41% 6% 26%
Ware Ga. 421 340 418 436 397 3/10/20 7/6/20 1/4/21 7/5/21 10/7/21 -19% 23% 4% -9% -6%
Washington Ga. 79 76 94 94 95 3/10/20 7/6/20 1/4/21 7/5/21 10/7/21 -4% 24% 0% 1% 20%
Whitfield Ga. 486 336 408 405 323 3/10/20 7/6/20 1/4/21 7/5/21 10/7/21 -31% 21% -1% -20% -34%
Worth Ga. 69 86 83 103 77 3/10/20 7/6/20 1/4/21 7/5/21 10/7/21 25% -3% 24% -25% 12%
Blaine Idaho 67 52 14 16 16 3/10/20 7/6/20 1/4/21 7/5/21 10/7/21 -22% -73% 14% 0% -76%
Bonneville Idaho 392 275 254 299 283 3/10/20 7/6/20 1/4/21 7/5/21 10/7/21 -30% -8% 18% -5% -28%
Canyon Idaho 446 384 400 364 379 3/10/20 7/6/20 1/4/21 7/5/21 10/7/21 -14% 4% -9% 4% -15%
Nez Perce Idaho 126 76 86 94 75 3/10/20 7/6/20 1/4/21 7/5/21 10/7/21 -40% 13% 9% -20% -40%
Power Idaho 15 13 7 10 10 3/10/20 7/6/20 1/4/21 7/5/21 10/7/21 -13% -46% 43% 0% -33%
Washington Idaho 40 39 32 43 38 3/10/20 7/6/20 1/4/21 7/5/21 10/7/21 -3% -18% 34% -12% -5%
Kendall Ill. 157 137 144 134 148 3/10/20 7/6/20 1/4/21 7/5/21 10/7/21 -13% 5% -7% 10% -6%
Macon Ill. 300 261 306 265 321 3/10/20 7/6/20 1/4/21 7/5/21 10/7/21 -13% 17% -13% 21% 7%
Randolph Ill. 25 24 27 28 22 3/10/20 7/6/20 1/4/21 7/5/21 10/7/21 -4% 13% 4% -21% -12%
Will Ill. 693 583 640 566 601 3/10/20 7/6/20 1/4/21 7/5/21 10/7/21 -16% 10% -12% 6% -13%
Woodford Ill. 52 56 67 58 74 3/10/20 7/6/20 1/4/21 7/5/21 10/7/21 8% 20% -13% 28% 42%
Dearborn Ind. 233 253 271 274 251 3/10/20 7/6/20 1/4/21 7/5/21 10/7/21 9% 7% 1% -8% 8%
Hamilton Ind. 298 229 270 297 310 3/10/20 7/6/20 1/4/21 7/5/21 10/7/21 -23% 18% 10% 4% 4%
Hendricks Ind. 266 205 187 251 244 3/10/20 7/6/20 1/4/21 7/5/21 10/6/21 -23% -9% 34% -3% -8%
Jackson Ind. 250 173 189 232 236 3/10/20 7/6/20 1/4/21 7/5/21 10/7/21 -31% 9% 23% 2% -6%
Starke Ind. 119 93 97 115 121 3/10/20 7/6/20 1/4/21 7/5/21 10/7/21 -22% 4% 19% 5% 2%
Buena Vista Iowa 23 7 13 18 10 3/10/20 7/9/20 1/4/21 7/5/21 10/7/21 -70% 86% 38% -44% -57%
Cerro Gordo Iowa 69 41 53 65 67 3/10/20 7/6/20 1/4/21 7/5/21 10/7/21 -41% 29% 23% 3% -3%
Clinton Iowa 59 35 53 59 78 3/10/20 7/6/20 1/4/21 7/5/21 10/7/21 -41% 51% 11% 32% 32%
Dallas Iowa 28 36 46 42 57 3/10/20 7/6/20 1/4/21 7/5/21 10/7/21 29% 28% -9% 36% 104%
Dickinson Iowa 13 8 6 5 4 3/10/20 7/6/20 1/4/21 7/5/21 10/7/21 -38% -25% -17% -20% -69%
Hardin Iowa 85 79 45 54 50 3/10/20 7/6/20 1/4/21 7/5/21 10/7/21 -7% -43% 20% -7% -41%
Polk Iowa 896 546 737 821 797 3/10/20 7/6/20 1/4/21 7/5/21 10/7/21 -39% 35% 11% -3% -11%
Scott Iowa 449 242 257 215 224 3/10/20 7/6/20 1/4/21 7/5/21 10/7/21 -46% 6% -16% 4% -50%
Story Iowa 73 25 66 42 60 3/10/20 7/6/20 1/4/21 7/5/21 10/7/21 -66% 164% -36% 43% -18%
Brown Kans. 12 14 19 20 15 3/10/20 7/6/20 1/4/21 7/5/21 10/7/21 17% 36% 5% -25% 25%
Crawford Kans. 76 50 67 87 114 3/10/20 7/6/20 1/4/21 7/5/21 10/7/21 -34% 34% 30% 31% 50%
Dickinson Kans. 20 16 6 17 19 3/10/20 7/6/20 1/4/21 7/5/21 10/7/21 -20% -63% 183% 12% -5%
Doniphan Kans. 9 8 8 9 10 3/10/20 7/6/20 1/4/21 7/5/21 10/7/21 -11% 0% 13% 11% 11%
Finney Kans. 95 88 58 96 90 3/10/20 7/6/20 1/4/21 7/5/21 10/7/21 -7% -34% 66% -6% -5%
Geary Kans. 101 78 88 93 90 3/10/20 7/6/20 1/4/21 7/5/21 10/7/21 -23% 13% 6% -3% -11%
Jackson Kans. 83 55 68 58 74 3/10/20 7/6/20 1/4/21 7/5/21 10/7/21 -34% 24% -15% 28% -11%
Shawnee Kans. 553 405 443 518 542 3/10/20 7/6/20 1/4/21 7/5/21 10/7/21 -27% 9% 17% 5% -2%
Sherman Kans. 18 27 25 23 20 3/10/20 7/6/20 1/4/21 7/5/21 10/7/21 50% -7% -8% -13% 11%
Sumner Kans. 143 43 94 92 82 3/10/20 7/6/20 1/4/21 7/5/21 10/7/21 -70% 119% -2% -11% -43%
Thomas Kans. 14 9 11 19 19 3/10/20 7/6/20 1/4/21 7/5/21 10/7/21 -36% 22% 73% 0% 36%
Wabaunsee Kans. 9 5 9 6 13 3/10/20 7/6/20 1/4/21 7/5/21 10/7/21 -44% 80% -33% 117% 44%
Allen Ky. 80 43 54 86 81 3/10/20 7/6/20 1/4/21 7/5/21 9/2/21 -46% 26% 59% -6% 1%
Bell Ky. 117 97 152 132 130 3/10/20 7/6/20 1/4/21 7/5/21 10/7/21 -17% 57% -13% -2% 11%
Boone Ky. 457 370 452 480 450 3/10/20 7/6/20 1/4/21 7/5/21 8/23/21 -19% 22% 6% -6% -2%
Campbell Ky. 590 492 518 381 444 3/10/20 7/6/20 1/5/21 7/5/21 10/7/21 -17% 5% -26% 17% -25%
Christian Ky. 768 522 566 611 663 3/10/20 7/6/20 1/4/21 7/5/21 10/7/21 -32% 8% 8% 9% -14%
Clark Ky. 305 144 179 164 236 3/10/20 7/6/20 1/4/21 7/5/21 10/7/21 -53% 24% -8% 44% -23%
Daviess Ky. 740 499 649 583 577 3/10/20 7/6/20 1/4/21 7/5/21 10/7/21 -33% 30% -10% -1% -22%
Franklin Ky. 293 197 194 230 235 3/10/20 7/6/20 1/4/21 7/5/21 10/7/21 -33% -2% 19% 2% -20%
Graves Ky. 183 146 132 176 198 3/10/20 7/6/20 1/4/21 7/5/21 10/7/21 -20% -10% 33% 13% 8%
Jackson Ky. 128 78 88 96 94 3/10/20 7/6/20 1/4/21 7/5/21 10/7/21 -39% 13% 9% -2% -27%
Jessamine Ky. 143 83 90 147 143 3/10/20 7/6/20 1/3/21 7/5/21 10/7/21 -42% 8% 63% -3% 0%
Larue Ky. 143 82 132 132 122 3/10/20 7/6/20 1/4/21 7/5/21 10/7/21 -43% 61% 0% -8% -15%
Mason Ky. 188 105 111 172 180 3/10/20 7/6/20 1/4/21 7/5/21 10/7/21 -44% 6% 55% 5% -4%
Muhlenberg Ky. 278 199 230 243 270 3/10/20 7/6/20 1/4/21 7/5/21 10/7/21 -28% 16% 6% 11% -3%
Nelson Ky. 118 96 104 97 109 3/10/20 7/6/20 1/4/21 7/5/21 10/7/21 -19% 8% -7% 12% -8%
Pike Ky. 449 318 337 361 334 3/10/20 7/6/20 1/4/21 7/5/21 10/7/21 -29% 6% 7% -7% -26%
Pulaski Ky. 352 235 265 298 361 3/10/20 7/6/20 1/4/21 7/5/21 10/7/21 -33% 13% 12% 21% 3%
Rockcastle Ky. 104 59 61 66 79 3/10/20 7/6/20 1/4/21 7/5/21 10/7/21 -43% 3% 8% 20% -24%
Todd Ky. 135 81 123 124 118 3/10/20 7/6/20 1/4/21 7/5/21 10/7/21 -40% 52% 1% -5% -13%
Wayne Ky. 197 126 115 133 126 3/10/20 7/6/20 1/4/21 7/5/21 10/7/21 -36% -9% 16% -5% -36%
Allen La. 103 62 61 85 79 3/10/20 7/6/20 1/4/21 7/5/21 10/7/21 -40% -2% 39% -7% -23%
Assumption La. 101 94 134 119 203 3/10/20 7/6/20 1/4/21 7/5/21 10/7/21 -7% 43% -11% 71% 101%
Avoyelles La. 424 332 308 339 370 3/10/20 7/6/20 1/4/21 7/5/21 10/7/21 -22% -7% 10% 9% -13%
Beauregard La. 164 137 148 147 199 3/10/20 7/6/20 1/4/21 7/5/21 10/7/21 -16% 8% -1% 35% 21%
Bienville La. 42 29 28 22 27 3/10/20 7/6/20 1/4/21 7/5/21 10/7/21 -31% -3% -21% 23% -36%
Bogalusa City La. 19 14 22 12 20 3/10/20 7/6/20 1/4/21 7/5/21 10/7/21 -26% 57% -45% 67% 5%
Caldwell La. 611 502 583 589 606 3/10/20 7/6/20 1/4/21 7/5/21 10/7/21 -18% 16% 1% 3% -1%
Catahoula La. 72 47 53 75 93 3/10/20 7/6/20 1/4/21 7/5/21 10/7/21 -35% 13% 42% 24% 29%
Claiborne La. 579 465 422 488 448 3/10/20 7/6/20 1/4/21 7/5/21 10/7/21 -20% -9% 16% -8% -23%
East Feliciana La. 244 215 237 250 235 3/10/20 7/6/20 1/4/21 7/5/21 10/7/21 -12% 10% 5% -6% -4%
Evangeline La. 74 51 67 59 58 3/10/20 7/6/20 1/4/21 7/5/21 10/7/21 -31% 31% -12% -2% -22%
Franklin La. 815 680 816 813 789 3/10/20 7/6/20 1/4/21 7/5/21 10/7/21 -17% 20% 0% -3% -3%
Hammond City La. 14 11 10 6 8 3/10/20 7/6/20 1/4/21 7/5/21 10/7/21 -21% -9% -40% 33% -43%
Iberville La. 106 111 106 85 98 3/10/20 7/6/20 1/4/21 7/5/21 10/7/21 5% -5% -20% 15% -8%
Jefferson Davis La. 159 70 106 106 91 3/10/20 7/6/20 1/4/21 7/5/21 10/7/21 -56% 51% 0% -14% -43%
Lafayette La. 997 527 559 582 640 3/10/20 7/6/20 1/4/21 7/5/21 10/7/21 -47% 6% 4% 10% -36%
Lafourche La. 458 315 318 506 622 3/10/20 7/6/20 1/4/21 7/5/21 10/7/21 -31% 1% 59% 23% 36%
LaSalle La. 73 58 84 114 109 3/10/20 7/8/20 1/4/21 7/5/21 10/7/21 -21% 45% 36% -4% 49%
Morehouse La. 464 504 446 397 402 3/10/20 7/6/20 1/4/21 7/5/21 10/7/21 9% -12% -11% 1% -13%
Pointe Coupee La. 100 79 83 110 97 3/10/20 7/6/20 1/4/21 7/5/21 10/7/21 -21% 5% 33% -12% -3%
Rapides La. 877 848 871 933 901 3/10/20 7/6/20 1/4/21 7/5/21 10/7/21 -3% 3% 7% -3% 3%
Red River La. 64 57 52 58 48 3/10/20 7/6/20 1/4/21 7/5/21 10/7/21 -11% -9% 12% -17% -25%
Richland La. 751 583 694 660 623 3/10/20 7/6/20 1/4/21 7/5/21 10/7/21 -22% 19% -5% -6% -17%
Sabine La. 203 169 174 179 206 3/10/20 7/6/20 1/4/21 7/5/21 10/7/21 -17% 3% 3% 15% 1%
Shreveport La. 63 12 30 52 39 3/10/20 7/6/20 1/4/21 7/5/21 10/7/21 -81% 150% 73% -25% -38%
St Charles La. 458 419 403 360 381 3/10/20 7/6/20 1/4/21 7/5/21 8/29/21 -9% -4% -11% 6% -17%
St James La. 68 39 51 58 69 3/10/20 7/6/20 1/4/21 7/5/21 9/4/21 -43% 31% 14% 19% 1%
St John La. 147 123 81 51 26 3/10/20 7/6/20 1/4/21 7/5/21 10/7/21 -16% -34% -37% -49% -82%
Sulphur La. 11 17 13 18 13 3/10/20 7/6/20 1/4/21 7/5/21 10/7/21 55% -24% 38% -28% 18%
Tangipahoa La. 573 465 562 603 581 3/10/20 7/6/20 1/4/21 7/5/21 10/7/21 -19% 21% 7% -4% 1%
Terrebonne La. 647 502 550 575 599 3/10/20 7/6/20 1/4/21 7/5/21 10/7/21 -22% 10% 5% 4% -7%
Vermilion La. 147 134 156 140 160 3/10/20 7/6/20 1/4/21 7/5/21 10/7/21 -9% 16% -10% 14% 9%
Vernon La. 131 101 130 113 114 3/10/20 7/6/20 1/4/21 7/5/21 10/7/21 -23% 29% -13% 1% -13%
Ville Platte La. 15 6 16 9 11 3/10/20 7/6/20 1/4/21 7/5/21 10/7/21 -60% 167% -44% 22% -27%
Washington La. 163 138 185 190 193 3/10/20 7/6/20 1/4/21 7/5/21 10/7/21 -15% 34% 3% 2% 18%
Webster La. 627 550 584 578 591 3/10/20 7/6/20 1/4/21 7/5/21 10/7/21 -12% 6% -1% 2% -6%
West Feliciana La. 25 15 118 128 116 3/10/20 7/6/20 1/4/21 7/5/21 10/7/21 -40% 687% 8% -9% 364%
Cumberland Maine 354 298 318 269 277 3/10/20 7/6/20 1/4/21 7/5/21 10/7/21 -16% 7% -15% 3% -22%
Worcester Mass. 771 492 518 493 612 3/10/20 7/6/20 1/4/21 7/5/21 10/7/21 -36% 5% -5% 24% -21%
Allegany Md. 191 141 130 180 196 3/10/20 7/6/20 1/4/21 7/5/21 10/7/21 -26% -8% 38% 9% 3%
Prince Georges Md. 885 750 1,001 989 1,006 3/10/20 7/6/20 1/4/21 7/5/21 10/7/21 -15% 33% -1% 2% 14%
Delta Mich. 125 105 92 103 115 3/10/20 7/6/20 1/4/21 7/5/21 9/29/21 -16% -12% 12% 12% -8%
Midland Mich. 108 53 59 69 85 3/10/20 7/6/20 1/4/21 7/5/21 10/7/21 -51% 11% 17% 23% -21%
Wayne Mich. 2,103 2,160 2,940 3,072 3,111 3/10/20 7/6/20 1/4/21 7/5/21 10/7/21 3% 36% 4% 1% 48%
Beltrami Minn. 117 91 80 93 66 3/10/20 7/6/20 1/4/21 7/5/21 10/7/21 -22% -12% 16% -29% -44%
Blue Earth Minn. 114 68 81 71 67 3/10/20 7/6/20 1/4/21 7/5/21 10/7/21 -40% 19% -12% -6% -41%
Brown Minn. 18 16 16 23 17 3/10/20 7/6/20 1/4/21 7/5/21 10/7/21 -11% 0% 44% -26% -6%
Carlton Minn. 33 14 21 25 17 3/10/20 7/6/20 1/4/21 7/5/21 10/7/21 -58% 50% 19% -32% -48%
Chisago Minn. 61 25 33 31 29 3/10/20 7/6/20 1/4/21 7/5/21 10/7/21 -59% 32% -6% -6% -52%
Clay Minn. 121 70 90 115 118 3/10/20 7/6/20 1/4/21 7/5/21 10/7/21 -42% 29% 28% 3% -2%
Clearwater Minn. 17 12 12 25 25 3/10/20 7/6/20 1/4/21 7/5/21 10/7/21 -29% 0% 108% 0% 47%
Crow Wing Minn. 157 97 92 113 116 3/10/20 7/6/20 1/4/21 7/5/21 10/7/21 -38% -5% 23% 3% -26%
Fillmore Minn. 7 10 3 6 8 3/10/20 7/6/20 1/4/21 7/5/21 10/7/21 43% -70% 100% 33% 14%
Hubbard Minn. 64 40 41 40 41 3/10/20 7/6/20 1/4/21 7/5/21 10/7/21 -38% 3% -2% 3% -36%
Isanti Minn. 60 31 25 31 34 3/10/20 7/6/20 1/4/21 7/5/21 10/7/21 -48% -19% 24% 10% -43%
Kanabec Minn. 40 16 10 18 18 3/10/20 7/6/20 1/4/21 7/5/21 10/7/21 -60% -38% 80% 0% -55%
Kandiyohi Minn. 91 79 49 57 91 3/10/20 7/6/20 1/4/21 7/5/21 10/7/21 -13% -38% 16% 60% 0%
Koochiching Minn. 4 9 15 12 14 3/10/20 7/6/20 1/4/21 7/5/21 10/7/21 125% 67% -20% 17% 250%
Le Sueur Minn. 24 12 15 15 20 3/10/20 7/6/20 1/4/21 7/5/21 10/7/21 -50% 25% 0% 33% -17%
McLeod Minn. 36 22 22 23 27 3/10/20 7/6/20 1/4/21 7/5/21 10/7/21 -39% 0% 5% 17% -25%
Mille Lacs Minn. 81 51 37 37 48 3/10/20 7/6/20 1/4/21 7/5/21 10/7/21 -37% -27% 0% 30% -41%
Morrison Minn. 33 21 29 29 32 3/10/20 7/6/20 1/4/21 7/5/21 10/7/21 -36% 38% 0% 10% -3%
Nicollet Minn. 26 12 13 11 12 3/10/20 7/6/20 1/4/21 7/5/21 10/7/21 -54% 8% -15% 9% -54%
Pipestone Minn. 14 10 8 14 6 3/10/20 6/23/20 1/4/21 7/5/21 10/7/21 -29% -20% 75% -57% -57%
Redwood Minn. 12 13 12 12 15 3/10/20 7/6/20 1/4/21 7/5/21 10/7/21 8% -8% 0% 25% 25%
Renville Minn. 39 15 16 24 46 3/10/20 7/6/20 1/4/21 7/5/21 10/7/21 -62% 7% 50% 92% 18%
Roseau Minn. 21 10 13 12 12 3/10/20 7/6/20 1/4/21 7/5/21 8/26/21 -52% 30% -8% 0% -43%
Scott Minn. 141 57 98 123 123 3/10/20 7/6/20 1/4/21 7/5/21 10/7/21 -60% 72% 26% 0% -13%
Sherburne Minn. 307 259 225 285 286 3/10/20 7/6/20 1/4/21 7/5/21 10/7/21 -16% -13% 27% 0% -7%
Sibley Minn. 10 4 8 6 8 3/10/20 7/6/20 1/4/21 7/5/21 10/7/21 -60% 100% -25% 33% -20%
Swift Minn. 4 4 3 7 9 3/10/20 7/6/20 1/4/21 7/5/21 10/7/21 0% -25% 133% 29% 125%
Wilkin Minn. 9 9 12 5 12 3/10/20 7/6/20 1/4/21 7/5/21 10/7/21 0% 33% -58% 140% 33%
Winona Minn. 31 23 21 31 29 3/10/20 7/6/20 1/4/21 7/5/21 10/7/21 -26% -9% 48% -6% -6%
Wright Minn. 186 91 120 116 156 3/10/20 7/6/20 1/4/21 7/5/21 10/7/21 -51% 32% -3% 34% -16%
Yellow Medicine Minn. 15 13 12 10 20 3/10/20 7/6/20 1/4/21 7/5/21 10/7/21 -13% -8% -17% 100% 33%
Adams Miss. 77 78 63 91 98 3/10/20 7/6/20 1/4/21 7/5/21 10/7/21 1% -19% 44% 8% 27%
Clay Miss. 68 51 64 77 102 3/10/20 7/6/20 1/4/21 7/5/21 10/7/21 -25% 25% 20% 32% 50%
Hancock Miss. 203 207 178 196 223 3/10/20 7/6/20 1/4/21 7/5/21 10/7/21 2% -14% 10% 14% 10%
Jackson Miss. 340 375 347 351 403 3/10/20 7/6/20 1/4/21 7/5/21 10/7/21 10% -7% 1% 15% 19%
Jasper Miss. 30 24 24 24 24 3/10/20 7/6/20 1/8/21 7/5/21 10/7/21 -20% 0% 0% 0% -20%
Lamar Miss. 107 87 79 96 94 3/10/20 7/6/20 1/4/21 7/5/21 10/7/21 -19% -9% 22% -2% -12%
Lee Miss. 194 201 228 31 29 3/10/20 7/6/20 1/4/21 7/5/21 10/7/21 4% 13% -86% -6% -85%
Tunica Miss. 27 23 21 22 33 3/10/20 7/6/20 1/4/21 7/5/21 10/7/21 -15% -9% 5% 50% 22%
Barry Mo. 46 47 61 64 67 3/10/20 7/6/20 1/4/21 7/5/21 10/7/21 2% 30% 5% 5% 46%
Bates Mo. 31 20 15 20 17 3/10/20 7/6/20 1/6/21 7/5/21 10/7/21 -35% -25% 33% -15% -45%
Benton Mo. 35 20 30 30 26 3/10/20 7/6/20 1/4/21 7/5/21 10/7/21 -43% 50% 0% -13% -26%
Boone Mo. 253 204 243 243 233 3/10/20 7/6/20 1/4/21 7/5/21 9/4/21 -19% 19% 0% -4% -8%
Buchanan Mo. 222 165 184 188 171 3/10/20 7/6/20 1/4/21 7/5/21 10/7/21 -26% 12% 2% -9% -23%
Cape Girardeau Mo. 148 156 189 229 227 3/10/20 6/11/20 1/4/21 7/5/21 10/7/21 5% 21% 21% -1% 53%
Christian Mo. 102 64 62 84 84 3/10/20 7/6/20 1/4/21 7/5/21 10/7/21 -37% -3% 35% 0% -18%
Clay Mo. 301 215 201 264 244 3/10/20 7/6/20 1/4/21 7/5/21 10/7/21 -29% -7% 31% -8% -19%
Jackson Mo. 851 696 756 781 749 3/10/20 7/6/20 1/4/21 7/5/21 10/7/21 -18% 9% 3% -4% -12%
Johnson Mo. 202 86 118 155 145 3/10/20 7/6/20 1/4/21 7/5/21 10/7/21 -57% 37% 31% -6% -28%
Joplin Mo. 54 27 22 20 46 3/10/20 7/6/20 1/4/21 7/5/21 10/7/21 -50% -19% -9% 130% -15%
Lewis Mo. 9 8 14 13 13 3/10/20 7/13/20 1/4/21 7/5/21 10/7/21 -11% 75% -7% 0% 44%
Marion Mo. 81 58 67 81 89 3/10/20 7/6/20 1/4/21 7/5/21 10/7/21 -28% 16% 21% 10% 10%
McDonald Mo. 35 39 49 47 40 3/10/20 7/6/20 1/4/21 7/5/21 10/7/21 11% 26% -4% -15% 14%
Saline Mo. 57 41 55 57 59 3/10/20 7/6/20 1/4/21 7/5/21 10/7/21 -28% 34% 4% 4% 4%
Stone Mo. 65 70 49 49 60 3/10/20 7/6/20 1/4/21 7/5/21 10/7/21 8% -30% 0% 22% -8%
Big Horn Mont. 38 44 37 20 37 3/10/20 7/6/20 1/4/21 7/5/21 10/7/21 16% -16% -46% 85% -3%
Lewis and Clark Mont. 106 109 112 100 103 3/10/20 7/6/20 1/4/21 7/5/21 10/7/21 3% 3% -11% 3% -3%
Ravalli Mont. 41 47 49 55 47 3/10/20 7/6/20 1/4/21 7/5/21 10/7/21 15% 4% 12% -15% 15%
Valley Mont. 42 28 34 27 18 3/10/20 7/6/20 1/4/21 7/5/21 10/7/21 -33% 21% -21% -33% -57%
Alamance N.C. 363 220 237 247 282 3/10/20 7/6/20 1/4/21 7/5/21 10/7/21 -39% 8% 4% 14% -22%
Burke N.C. 135 120 119 142 112 3/10/20 7/6/20 1/4/21 7/5/21 10/7/21 -11% -1% 19% -21% -17%
Cabarrus N.C. 327 196 189 248 270 3/10/20 7/6/20 1/4/21 7/5/21 10/7/21 -40% -4% 31% 9% -17%
Carteret N.C. 167 110 101 101 100 3/10/20 7/6/20 1/4/21 7/5/21 10/7/21 -34% -8% 0% -1% -40%
Catawba N.C. 302 217 212 274 284 3/10/20 7/6/20 1/4/21 7/5/21 10/7/21 -28% -2% 29% 4% -6%
Clay N.C. 316 211 156 236 280 3/10/20 7/6/20 1/4/21 7/5/21 10/7/21 -33% -26% 51% 19% -11%
Cleveland N.C. 325 184 218 297 297 3/10/20 7/6/20 1/4/21 7/5/21 10/7/21 -43% 18% 36% 0% -9%
Davidson N.C. 340 207 231 276 266 3/10/20 7/6/20 1/4/21 7/5/21 10/7/21 -39% 12% 19% -4% -22%
Gaston N.C. 585 444 508 590 580 3/10/20 6/28/20 1/4/21 7/5/21 10/7/21 -24% 14% 16% -2% -1%
Guilford N.C. 1,093 780 705 790 871 3/10/20 7/6/20 1/4/21 7/5/21 10/7/21 -29% -10% 12% 10% -20%
Lee N.C. 119 94 123 134 142 3/10/20 7/6/20 1/4/21 7/5/21 10/7/21 -21% 31% 9% 6% 19%
Lincoln N.C. 153 69 107 129 116 3/10/20 7/6/20 1/4/21 7/5/21 10/7/21 -55% 55% 21% -10% -24%
Moore N.C. 140 106 148 147 157 3/10/20 7/6/20 1/4/21 7/5/21 10/7/21 -24% 40% -1% 7% 12%
Pender N.C. 89 71 76 80 86 3/10/20 7/6/20 1/4/21 7/5/21 10/7/21 -20% 7% 5% 8% -3%
Randolph N.C. 260 201 213 229 243 3/10/20 7/6/20 1/20/21 7/5/21 10/7/21 -23% 6% 8% 6% -7%
Richmond N.C. 114 77 75 80 102 3/10/20 7/6/20 1/4/21 7/5/21 10/7/21 -32% -3% 7% 28% -11%
Rowan N.C. 345 237 261 346 339 3/10/20 7/6/20 1/4/21 7/5/21 10/7/21 -31% 10% 33% -2% -2%
Sampson N.C. 254 167 166 220 252 3/10/20 7/6/20 1/4/21 7/5/21 10/7/21 -34% -1% 33% 15% -1%
Stanly N.C. 157 96 117 140 155 3/10/20 7/6/20 1/4/21 7/5/21 10/7/21 -39% 22% 20% 11% -1%
Transylvania N.C. 77 44 32 48 47 3/10/20 7/6/20 1/4/21 7/5/21 10/7/21 -43% -27% 50% -2% -39%
Wake N.C. 1,266 1,058 1,165 1,174 1,254 3/10/20 7/6/20 1/4/21 7/5/21 10/7/21 -16% 10% 1% 7% -1%
Washington N.C. 457 306 280 336 358 3/10/20 7/6/20 1/4/21 7/5/21 10/7/21 -33% -8% 20% 7% -22%
Stutsman N.D. 47 35 41 49 43 3/10/20 7/6/20 1/4/21 7/5/21 10/7/21 -26% 17% 20% -12% -9%
Williams N.D. 91 115 118 87 68 3/10/20 7/6/20 1/4/21 7/5/21 10/7/21 26% 3% -26% -22% -25%
Bergen N.J. 618 290 336 413 388 3/10/20 7/6/20 1/4/21 7/5/21 10/7/21 -53% 16% 23% -6% -37%
Cumberland N.J. 341 251 292 324 351 3/10/20 7/6/20 1/4/21 7/5/21 10/7/21 -26% 16% 11% 8% 3%
Ocean N.J. 329 254 314 274 287 3/10/20 7/6/20 1/4/21 8/26/21 10/7/21 -23% 24% -13% 5% -13%
Salem N.J. 303 270 342 356 344 3/10/20 7/6/20 1/4/21 7/5/21 10/7/21 -11% 27% 4% -3% 14%
Curry N.M. 184 158 155 164 152 3/10/20 7/6/20 1/4/21 7/5/21 8/16/21 -14% -2% 6% -7% -17%
Hobbs N.M. 12 13 18 15 7 3/10/20 7/8/20 1/5/21 7/5/21 9/20/21 8% 38% -17% -53% -42%
Lea N.M. 238 135 134 156 17 3/10/20 7/6/20 1/4/21 7/5/21 10/7/21 -43% -1% 16% -89% -93%
San Juan N.M. 519 319 443 558 518 3/10/20 7/6/20 1/4/21 7/5/21 10/7/21 -39% 39% 26% -7% 0%
Monroe N.Y. 1,538 1,192 1,422 1,432 709 3/10/20 7/6/20 1/4/21 7/5/21 10/7/21 -22% 19% 1% -50% -54%
Hall Nebr. 276 207 201 216 254 3/10/20 7/6/20 1/4/21 7/5/21 10/7/21 -25% -3% 7% 18% -8%
Lancaster Nebr. 629 471 584 610 635 3/10/20 7/6/20 1/4/21 7/5/21 9/14/21 -25% 24% 4% 4% 1%
Lincoln Nebr. 117 109 109 153 138 3/10/20 7/6/20 1/4/21 7/5/21 10/7/21 -7% 0% 40% -10% 18%
Adams Ohio 43 41 18 38 34 3/10/20 7/6/20 1/4/21 7/5/21 10/7/21 -5% -56% 111% -11% -21%
Clermont Ohio 379 313 341 331 353 3/10/20 7/6/20 1/4/21 7/5/21 10/7/21 -17% 9% -3% 7% -7%
Clinton Ohio 81 55 35 74 60 3/10/20 7/6/20 1/4/21 7/5/21 10/7/21 -32% -36% 111% -19% -26%
Delaware Ohio 235 164 133 177 173 3/10/20 7/6/20 1/4/21 7/5/21 10/7/21 -30% -19% 33% -2% -26%
Franklin Ohio 2,009 1,530 1,623 1,708 1,677 3/10/20 7/6/20 1/4/21 7/5/21 10/7/21 -24% 6% 5% -2% -17%
Gallia Ohio 59 37 47 67 49 3/10/20 7/6/20 1/4/21 7/5/21 10/7/21 -37% 27% 43% -27% -17%
Guernsey Ohio 105 89 65 98 87 3/10/20 7/6/20 1/4/21 7/5/21 10/7/21 -15% -27% 51% -11% -17%
Hamilton Ohio 1,512 1,129 1,369 1,303 1,329 3/10/20 7/6/20 1/4/21 7/5/21 10/7/21 -25% 21% -5% 2% -12%
Morrow Ohio 104 59 53 122 103 3/10/20 7/6/20 1/4/21 7/5/21 10/7/21 -43% -10% 130% -16% -1%
Ottawa Ohio 92 61 54 73 76 3/10/20 7/6/20 1/4/21 7/5/21 10/7/21 -34% -11% 35% 4% -17%
Pickaway Ohio 121 116 76 97 68 3/10/20 7/6/20 1/4/21 7/5/21 10/7/21 -4% -34% 28% -30% -44%
Carter Okla. 36 9 51 42 20 3/10/20 7/6/20 1/4/21 7/5/21 10/7/21 -75% 467% -18% -52% -44%
Comanche Okla. 357 273 296 370 372 3/10/20 7/6/20 1/4/21 7/5/21 10/7/21 -24% 8% 25% 1% 4%
Garvin Okla. 67 57 53 62 59 3/10/20 7/6/20 1/4/21 7/5/21 10/7/21 -15% -7% 17% -5% -12%
Okmulgee Okla. 176 212 163 133 141 3/10/20 7/6/20 1/4/21 7/5/21 10/4/21 20% -23% -18% 6% -20%
Pottawatomie Okla. 204 191 211 206 209 3/10/20 7/6/20 1/4/21 7/5/21 10/7/21 -6% 10% -2% 1% 2%
Baker Ore. 32 14 24 25 18 3/10/20 7/16/20 1/4/21 7/5/21 10/7/21 -56% 71% 4% -28% -44%
Clackamas Ore. 434 189 235 218 222 3/10/20 7/6/20 1/4/21 7/5/21 10/7/21 -56% 24% -7% 2% -49%
Clatsop Ore. 58 43 44 56 54 3/10/20 7/6/20 1/4/21 7/5/21 10/7/21 -26% 2% 27% -4% -7%
Douglas Ore. 206 127 133 171 123 3/10/20 7/6/20 1/4/21 7/5/21 10/7/21 -38% 5% 29% -28% -40%
Harney Ore. 8 3 8 6 6 3/10/20 7/6/20 1/4/21 7/5/21 8/28/21 -63% 167% -25% 0% -25%
Jackson Ore. 327 268 253 264 274 3/10/20 7/6/20 1/4/21 7/5/21 10/7/21 -18% -6% 4% 4% -16%
Josephine Ore. 192 158 97 183 112 3/10/20 7/6/20 1/4/21 7/5/21 10/7/21 -18% -39% 89% -39% -42%
Klamath Ore. 136 71 83 107 107 3/10/20 7/6/20 1/4/21 7/5/21 10/7/21 -48% 17% 29% 0% -21%
Lincoln Ore. 161 77 100 110 117 3/10/20 7/6/20 1/4/21 7/5/21 10/7/21 -52% 30% 10% 6% -27%
Linn Ore. 207 122 123 144 125 3/10/20 6/29/20 1/4/21 7/5/21 10/7/21 -41% 1% 17% -13% -40%
Marion Ore. 430 278 317 293 349 3/10/20 7/6/20 1/4/21 7/5/21 10/7/21 -35% 14% -8% 19% -19%
Marion Work Center Ore. 91 39 55 59 59 3/10/20 7/6/20 1/4/21 7/5/21 7/16/21 -57% 41% 7% 0% -35%
Multnomah Ore. 1,122 660 797 794 748 3/10/20 7/6/20 1/4/21 7/5/21 10/7/21 -41% 21% 0% -6% -33%
Polk Ore. 110 63 65 107 67 3/10/20 7/6/20 1/4/21 7/5/21 10/7/21 -43% 3% 65% -37% -39%
Tillamook Ore. 65 36 25 37 32 3/10/20 7/6/20 1/4/21 7/5/21 10/7/21 -45% -31% 48% -14% -51%
Wasco Ore. 132 65 86 82 55 3/10/20 7/6/20 1/4/21 7/5/21 10/7/21 -51% 32% -5% -33% -58%
Washington Ore. 878 544 416 557 585 3/10/20 7/6/20 1/4/21 7/5/21 10/7/21 -38% -24% 34% 5% -33%
Yamhill Ore. 167 62 77 83 107 3/10/20 7/6/20 1/4/21 7/5/21 10/7/21 -63% 24% 8% 29% -36%
Clinton Pa. 46 44 166 170 173 3/10/20 7/6/20 1/4/21 7/5/21 10/7/21 -4% 277% 2% 2% 276%
Cumberland Pa. 409 230 228 281 323 3/10/20 7/6/20 1/4/21 7/5/21 10/7/21 -44% -1% 23% 15% -21%
Dauphin Pa. 1,110 868 971 954 999 3/10/20 7/6/20 1/4/21 7/5/21 9/9/21 -22% 12% -2% 5% -10%
Lancaster Pa. 786 675 638 771 781 3/10/20 7/6/20 1/4/21 7/5/21 10/7/21 -14% -5% 21% 1% -1%
Aiken S.C. 460 379 417 310 302 3/10/20 7/6/20 1/4/21 7/5/21 7/16/21 -18% 10% -26% -3% -34%
Anderson City S.C. 97 86 91 108 112 3/10/20 7/6/20 1/4/21 7/5/21 10/7/21 -11% 6% 19% 4% 15%
Berkeley S.C. 439 298 395 420 459 3/10/20 7/6/20 1/4/21 7/5/21 10/7/21 -32% 33% 6% 9% 5%
Cherokee S.C. 358 267 310 345 350 3/10/20 7/6/20 1/4/21 7/5/21 10/7/21 -25% 16% 11% 1% -2%
Darlington S.C. 164 129 178 203 180 3/10/20 7/6/20 1/4/21 7/5/21 10/7/21 -21% 38% 14% -11% 10%
Kershaw S.C. 80 86 104 113 111 3/10/20 7/6/20 1/4/21 7/5/21 10/7/21 8% 21% 9% -2% 39%
Laurens S.C. 226 162 187 212 178 3/10/20 7/6/20 1/4/21 7/5/21 10/7/21 -28% 15% 13% -16% -21%
Lexington S.C. 493 305 432 502 524 3/10/20 7/6/20 1/4/21 7/5/21 10/7/21 -38% 42% 16% 4% 6%
Marion S.C. 7 6 1 2 1 3/10/20 7/6/20 1/4/21 7/5/21 10/7/21 -14% -83% 100% -50% -86%
Pickens S.C. 303 228 204 248 291 3/10/20 7/6/20 1/4/21 7/5/21 10/7/21 -25% -11% 22% 17% -4%
Sumter S.C. 310 265 294 325 344 3/10/20 7/6/20 1/4/21 7/5/21 10/7/21 -15% 11% 11% 6% 11%
Clay S.D. 12 15 21 16 14 3/10/20 7/6/20 1/4/21 7/5/21 10/7/21 25% 40% -24% -13% 17%
Blount Tenn. 533 475 468 469 453 3/10/20 7/6/20 1/4/21 7/5/21 10/7/21 -11% -1% 0% -3% -15%
Macon Tenn. 300 262 306 269 323 3/10/20 7/6/20 1/4/21 7/5/21 10/7/21 -13% 17% -12% 20% 8%
Polk Tenn. 181 154 168 145 123 3/10/20 7/6/20 1/4/21 7/5/21 10/7/21 -15% 9% -14% -15% -32%
Shelby Tenn. 1,857 1,398 1,243 1,018 1,344 3/10/20 7/6/20 1/4/21 7/5/21 10/7/21 -25% -11% -18% 32% -28%
Wayne Tenn. 152 122 127 132 142 3/10/20 7/6/20 1/4/21 7/5/21 10/7/21 -20% 4% 4% 8% -7%
Archer Tex. 26 30 25 28 18 3/10/20 7/6/20 1/4/21 7/5/21 10/7/21 15% -17% 12% -36% -31%
Bell Tex. 869 774 1,040 1,207 1,218 3/10/20 7/6/20 1/4/21 7/5/21 10/7/21 -11% 34% 16% 1% 40%
Brown Tex. 166 152 160 159 182 3/10/20 7/6/20 1/4/21 8/1/21 10/7/21 -8% 5% -1% 14% 10%
Calhoun Tex. 78 88 79 91 77 3/10/20 7/6/20 1/4/21 7/5/21 10/7/21 13% -10% 15% -15% -1%
Coleman Tex. 33 30 41 32 41 3/10/20 7/6/20 1/4/21 7/5/21 10/7/21 -9% 37% -22% 28% 24%
Cooke Tex. 163 153 159 145 160 3/10/20 7/6/20 1/4/21 7/5/21 10/7/21 -6% 4% -9% 10% -2%
DeWitt Tex. 81 88 86 95 91 3/10/20 7/6/20 1/4/21 7/5/21 10/7/21 9% -2% 10% -4% 12%
Ellis Tex. 375 303 371 442 532 3/10/20 7/6/20 1/4/21 7/5/21 10/7/21 -19% 22% 19% 20% 42%
Erath Tex. 80 64 76 107 110 3/10/20 7/6/20 1/4/21 8/26/21 10/7/21 -20% 19% 41% 3% 38%
Galveston Tex. 997 853 962 1,057 1,049 3/10/20 7/6/20 1/4/21 7/5/21 10/7/21 -14% 13% 10% -1% 5%
Hopkins Tex. 159 186 168 170 201 3/10/20 7/6/20 1/4/21 7/5/21 10/7/21 17% -10% 1% 18% 26%
Jim Wells Tex. 62 56 43 49 68 3/10/20 7/6/20 1/4/21 7/5/21 10/7/21 -10% -23% 14% 39% 10%
Lavaca Tex. 27 21 10 25 23 3/10/20 7/6/20 1/4/21 8/2/21 10/7/21 -22% -52% 150% -8% -15%
Lubbock Tex. 1,255 1,285 1,228 1,360 1,315 3/10/20 7/6/20 1/4/21 7/5/21 8/1/21 2% -4% 11% -3% 5%
Parmer Tex. 28 22 26 26 38 3/10/20 7/6/20 1/4/21 7/5/21 10/7/21 -21% 18% 0% 46% 36%
Polk Tex. 188 161 199 195 213 3/10/20 7/6/20 1/4/21 7/5/21 10/7/21 -14% 24% -2% 9% 13%
Randall Tex. 416 381 409 410 404 3/10/20 7/6/20 1/4/21 7/5/21 10/7/21 -8% 7% 0% -1% -3%
Rockwall Tex. 226 221 201 202 221 3/10/20 7/6/20 1/4/21 7/5/21 10/7/21 -2% -9% 0% 9% -2%
Terry Tex. 84 89 88 82 88 3/10/20 7/6/20 1/4/21 7/5/21 10/7/21 6% -1% -7% 7% 5%
Titus Tex. 133 94 73 83 88 3/10/20 7/6/20 1/4/21 7/5/21 10/7/21 -29% -22% 14% 6% -34%
Tom Green Tex. 393 421 423 487 565 3/10/20 7/6/20 1/4/21 7/5/21 10/7/21 7% 0% 15% 16% 44%
Wharton Tex. 145 103 99 118 121 3/10/20 7/6/20 1/4/21 7/5/21 10/7/21 -29% -4% 19% 3% -17%
Salt Lake Utah 2,142 1,188 1,415 1,688 1,780 3/10/20 7/6/20 1/4/21 7/5/21 10/7/21 -45% 19% 19% 5% -17%
Blue Ridge Bedford Va. 100 79 92 100 95 3/10/20 7/6/20 1/4/21 7/5/21 10/7/21 -21% 16% 9% -5% -5%
Blue Ridge Halifax Va. 180 176 186 40 159 3/10/20 7/6/20 1/4/21 7/5/21 10/7/21 -2% 6% -78% 298% -12%
Blue Ridge Lynchburg Va. 470 394 512 526 324 3/10/20 7/6/20 1/4/21 7/5/21 10/7/21 -16% 30% 3% -38% -31%
Chesapeake Va. 1,031 908 1,000 1,008 957 3/10/20 7/6/20 1/4/21 7/5/21 10/7/21 -12% 10% 1% -5% -7%
Danville Va. 364 321 310 275 273 3/10/20 7/6/20 1/4/21 7/5/21 10/7/21 -12% -3% -11% -1% -25%
Middle Peninsula Va. 178 156 155 176 152 3/10/20 6/29/20 1/4/21 7/5/21 10/7/21 -12% -1% 14% -14% -15%
Middle River Va. 901 730 856 759 770 3/10/20 7/6/20 1/4/21 7/5/21 10/7/21 -19% 17% -11% 1% -15%
Norfolk Va. 935 685 930 956 888 3/10/20 7/6/20 1/4/21 7/5/21 10/7/21 -27% 36% 3% -7% -5%
Pamunkey Va. 391 310 397 417 386 3/10/20 7/6/20 1/4/21 7/5/21 10/7/21 -21% 28% 5% -7% -1%
Riverside Va. 1,376 1,144 1,245 1,231 1,026 3/10/20 7/6/20 1/4/21 7/5/21 10/7/21 -17% 9% -1% -17% -25%
Roanoke Va. 172 152 198 176 146 3/10/20 7/6/20 1/4/21 7/5/21 10/7/21 -12% 30% -11% -17% -15%
Virginia Beach Va. 1,509 1,142 1,298 1,249 1,146 3/10/20 7/6/20 1/4/21 7/5/21 10/7/21 -24% 14% -4% -8% -24%
Virginia Peninsula Va. 377 317 330 379 353 3/10/20 7/6/20 1/4/21 7/5/21 10/7/21 -16% 4% 15% -7% -6%
Western Virginia Va. 944 746 765 843 745 3/10/20 7/6/20 1/5/21 7/5/21 10/7/21 -21% 3% 10% -12% -21%
Chelan Wash. 197 158 165 140 122 3/10/20 7/6/20 1/4/21 7/5/21 10/7/21 -20% 4% -15% -13% -38%
Clallam Forks Wash. 17 10 9 19 11 3/10/20 7/6/20 1/4/21 7/5/21 10/7/21 -41% -10% 111% -42% -35%
Clark Wash. 663 422 398 366 354 3/10/20 7/6/20 1/4/21 7/5/21 10/7/21 -36% -6% -8% -3% -47%
Grays Harbor Wash. 180 142 123 118 116 3/10/20 7/6/20 1/4/21 7/5/21 10/7/21 -21% -13% -4% -2% -36%
Grays Harbor Aberdeen Wash. 22 16 5 14 8 3/10/20 7/6/20 1/4/21 7/5/21 10/7/21 -27% -69% 180% -43% -64%
Grays Harbor Hoquiam Wash. 31 27 17 13 14 3/10/20 7/6/20 1/4/21 7/5/21 10/7/21 -13% -37% -24% 8% -55%
Island Wash. 68 44 37 41 40 3/10/20 7/6/20 1/4/21 7/5/21 10/7/21 -35% -16% 11% -2% -41%
Jefferson Wash. 30 22 17 26 17 3/10/20 7/6/20 1/4/21 7/5/21 10/7/21 -27% -23% 53% -35% -43%
King Issaquah Wash. 57 34 28 34 29 3/10/20 7/6/20 1/4/21 7/5/21 10/7/21 -40% -18% 21% -15% -49%
Kitsap Wash. 385 236 282 262 243 3/10/20 7/6/20 1/4/21 7/5/21 10/6/21 -39% 19% -7% -7% -37%
Klickitat Wash. 40 32 31 40 39 3/10/20 7/8/20 1/4/21 7/7/21 10/7/21 -20% -3% 29% -3% -3%
Lewis Wash. 192 169 154 164 141 3/10/20 7/6/20 1/4/21 7/5/21 10/7/21 -12% -9% 6% -14% -27%
Okanogan Wash. 161 91 94 88 83 3/10/20 7/6/20 1/4/21 7/5/21 10/7/21 -43% 3% -6% -6% -48%
Skagit Wash. 280 155 167 172 182 3/10/20 7/6/20 1/4/21 7/5/21 10/7/21 -45% 8% 3% 6% -35%
Skamania Wash. 25 22 23 13 22 3/10/20 7/6/20 2/16/21 7/5/21 10/7/21 -12% 5% -43% 69% -12%
Snohomish Wash. 747 444 501 467 404 3/10/20 7/6/20 1/4/21 7/5/21 10/7/21 -41% 13% -7% -13% -46%
Snohomish Lynnwood Wash. 49 9 20 16 13 3/10/20 7/6/20 1/4/21 7/5/21 10/7/21 -82% 122% -20% -19% -73%
Snohomish Marysville Wash. 35 11 13 20 10 3/10/20 7/6/20 1/4/21 7/5/21 10/7/21 -69% 18% 54% -50% -71%
Thurston Olympia Wash. 23 13 16 7 17 3/10/20 7/6/20 1/4/21 7/5/21 10/7/21 -43% 23% -56% 143% -26%
Walla Walla Wash. 89 79 66 57 55 3/10/20 7/6/20 1/4/21 7/5/21 10/7/21 -11% -16% -14% -4% -38%
Whatcom Wash. 291 206 218 216 263 3/10/20 7/6/20 1/4/21 7/5/21 10/7/21 -29% 6% -1% 22% -10%
Whitman Wash. 31 18 25 24 22 3/10/20 7/6/20 1/4/21 7/5/21 10/7/21 -42% 39% -4% -8% -29%
Yakima Wash. 879 449 567 595 579 3/10/20 7/6/20 1/4/21 7/5/21 10/7/21 -49% 26% 5% -3% -34%
Brown Wis. 719 588 706 653 692 3/10/20 7/6/20 1/4/21 7/5/21 10/7/21 -18% 20% -8% 6% -4%
Eau Claire Wis. 275 193 196 198 181 3/10/20 7/6/20 1/4/21 7/5/21 10/6/21 -30% 2% 1% -9% -34%
La Crosse Wis. 152 102 111 113 87 3/10/20 7/6/20 1/4/21 7/5/21 10/7/21 -33% 9% 2% -23% -43%
Lincoln Wis. 105 77 72 74 59 3/10/20 7/6/20 1/4/21 7/5/21 10/7/21 -27% -6% 3% -20% -44%
Manitowoc Wis. 209 182 148 199 149 3/10/20 7/6/20 1/4/21 7/5/21 10/7/21 -13% -19% 34% -25% -29%
Sawyer Wis. 114 87 119 111 73 3/10/20 7/6/20 1/4/21 7/5/21 10/7/21 -24% 37% -7% -34% -36%
Big Horn Wyo. 70 65 65 62 56 3/10/20 7/6/20 1/4/21 7/5/21 10/7/21 -7% 0% -5% -10% -20%
Lincoln Wyo. 44 38 23 23 24 3/10/20 7/6/20 1/4/21 7/5/21 10/7/21 -14% -39% 0% 4% -45%
Park Wyo. 42 36 34 42 42 3/10/20 7/6/20 1/4/21 7/5/21 10/7/21 -14% -6% 24% 0% 0%

We’re lucky when criminal justice data is broken down by race and ethnicity enough to see how Native populations are criminalized and incarcerated. Here’s a roundup of what we know.

by Leah Wang, October 8, 2021

This Monday is Indigenous Peoples’ Day, a holiday dedicated to Native American people, their rich histories, and their cultures. Our way of observing the holiday: sending a reminder that Native people are harmed in unique ways by the U.S. criminal justice system. We offer a roundup of what we know about Native people (those identified by the Census Bureau as American Indian/Alaska Native) who are impacted by prisons, jails, and police, and about the persistent gaps in data collection and disaggregation that hide this layer of racial and ethnic disparity.

The U.S. incarcerates a growing number of Native people, and what little data exist show overrepresentation

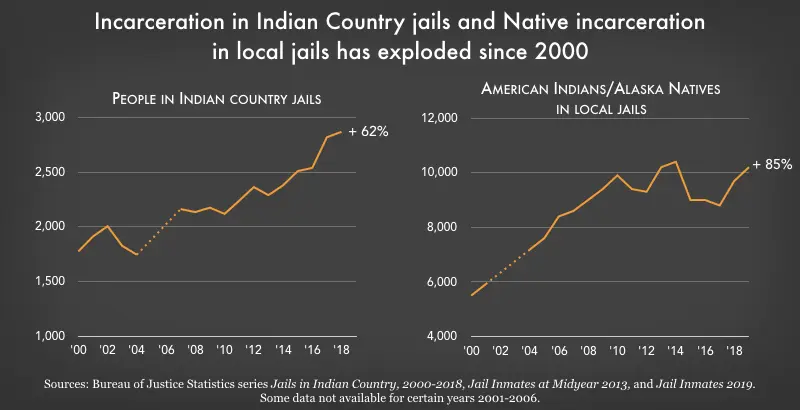
In 2019, the latest year for which we have data, there were over 10,000 Native people locked up in local jails. Although this population has fluctuated over the past 10 years, the Native jail population is up a shocking 85% since 2000.1 And these figures don’t even include those held in “Indian country jails,” which are located on tribal lands: The number of people in Indian country jails increased by 61% between 2000 and 2018.2 Meanwhile, the total population of Native people living on tribal lands has actually decreased slightly over the same time period, leaving us to conclude that we are criminalizing Native people at ever-increasing rates.

Incarceration in Indian Country jails and of Native people has exploded

Government data publications breaking down incarcerated populations by race or ethnicity often omit Native people, or obscure them unhelpfully in a meaningless “Other” category, perhaps because they make up a relatively small share of the total population. The latest incarceration data, however, shows that American Indian and Alaska Native people have high rates of incarceration in both jails and prisons as compared with other racial and ethnic groups. In jails, Native people had more than double the incarceration rate of white people, and in prisons this disparity was even greater.

  • American Indian and Alaska Native people have high rates of incarceration in both jails and prisons as compared with other racial and ethnic groups
  • ative women are incarcerated at a higher rate than any other race.
  • American Indian and Alaska Native people have high rates of incarceration in both jails and prisons as compared with other racial and ethnic groups
  • ative women are incarcerated at a higher rate than any other race.

Native people made up 2.1% of all federally incarcerated people in 2019, larger than their share of the total U.S. population, which was less than one percent.3 Similarly, Native people made up about 2.3% of people on federal community supervision in mid-2018. The reach of the federal justice system into tribal territory is complex: State law often does not apply, and many serious crimes can only be prosecuted at the federal level, where sentences can be harsher than they would be at the state level. This confusing network of jurisdiction sweeps Native people up into federal correctional control in ways that don’t apply to other racial and ethnic groups.4

Native women are particularly overrepresented in the incarcerated population: They made up 2.5% of women in prisons and jails in 2010, the most recent year for which we have this data (until the 2020 Census data is published); that year, Native women were just 0.7% of the total U.S. female population.5 Their overincarceration is another maddening aspect of our nation’s contributions to human rights crises facing Native women, in addition to Missing and Murdered Indigenous Women (MMIW) and high rates of sexual and other violent victimization.6

Confinement of Native youth is a crisis

The rampant racial disparities in how Native youth are treated by the juvenile and criminal justice system are somewhat better-documented. Their confinement rates, second only to those of Black youth, exceed those of white, Hispanic and Asian youth combined. Forces contributing to this disparity include disproportionate arrest rates of Native youth for some offense types, the school-to-prison pipeline, and harsher outcomes for court-involved youth, particularly for low-level offenses like technical violations of probation and status offenses.

  • Native youth are confined at a higher rate than white, Hispanic, and Asian youth combined
  • Native and Black youth are confined for low level offenses at 3 times the rate of white youth
  • Arrest rates for Native youth are increasing
  • Native youth are confined at a higher rate than white, Hispanic, and Asian youth combined
  • Native and Black youth are confined for low level offenses at 3 times the rate of white youth
  • Arrest rates for Native youth are increasing

In absolute numbers, there are fewer Native youth than there are white, Black, Hispanic, or Asian youth, but the rate at which they are in contact with police and youth confinement facilities is alarming. Centuries of historical trauma are manifesting in Native youth as mental health and substance use issues that go untreated, and can lead to status offenses (acts that are only criminal because of one’s age, like skipping school) or other “delinquent” behavior. Once again, federal jurisdiction over tribal lands makes Native youth worse off for being swept up into criminal-legal matters at all, because they’re more likely to receive longer federal sentences and less likely to receive the services and support they need.

Even the best data collection obscures the scale and scope of Native people in the criminal justice system

There is still a long way to go to attain consistent data collection and reporting on Native populations in the criminal justice system. One glaring problem is that pesky “Other” category where we sometimes find Asian, Pacific Islander, Native Hawaiian, and American Indian/Alaska Native people. This is clearly an unhelpful category for uncovering bias throughout policing, courts, jails, prisons, and supervision.

One reason that even our most disaggregated data falls short is that often, people reporting two or more races are lumped into various categories depending on who is publishing the data. In 2011, the latest year for which we have this data, the single-race American Indian/Alaska Native jail population was 12,100 while the total number of people who included a Native identity was almost 70,000. This reporting makes it clear that Native people are overrepresented among the incarcerated populations, but we don’t always see the data presented in a way that highlights this disparity.7

The number of Native people in jail depends on how you count them

Even great strides in this area will likely not give us tribal-level data. Native American people are not a monolith; there are 574 federally recognized Native American tribes as of March 2020. On a day that some are beginning to dedicate to Native people, rather than the people seeking to erase them, it’s critical to understand how Native people on both tribal and non-tribal lands are overcriminalized.


Footnotes

  1. The Native population in local jails was 10,200 in 2019, up from 5,500 in 2000 – an 85% increase. The growth of the Native population in jails far outpaced the growth of the total jail population over the same period: Overall, local jail populations grew 18% from 2000 to 2019. (Before 2000, in reporting jail populations, the Bureau of Justice Statistics combined the American Indian/Native Alaskan population with Asians, Native Hawaiians and Pacific Islanders into an “Other” category.)  ↩

  2. The term “Indian country,” in this context, is a legal term referring to land within American Indian reservations and other Native communities and allotments. The Bureau of Justice Statistics collects and publishes data about jail facilities on these lands separately from other locally-operated jails in the U.S. According to the National Congress of American Indians (NCAI), the term “Indian Country” – with a capital “C” – “is used with positive sentiment within Native communities, by Native-focused organizations such as NCAI, and news organizations such as Indian Country Today.”  ↩

  3. Based on U.S. Census Bureau population estimates of people identifying as non-Hispanic, and American Indian/Native Alaskan alone or in combination with one or more other races.  ↩

  4. The remote nature of tribal lands in relation to federal buildings like courthouses, parole offices and prisons also makes it difficult to comply with post-release supervision, make court dates, or visit incarcerated loved ones. For the same reason, Native people are consistently underrepresented on federal trial juries, despite being constitutionally mandated to be fairly represented on them. These are examples of how Native people are harmed and shut out by the federal justice system.  ↩

  5. The number of Native women in both the U.S. population and the incarcerated population (defined as non-Hispanic, single-race females) was sourced from the 2010 U.S. Census.  ↩

  6. The “jurisdictional maze” between federal and tribal authorities (described earlier in this briefing) makes it less likely that a crime of sexual violence occurring on tribal land will be prosecuted, leaving victims with little support and little choice but to continue living near those who harm them.  ↩

  7. If you expand the definition of who is Native among the general U.S. population, you’re also going to see an increase, but it’s not nearly as staggering as the six-fold increase between the narrowest and widest definitions of incarcerated Native people. In 2011, the single-race, non-Hispanic AI/AN population would be 2.3 million; including Hispanic AI/AN people would increase this figure to 3.8 million; and including multi-racial AI/AN people would increase the figure to 4.1 million, only a 1.7-fold increase from lowest to highest.  ↩


Stay Informed


Get the latest updates:


Share on 𝕏 Donate


Events

Not near you?
Invite us to your city, college or organization.