California profile
California has an incarceration rate of 494 per 100,000 people (including prisons, jails, immigration detention, and juvenile justice facilities), meaning that it locks up a higher percentage of its people than almost any democratic country on earth. Read on to learn more about who is incarcerated in California and why.
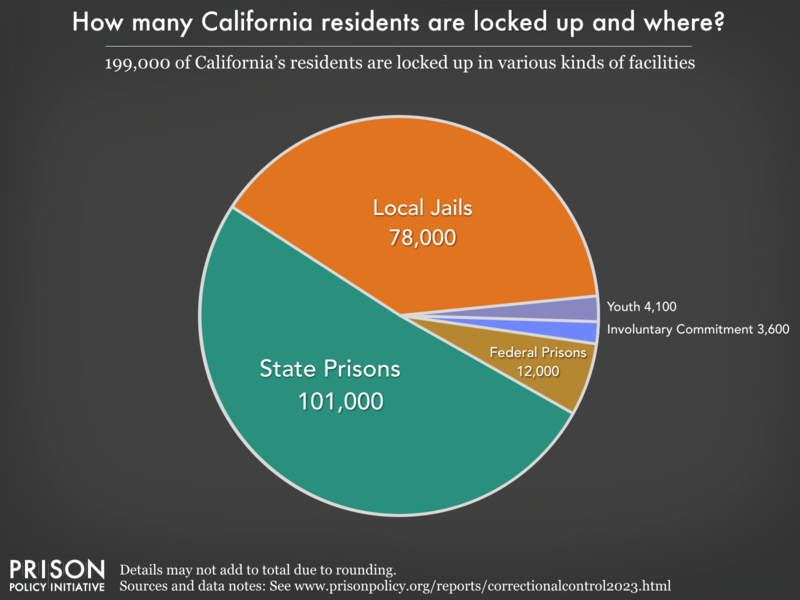
199,000 people from California are behind bars
Additionally, the number of people impacted by county and city jails in California is much larger than the graph above would suggest, because people cycle through local jails relatively quickly. Each year, at least 368,000 different people are booked into local jails in California.
Using 2020 census data, we looked at where people in California prisons come from. We found mass incarceration harms all corners of the state.
Rates of imprisonment have grown dramatically in the last 40 years
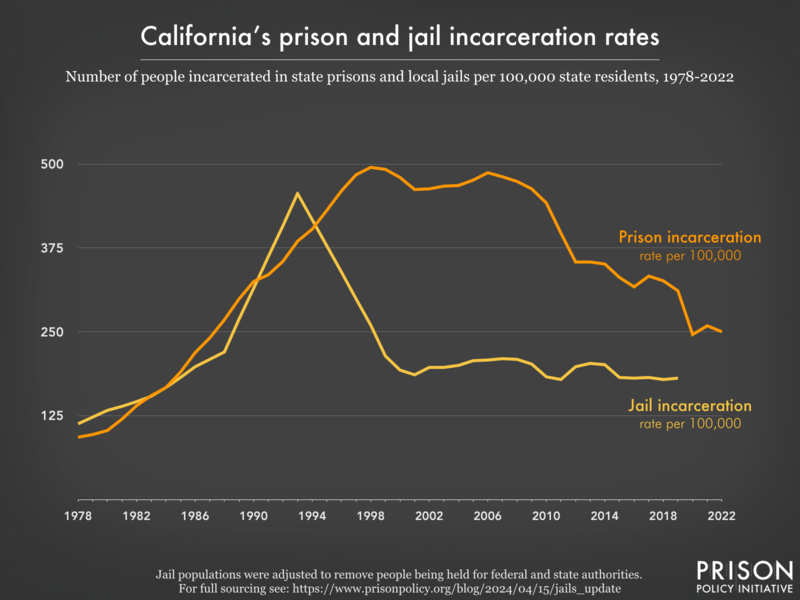
- total numbers rather than rates.
- Women’s prisons: Incarceration Rates | Total Population
- Men’s prisons: Incarceration Rates | Total Population
Today, California’s incarceration rates stand out internationally

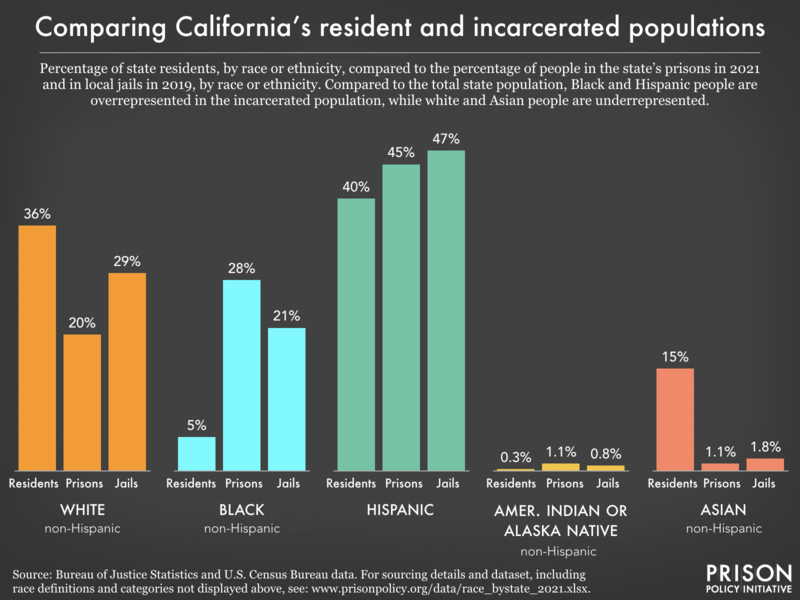
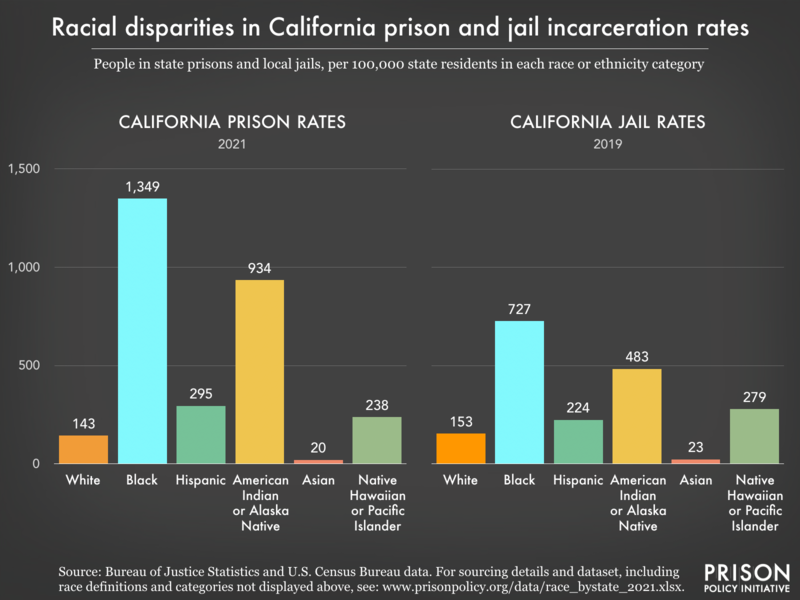
People of color are overrepresented in prisons and jails
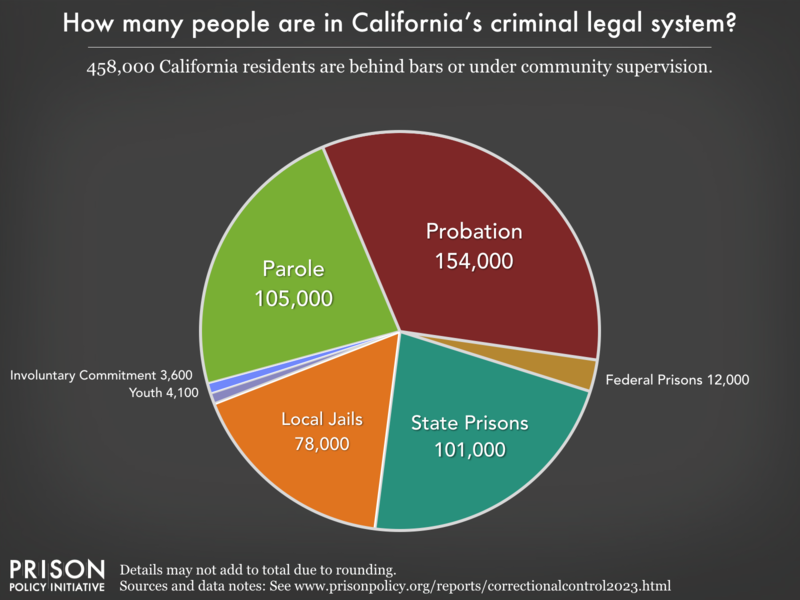
California's criminal justice system is more than just its prisons and jails
Reports and briefings about California's criminal legal system:
Filter to show
- With an incarceration rate of 494 per 100,000 residents, California locks up a higher percentage of its people than almost any democratic country on earth.
- During the 2020 redistricting cycle, California successfully reallocated nearly every person in state prison back to their home community, as part of its efforts to end prison gerrymandering.
- Prisons in California force incarcerated people and their families — some of the most vulnerable members of society — to subsidize mass incarceration.
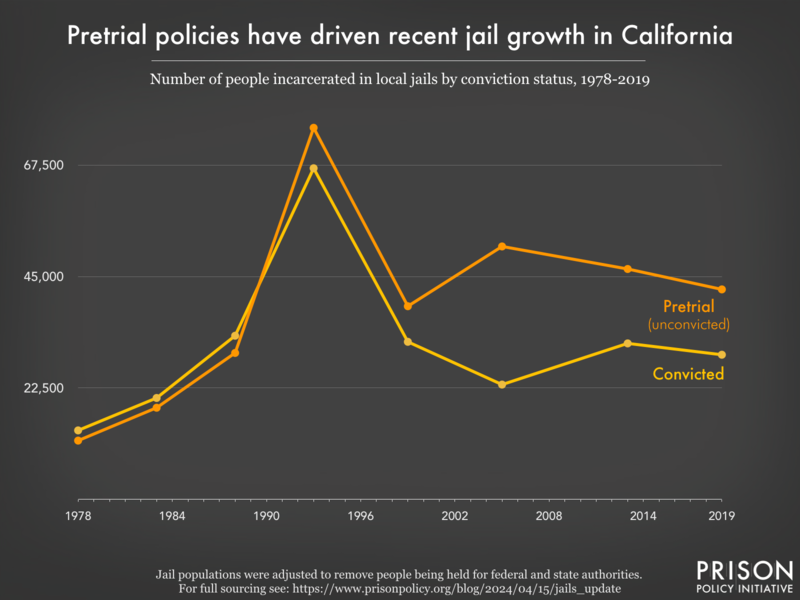
- 59% of people in California jails have not been convicted of a crime, meaning they're legally innocent. There are simple steps the state can take to reduce this number. Why isn't it?
- California releases roughly 786,970 men and 200,866 women from its prisons and jails each year. What is it doing to support them upon reentry?
- We graded California's limited discretionary parole system and gave it an F
- California allows parole officers to restrict whom their clients can be around — even loved ones who are trying to help them
- Black people in California are incarcerated at a rate 9.5 times higher than white people.
- California's choice to criminalize "failure to appear" may be hurting public safety
- The cost of incarcerating older people is incredibly high, and their risk of reincarceration is incredibly low, yet 16% of people in California prisons are over the age of 55. Why is the state keeping so many older people locked up?
- Most people in California prisons says say they know of no plan by the prison to respond to climate emergencies, like extreme heat or cold, wildfires, or floods.
- Data from San Francisco, Santa Clara County and other jurisdictions shows: Releasing people pretrial doesn't harm public safety
- California makes it difficult or even risky for incarcerated journalists to tell their stories.
- California is one of 20 states that locks up some people convicted of sex offenses in shadowy "civil commitment" facilities, long after their sentences are over — and often indefinitely
- In California, 199,000 people are incarcerated and another 259,000 are on probation or parole.
- California passed a caregiver mitigation and diversion law that diverts primary caregivers from incarceration during the pretrial period, and individuals who successfully complete the program avoid not just incarceration, but the collateral consequences of a criminal conviction.
- California charges 5¢ for an e-message to or from prison, but gives incarcerated people some free messages every week.
- Jails in California charge up to $3.15 for a 15-minute phone call.
- Los Angeles County has a jail-based polling location that enables people detained at the facility to cast ballots in elections
- Bail companies in California have a track record of avoiding accountability, our report All Profit, No Risk and review of state-by-state evidence show
- Report:
 Where people in prison come from: The geography of mass incarceration in California
 - In some California prisons, incarcerated people are forced to drink and breathe contaminants
- California is one of just a handful of states that do not charge incarcerated people copays for medical care.
- California was one of three states that saw more than 500 people die in its prisons in the first year of the COVID pandemic.
- The poorest people in California prisons get some items for free — but they have to pay the state back.
- California prisons charge families up to a 20% fee to transfer money to an incarcerated loved one.
- We gave California a "C-" grade in September 2021 for its response to the coronavirus in prisons.
- California hinders jury diversity by excluding people with felony records until they complete probation and parole sentences
- How many COVID-19 cases in California communities can be linked to outbreaks in correctional facilities? (data from our report Mass Incarceration, COVID-19, and Community Spread)
- We graded the parole release systems of all 50 states - California gets an F-
- California incarcerates women at a rate of 88 per 100,000 residents — higher than almost any democratic country on earth.
- Victory in California: RISE Act repeals sentencing enhancements
- California legislators continue fighting for in-person jail visits
- People in California prisons earn as little as 8¢ an hour for their work.
- Governor Brown signs prison anti-sterilization bill
- Victory: Santa Barbara County scraps harmful jail letter ban policy
- California’s budget secret: Prisoners form core of forest fire fighting army
- New Youth CineMedia video documents Santa Barbara struggle to overturn jail letter ban
- Step one to reduce recidivism in Santa Barbara County: stop banning letters from home
- Victory: Santa Clara County sheriff scraps plan to ban letters from home
- California was the 4th state to end prison gerrymandering.
 Importing Constituents: Incarcerated People and Political Clout in California
Other resources
- Research on California in our Research Library
- Prison Gerrymandering Project: California Campaign page
Events
- September 14, 2024:
Our advocacy department will host a workshop at the MacArthur Justice Center’s Realizing Releases convening. The workshop will provide strategies for investigating state parole systems.
Register for the convening here.
Not near you?
Invite us to your city, college or organization.
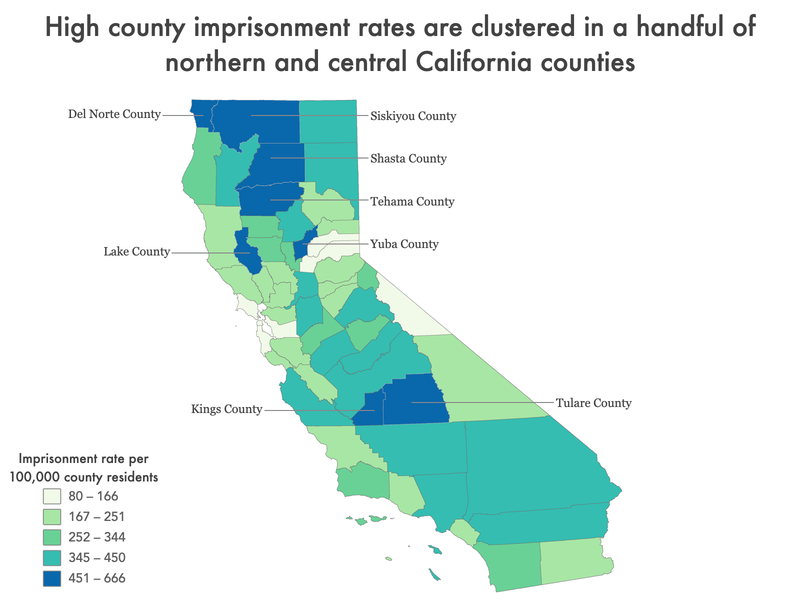
 Where people in prison come from: The geography of mass incarceration in California
 Importing Constituents: Incarcerated People and Political Clout in California