The dramatic tale of mail ballots during the November 2020 election had many people thinking about the mail for the first time in years. Now, though, as the election fades into the past, the post office isn’t on most people’s minds as much. But there is a huge group of people who can’t simply substitute the latest online communication or financial service for paper mail: incarcerated people and those who communicate with them.
In a time when consumer advocates warn to avoid filing your taxes on paper, people in prison and jail have no alternative. Want to monitor your credit history to guard against identity theft? It takes a few minutes online; unless you’re in prison, in which case you’ll have to mail a paper form to the credit bureaus and hope that the response makes it through the prison mailroom. Need to apply for a state-issued ID, student financial aid, public assistance, or just about anything else? Most often you’ll be directed to a website, but if you’re incarcerated you’ll need to keep turning over proverbial rocks, searching for a paper-based option.
With this general background in mind, let’s turn to a largely-overlooked change that could spell big trouble for users of the mail, particularly for those with low incomes. Under federal law, postal rates are set under a variety of complicated rules, overseen by the Postal Regulatory Commission (PRC). For years, the cost of a first-class stamp has been governed by an inflation-linked price cap: the USPS could seek permission to raise rates each year, but not beyond the rate of consumer inflation. After years of deliberation, the PRC issued a massive ruling in late November, establishing a new system that most experts warn will result in faster-growing postage rates.
Adding insult to injury: Obviously, any price increase is unwelcome news to people who use the mail. But the rationale underpinning the new price structure is a particularly bitter pill for incarcerated consumers. Setting aside some of the more esoteric parts of the PRC’s ruling, the leading justification for new price hikes is the issue of “mail density.”
Mail density works like this: the USPS is required to deliver to more addresses (or “delivery points,” in postal regulatory lingo) each year. As the overall volume of mail declines and the number of delivery points increases, the USPS’s cost to deliver each piece of mail goes up. Given this well-documented dynamic, the PRC decided that stamp prices should be allowed to increase to compensate for this “decline in mail density.”
So, we’re all going to pay more for stamps because of decreasing density–but what delivery point is more dense than a typical prison, where hundreds or thousands of people receive their mail at one address? From a strictly economic view, the new pricing system is logical: the American postal system is based on a theory of uniform rates, where anyone sending a letter pays the same amount, regardless of the path that the letter travels. Under this thinking, declines in density caused by sprawling new suburban developments are appropriately shared by all mailers, even those in densely populated cities or correctional facilities. But as a matter of basic fairness, something is awry. Incarcerated people are not contributing to the USPS’s declining density problem and they have no ability to mitigate increased postage rates by seeking electronic alternatives. But they stand to be the demographic most disadvantaged by the sharp price hikes likely to come later this year.
What does this mean for prices? The mechanics of the new rate procedure are so complicated as to be laughable. For example, the actual amount that stamp prices will increase due to the new density rate authority is determined by the following formula:
Not being gifted in math, I can’t give you a good explanation of this formula, but experts who study postal economics predict rapid and steep price increases. And the pandemic is making things worse. As explained in the previous section, the basic point of the complicated formula is to allow for greater price increases the more that mail density declines. What happened during the pandemic? Less mail was sent, and thus density took a nosedive.
As explained by the Save the Post Office blog, when the PRC issued its ruling, tentative calculations suggested that the density formula would probably yield a rate hike of 1.3% in 2021. But when the pandemic-depressed mail volume is plugged into the formula, it results in a potential price hike over three times as large (4.5%).
When other potential rate-drivers are taken into account, USPS could seek a mid-year price hike of around 5.5%. Based on the current first-class rate of 55c for a one-ounce letter, a 5.5% increase would be around 3c, but under the USPS’s ill-advised rounding policy (which we strongly opposed), the increase would be rounded up to the nearest five cents, potentially resulting in a new price of 60c to mail a letter. That’s about equal to the average hourly wage earned by incarcerated people in non-prison-industry certified jobs.
Prices go up as quality goes down. To make matters even worse, prices are going up at the same time that mail quality (i.e., speed of delivery) is getting really bad. For this, we can thank Postmaster General Louis DeJoy, a crony of the former president whose legendary conflicts of interest remain a stain on his tenure to this very day.
Unsurprisingly, Postmaster General DeJoy is on a seeming mission to destroy the USPS, recently announcing even greater service cutbacks that threaten to make mail even slower and less reliable than it is today.
What can you do about it? Unlike the criminal justice system, where power and decision-making is spread over hundreds of jurisdictions, postal policy is ultimately controlled by one body: Congress. There are currently moves in Congress to address mismanagement of the USPS, but when debating postal reform measures, lawmakers need to hear the unique burdens faced by incarcerated people.
Currently, there are two ways you can tell Congress to act. You can support efforts to remove Postmaster DeJoy, and you can tell your members of Congress to act immediately to improve the USPS finances without extracting more money from incarcerated people and their families. A general hearing on postal reform measures will take place in the House Oversight and Reform Committee on February 24. Committee members should keep the needs of incarcerated mailers in mind while crafting legislative proposals. For starters, this should include broad measures to stabilize the cost of sending first-class letters. More targeted reforms could include exempting incarcerated people from the new density-based rate increases, or (ideally) subsidizing postage for people in prison and jail.
New statewide data from the Connecticut Coalition to End Homelessness underscore the harms of criminalizing homelessness and the destabilizing effects of incarceration.
In December, officials in Seattle drew the ire of activists when they decided to sweep a homeless encampment in Cal Anderson park despite warnings from public health officials. Dozens of people experiencing homelessness were displaced and 24 people were arrested just a week before Christmas. Seattle is not alone. At the same time that cities around the country, including Denver and Reno, continue police sweeps of homeless encampments during the pandemic, researchers in Connecticut have compiled recent data showing that this criminalization of homelessness – together with barriers to housing upon re-entry – has created a revolving door between prisons and homeless shelters.
Research has consistently shown a strong link between incarceration and homelessness. Our 2018 report found that formerly incarcerated people are almost 10 times more likely to be homeless than the general public. Other national data shows 50,000 people enter shelters directly from correctional facilities per year.1 And homelessness is a majorpredictor of involvement with the juvenile justice system, which means that for many youth, the cycle of incarceration and homelessness starts early.
To date, there has been no national data on how many people experiencing homelessness have had prior criminal justice involvement. New data from the Connecticut Coalition to End Homelessness helps fill this gap. The study was also able to parse how many people experienced homelessness before incarceration versus how many experienced homelessness after release – underscoring both the harms of criminalizing homelessness and the destabilizing effects of incarceration. Above all, the findings illustrate the importance of including stable housing in states’ public safety agendas.
The study’s main findings
The Connecticut Coalition to End Homelessness (CCEH) matched data from the 450,000 people who have been admitted to the Connecticut Department of Corrections (DOC), the state’s joint prison and jail system, and the 17,226 people who used a shelter in their network between Jan. 2016 and Jan. 2019, finding that half of the people (8,187) who used homeless shelters were formerly incarcerated. Moreover, they found that 1 in 5 people who used homeless shelters had been released from prison in the past three years. The CCEH network includes 88% of all emergency shelters in the state.
The study found stark racial disparities among the population of formerly incarcerated people using homeless shelters. Of the 8,187 formerly incarcerated people experiencing homelessness, 35% were Black, compared to just 10% of the general population in Connecticut.2 This reflects the fact that Black Americans are disproportionately impacted by both incarceration and homelessness, and is in line with our national finding that Black formerly incarcerated people are significantly more likely to experience homelessness than white formerly incarcerated people.
The criminalization of homelessness
To get a better picture of those with relatively recent experience with both homelessness and incarceration, the Connecticut Coalition to End Homelessness zeroed in on people who both used homeless shelters in their network and who were released from the Department of Corrections in the past three years (Jan. 2016 to Jan. 2019). They found most formerly incarcerated people (69%) in the sample were homeless before their incarceration. The data also indicates that they were typically incarcerated for relatively minor offenses: 80% of those sentenced were released at the end of their sentence (as opposed to going to a halfway house or to parole supervision), which suggests many served shorter sentences, which in turn are indicative of lower-level offenses. And among those who were held pretrial, 75% were released by the court without bond, also suggesting relatively minor offenses.3
These findings reflect the pervasive criminalization of homelessness in Connecticut. As researchers at Yale Law School explain, “Laws in cities throughout Connecticut prohibit a person without a bed from sleeping on a park bench, ban someone without a place to be during the day from standing in a public plaza, and restrict the ability of a person without access to food to ask for money to buy something to eat.” This puts people experiencing homelessness at high risk for arrest and incarceration, even though these “offenses” pose no threat to public safety.It’s both inhumane and counterproductive: Arresting and incarcerating people experiencing homelessness makes it harder for them to secure housing, jobs, and public assistance by saddling them with a criminal record and fines and fees that are impossible for them to pay. It only serves to fuel the revolving door between prisons and homeless shelters.
Barriers to successful re-entry
However, over a quarter (28%) of people who had both used the networks’ homeless shelters and been released from the Department of Corrections from Jan. 2016 to Jan. 2019 reported becoming homeless only after their last release from the Department of Corrections. This finding underscores how destabilizing and counterproductive incarceration is, and how little support incarcerated people have once released. Upon incarceration, most people lose their jobs and housing, and it is extremely difficult for people to regain their footing upon release. The unemployment rate for formerly incarcerated people is nearly five times higherthan the unemployment rate for the general population in the U.S. Formerly incarcerated people face widespread discrimination in both unemployment and housing, making it extremely difficult to succeed post-release.
Finally, the Connecticut Coalition to End Homelessness conducted an in-depth investigation of formerly incarcerated people experiencing homelessness in the city of New Haven, which offers an even more detailed analysis. Most notably, over half (54%) of formerly incarcerated homeless people in New Haven have been admitted to prison on 6 or more occasions, further illustrating the fruitlessness of using incarceration – or criminal legal responses more broadly – to address people’s underlying needs or to deal with the problem of homelessness. Rather than “rehabilitating” people, incarceration simply makes it harder for people to succeed upon release. Instead of investing in policing and incarcerating people experiencing homelessness, cities and states should instead invest in stable housing, healthcare, and other social services that address people’s unmet needs.
Closing the “revolving door”
The Connecticut Coalition to End Homelessness’ data show clearly that responding to homelessness with policing and incarceration is not just immoral, but also ineffective. To “close the revolving door,” CCEH is working with the Connecticut Department of Corrections to launch the DOC’s Re-entry Housing Assistance Program,4 locating housing options before release for individuals they identify as at-risk of becoming homeless. For cases where the DOC can’t find a housing alternative, CCEH’s network of service providers is available to create and implement housing plans, again starting before release.
Other states and cities can follow Connecticut’s lead and stop the revolving door between homelessness and incarceration by creating clear-cut systems to help recently-released individuals find homes, “banning the box” on housing applications to prevent discrimination against people with criminal records, ending the criminalization of homelessness, and expanding social services for the homeless, focusing on “Housing First.”
Footnotes
This figure does not include people experiencing homelessness who don’t use shelters or people who enter shelters after a period of instability following incarceration.
A unique strength of the data set is that the Connecticut Department of Corrections has a joint prison and jail system, so the data set captures even short periods of incarceration for minor offenses that normally wouldn’t be captured in prison admissions data. In most states, people detained pretrial or serving short sentences (commonly of under 1 year) are held in county or municipal jails, while those serving longer sentences are held in state prisons.
Among its 2021 legislative priorities, the Connnecticut Coalition to End Homelessness supports the creation of a “reentry housing assistance” line item within the DOC budget and the appropriation of at least $2 million per year to this line item.
Several studies show that formerly incarcerated people - and the children of currently incarcerated people - are at especially high risk of experiencing food insecurity.
The COVID-19 pandemic – and the government’s insufficient response in providing economic relief – has led to an enormous increase in food insecurity in this country. At least 54 million people are facing experiencing food insecurity (meaning they don’t have access to healthy food), and past research suggests that formerly incarcerated people, and the children of currently incarcerated people, are at especially high risk. This briefing summarizes and explains this research.
Food insecurity is an often-overlooked consequence of incarceration, and it can’t be separated from the more well-known problems of homelessness and unemployment. While the estimates vary somewhat, researchers consistently find that food insecurity is more common among formerly incarcerated people — and families with an incarcerated parent — than among the general population:
In a 2013 survey of recently released individuals in three states, 91% of respondents reported food insecurity, and 37% reported not having eaten for an entire day because they could not afford food.
A 2019 study found that 20% of formerly incarcerated people report suffering from food insecurity — double that of the general population — with even higher rates among formerly incarcerated women and Black individuals.
Young children who live with their father before his incarceration are three times as likely to experience food insecurity, according to a study focused on the impact of paternal incarceration.
Finally, a 2012 study found that the incarceration of either parent increases the likelihood of food insecurity for adults and households with children by up to 15 percentage points.
These last two studies offer further, direct evidence of how incarceration punishes entire families and communities, not just people who are locked up. Most incarcerated people are parents; their absence while incarcerated – and the barriers they face when they come home – have ramifications for their entire families, particularly children. The potentially severe and lifelong consequences of experiencing food insecurity in childhood are among the many injustices visited upon the families and communities most impacted by mass incarceration.
The high levels of food insecurity among formerly incarcerated people also underscores the difficulty of reentry, and the lasting, life-threatening effects of incarceration. Apart from the obvious policy choice of incarcerating fewer people, states and counties must provide more robust support for recently released people. States that still limit access to food programs like SNAP (or food stamps) because of former convictions must immediately abandon this discriminatory practice, and invest in infrastructure so that formerly incarcerated people and food-insecure families have access to transportation, housing, and employment opportunities.
A new report finds little evidence supporting the idea that building new prisons for women will lead to better outcomes, even with gender-responsive and trauma-informed programming.
In January, as the United States government prepared to execute Lisa Montgomery, news stories described the horrific sexual and physical abuse Montgomery experienced throughout her childhood and adult life. These accounts are shocking — but devastatingly, not so unusual. Studies suggest that more than half of women in state prisons survived physical and/or sexual abuse prior to their incarceration.
Prison is a horrible place for people struggling with symptoms of past trauma, as well as those with histories of mental illness and substance abuse. Well-meaning policymakers sometimes suggest building “kinder, gentler” prisons that offer needed counseling — and indeed, one such project has recently been proposed for convicted women in Massachusetts — but in practice, prisons themselves are fundamentally in opposition with goals of supportive programming.
In fact, Professor Susan Sered, along with Erica Taft and Cherry Russell, have just published an extensive review of the research on the outcomes of existing, prison-based therapeutic treatments — particularly for women. They conclude that the value gained from prison-based trauma, mental health, and substance abuse interventions are far outweighed by the harms caused by incarceration. Instead, they argue, alternatives outside of prisons that provide trauma-informed support, alongside practical interventions such as housing assistance and health care, are far more beneficial than anything that can be offered in a prison setting.
Prison is inherently traumatizing
Incarceration itself is retraumatizing and damaging to mental health. “Prisons are full of trauma-triggers,” Sered and her co-authors write, “such as unexpected noises, sounds of distress from other people, barked orders, pat-downs, strip searches, and looming threats of punishment for breaking any one of myriad rules.” Incarcerated women often experience new traumas and indignities, including the loss of their children and families, their bodily privacy, and their freedom of movement, time, and personal space. Meanwhile, “prison conditions including noise, crowding, lack of privacy, substandard diet, insufficient fresh air, harassment and ongoing threats of violence and punishment are further associated with negative health impacts.”
Even the most well-designed and decorated prison is still a prison, and inherently unconducive to trauma-informed therapeutic programs, where participants are encouraged to acknowledge their trauma and engage in practices that promote recovery and wellness. “Treatment can retraumatize clients when authoritative or coercive methods are used,” the authors explain. “Ideally, trauma-informed treatment should take place in a warm, welcoming and uncrowded space that provides room for a ‘time-out’ option. These conditions are difficult to meet in a prison context.”
There is insufficient study of the long-term benefits of prison-based therapy
Prison-based therapy programs show some benefits: The review notes that “a meta-analysis of studies published between 2000 and 2013 identified reduced recidivism rates for women who participated in gender-informed correctional interventions.”
However, the authors also point out that there has been little study of long-term benefits. This is in part due to logistical challenges: It can be difficult to locate and follow up with study participants post-release. Summarizing a study from 2020, they write: “while mental health services in prison can partially protect some women from some of the strains of being in prison, there is little evidence that these services are of much benefit after they leave prison.” They further note that they “could not identify any studies that evaluate program impact in terms of variables such as post-incarceration employment, health or family reunification.”
What’s more, while gender-sensitive prison-based programs may benefit participants in some ways in the short term (a welcome effect in a prison setting), troublingly, at least one cited study suggests that these programs may over-emphasize “individual pathology.” Along the same lines, another study finds that staff often urge incarcerated women to see the error of their ways and “self-improve.” Incarcerated men, meanwhile, are more likely to report more practical supports, such as staff helping them gain real-world job and educational skills.
Similar problems plague drug treatment in prisons
Prisons are also inherently difficult places to participate in substance abuse treatment. “The prison environment itself creates added stress which may lead some people to seek psychotropic substances—both prescribed and illicit,” the authors write, noting that many prisons also resist evidence-driven, medication-assisted substance abuse treatment.
To study the results of compulsory drug treatment, the authors point to a 2018 Canadian review of court-mandated drug programs, which found that “forced treatment did not improve outcomes for substance use. Instead, findings showed higher levels of mental duress, homelessness, relapse and overdose among adults after discharge from mandated treatment.” They also quote a 2016 meta-analysis of compulsory drug treatments, which concluded: “Evidence does not, on the whole, suggest improved outcomes related to compulsory treatment approaches, with some studies suggesting potential harms.”
Recommendations:
Unfortunately, while there are numerous models for community-based alternatives to incarceration, they generally suffer from a similar lack of rigorous, long-term research as prison-based therapies. Therefore, the authors cannot recommend specific programs.
They do note, however, that studies suggest successful prison alternatives would “set realistic expectations for participants, avoid using threats of punishment to obtain compliance, and refrain from sending participants to prison because of drug use.” Research into the reentry needs of formerly incarcerated women shows that justice-involved women often benefit from support in the areas of economic marginalization and poverty, housing, trauma, and family reunification.
This fits with the recommendations of Sered and her coauthors: They suggest that alternatives-to-prison programs for women provide practical support, including housing assistance, family reunification, help establishing community relationships, health care and substance abuse support, and restorative justice programs. When executed correctly, the authors argue that community-based alternatives could be cost-effective and help keep women out of prison in the first place.
The good news is that jail and prison populations remain lower than they were before COVID-19, but it’s not obvious just how much of that is attributable to additional releases.
This article was updated on October 21st, 2021 with more recent jail and prison population data. That version should be used instead of this one.
Families and advocates want to know: How many people have been released from prisons and jails specifically because of efforts to reduce the spread of COVID-19 in correctional facilities and surrounding communities? Despite our ability to track overall correctional populations during the pandemic, the answer to this crucial question isn’t clear. Because of the disparate, disjointed nature of our local, state, and federal criminal justice systems, it is always difficult to track the effects of specific reforms, or to determine which policies are driving changes in the overall number of incarcerated people. During the current pandemic, this makes it impossible to pinpoint just how much of the recent population reductions were the result of special efforts to release people due to COVID-19 — as opposed to “normal” releases or changes in incoming admissions. But what is clear is that there are plenty of ways to reduce correctional populations, and that states and local governments are not using these tools to their full potential.
Prisons
Even in states where prison populations have dropped, there are still too many people behind bars to accommodate social distancing, effective isolation and quarantine, and increased health care requirements. For example, although California has reduced the state prison population by about 22% in the past 12 months, it has not been enough to prevent large COVID-19 outbreaks in the state’s prisons. In fact, as of January 20th, 2021, California’s prisons were still holding more people than they were designed for, at 103% of their design capacity.
Figure 1. Prison population data for 30 states where sufficient population data was readily available from January 2020 to January 2021, either directly from the state Departments of Correction or the Vera Institute of Justice. See our COVID-19 response tracker for more information on many of the most important policy changes that led to these (generally small) reductions in some states. For the population data for these 30 states, see Appendix A.
Sharp-eyed readers may wonder if Connecticut and Vermont are showing larger declines than most other states because those two states have “unified” prison and jail systems, and pretrial populations typically respond to policy changes more quickly than prisons. However, data from both states show that the bulk of their population reduction is coming from within the “sentenced” portion of their populations. (For the Connecticut data, see the Correctional Facility Population Count Report, and for Vermont, see the daily population reports.)
Many states’ prison populations are the lowest they’ve been in decades,but this is not because more people are being released from prisons. The limited data available from a handful of states shows that the number of prison releases did not change much between 2019 and 2020, suggesting that most of the population drops that we’ve seen over the past year are due to reduced prison admissions. (Certainly, reducing the number of people admitted to correctional facilities is critical to reducing the number of people behind bars, but to quickly decarcerate, states should be releasing far more people, too.)
Figure 2. These four states publish monthly release and admission data for 2018, 2019, and most of 2020. Although we cannot be certain that this analysis is representative of the other 42 state prison systems and the federal Bureau of Prisons, these data do begin to show us a pattern of responses to the COVID-19 pandemic: reducing prison admissions, while maintaining the status quo of prison releases. (We’ll be collecting this data going forward and in additional states to build an even more comprehensive picture of how federal and state prison systems have responded to COVID-19.)
Figure 3. These eight states published monthly release data for 2019 and for most of 2020. While not nationally representative, these eight states show that fewer people have been released from these state prisons in response to COVID-19 than in the previous year.
Thankfully, some states have recognized the inefficiency of case-by-case releases and the necessity of larger-scale releases. For example, in New Jersey, Governor Phil Murphy signed bill S2519 in October, which allowed for the early release of people with less than a year left on their sentences.1 A few weeks after the bill was signed, more than 2,000 people were released from New Jersey state prisons on November 4th.2
Jails
Jail populations, like prison populations, are lower now than they were pre-pandemic. Initially, many local officials — including sheriffs, prosecutors, and judges — responded quickly to COVID-19 and reduced their jail populations. In a national sample of 429 county jails of varying sizes, most (87%) decreased their populations from March to July, resulting in an average population reduction of 23% across all 429 jails.3 These population reductions came as the result of various policy changes, including police issuing citations in lieu of arrests, prosecutors declining to charge people for “low-level offenses,” courts reducing cash bail amounts, and jail administrators releasing people detained pretrial or those serving short sentences for “nonviolent” offenses.
But the data now tells a different story about the latter part of the pandemic. Since July, 66% of the jails in our sample had population increases, suggesting that the early reforms instituted to mitigate COVID-19 have largely been abandoned. For example, by mid-April, the Philadelphia city jail population reportedly dropped by more than 17% after city police suspended low-level arrests and judges released “certain nonviolent detainees” jailed for “low-level charges.” But on May 1st — as the pandemic raged on — the Philadelphia police force announced that they would resume arrests for property crimes, effectively reversing the earlier reduction efforts. Similarly, on July 10th, the sheriff of Jefferson County (Birmingham), Alabama, announced that the jail would limit admissions to only “violent felons that cannot make bond.”4 That effort was quickly abandoned when the jail resumed normal admission operations just one week later. The increasing jail populations across the country suggest that after the first wave of responses to COVID-19, many local officials have allowed jail admissions to return to business as usual.
Figure 4. Despite the rising national case rate of COVID-19, the number of people held in our sample of 429 county jails across the country has not continued to decrease over the past six months, following early initial reductions. This graph contains aggregated data collected by NYU’s Public Safety Lab and updates a graph in our December 2nd briefing. It Includes all jails where the Lab was able to report data on March 10th and for at least 75% of the days in our research period, which ended Jan. 20, 2021. (The Public Safety Lab is continuing to add more jails to its data collection and data is not available for all facilities for all days.) This graph presents the data as 7-day rolling averages, which smooths out most of the variations caused by individual facilities not reporting population data on particular days. The temporary population drops during the last weeks of May,August, and November are the result of more facilities than usual not being included in the dataset for various reasons, rather than any known policy changes. To see county level data for all 429 jails included in this analysis, see Appendix B.
Why is it so hard to identify the cause of population shifts?
Even under normal circumstances, prison and jail populations fluctuate frequently due to a variety of factors, making it difficult to pinpoint what is causing specific changes. In a way, visualizing shifts in the number of people confined is a bit like talking about how much water is in a bathtub that has multiple faucets and multiple drains, each controlled by different people who don’t necessarily communicate with each other. Measuring the depth of the water (or the number of people locked up) is easy, but determining why the water level changes is complicated. The criminal justice system is not so different, in that different agencies affect the number of incoming incarcerated admissions via arrest, prosecution, conviction, and sentencing policies. At the same time, there are many ways that people can leave prison or jail, too — which are also controlled by various agencies — such as release without bail, maxing out a sentence, parole, clemency (including mass clemencies), retroactive sentence reductions by a legislature, compassionate release, or death.
During the COVID-19 pandemic, the number of people incarcerated across the country is clearly down, but it is not immediately clear how much of that reduction we can attribute to admission mechanisms, as opposed to release mechanisms. For example, changes to the admission mechanisms that we have seen enacted to reduce jail and prison populations include:
Reduced arrests,
Fewer prosecutions,
Slower — or even suspended — court systems, and
Fewer incarcerations for probation and parole violations.
On the other hand, public health officials have emphasized the need to increase the number of people being released from prison and jail. These releases can occur via changes to any number of release mechanisms, including:
Reduced pretrial detention,
Increased commutations and pardons,
Adding good time credits to hasten release dates,
Judicial orders for administrative releases, and
Releases for people who are:
Nearing the end of their sentence in prisons or jails,
Serving short sentences for misdemeanors in jails, and
Medically vulnerable to COVID-19.
Prisons and jails are notoriously dangerous places during a viral outbreak, and continue to be a major source of a large number of infections in the U.S. The COVID-19 death rate in prisons is three times higher than among the general U.S. population, even when adjusted for age and sex (as the prison population is disproportionately young and male). Since the early days of the pandemic, public health professionals, corrections officials, and criminal justice reform advocates have agreed that decarceration is necessary to protect incarcerated people and the community at large from COVID-19. The best way to decarcerate is to release more people from prisons and jails. Despite this knowledge, state, federal, and local authorities have failed to release people from prisons and jails on a major scale, which continues to put incarcerated people’s lives at risk — and by extension, the lives of everyone in the communities where incarcerated people eventually return, and where correctional staff live and work.
Footnotes
New Jersey is not included in the above graph of state prison population changes because the New Jersey Department of Correction has not published monthly population data for 2020. However, in an October 2020 press release (prior to the November implementation of bill S2519), Governor Phil Murphy claimed the population in state correctional facilities had “decreased by nearly 3,000 people (16%)” since March. ↩
Unfortunately, this major victory for public health was immediately undercut by the federal Immigration and Custom Enforcement (ICE) agency which quickly arrested 88 people who were released under bill S2519. A spokesperson from ICE claimed that these 88 individuals were “violent offenders or have convictions for serious crimes such as homicide, aggravated assault, drug trafficking and child sexual exploitation.” However, these claims are brought into question when considering that the releases that took place under bill S2519 specifically excluded “people serving time for murder or sexual assault” and those serving time for sexual offenses. Although we did not include ICE facilities in our analysis, there is evidence that ICE detention facilities have a COVID-19 case rate that is up to 13 times higher than that of the general U.S. population. ↩
Our analysis is based on a subset of the excellent dataset created by the NYU Public Safety Lab Jail Data Initiative which is collecting jail populations for a diverse group of over 1,000 facilities across the country. For each of our analyses of jail and prison populations during the pandemic (including our earlier analyses in May, August, September, and December 2020), we included all jails from this database that had population data available for at least 75% of the days in the period being studied and had data going back to the start of the pandemic on March 10th, 2020. For this January 2021 analysis, we included all 429 jails that had at least 237 days worth of data, representing at least 75% of the days between March 10th, 2020 and January 20th, 2021. ↩
The news story from Jefferson County does not make clear whether officials are using “violent” to refer to the crime a person is charged with, crimes of which they have already convicted, a label imposed on them by a risk assessment tool, or something else. ↩
Appendix A: State and federal prison populations during COVID‑19
Prison populations for the federal Bureau of Prisons and 30 states where monthly data was readily available for the period from January 2020 to January 2021.
Appendix B: County jail populations during COVID-19
This table shows the jail populations for 429 county jails where data was available where data was available for March 10th (the day the pandemic was declared) and for 75% of the days between March 10th, 2020 and January 20th, 2021. (This table is a subset of the population data available for over 1,000 local jails from the NYU Public Safety Lab Jail Data Initiative.)
County
State
March population
July population
Most recent population
Percent change from March to July
Percent change from July to the most recent date
Net percent change since March
March date
July date
Most recent date
Autauga
Ala.
171
169
187
-1%
11%
9%
3/10/20
7/6/20
1/20/21
Blount
Ala.
125
117
156
-6%
33%
25%
3/10/20
7/6/20
1/20/21
Chambers
Ala.
134
68
2
-49%
-97%
-99%
3/10/20
7/6/20
1/20/21
Cherokee
Ala.
110
66
91
-40%
38%
-17%
3/10/20
7/6/20
1/20/21
Clay
Ala.
38
34
34
-11%
0%
-11%
3/10/20
7/6/20
1/20/21
Cleburne
Ala.
84
61
60
-27%
-2%
-29%
3/10/20
7/6/20
1/20/21
Coffee
Ala.
127
76
99
-40%
30%
-22%
3/10/20
7/6/20
1/20/21
Coosa
Ala.
27
32
22
19%
-31%
-19%
3/10/20
7/6/20
1/20/21
Dale
Ala.
74
69
54
-7%
-22%
-27%
3/10/20
7/6/20
1/20/21
DeKalb
Ala.
167
164
173
-2%
5%
4%
3/10/20
7/6/20
1/20/21
Franklin
Ala.
121
87
79
-28%
-9%
-35%
3/10/20
7/6/20
1/20/21
Houston
Ala.
393
324
377
-18%
16%
-4%
3/10/20
7/6/20
1/20/21
Jackson
Ala.
177
183
217
3%
19%
23%
3/10/20
7/6/20
1/20/21
Marion
Ala.
131
139
151
6%
9%
15%
3/10/20
7/6/20
1/20/21
Morgan
Ala.
615
554
574
-10%
4%
-7%
3/10/20
7/6/20
1/20/21
Pickens
Ala.
106
117
119
10%
2%
12%
3/10/20
7/6/20
1/20/21
Pike
Ala.
62
34
56
-45%
65%
-10%
3/10/20
7/6/20
1/20/21
Randolph
Ala.
64
49
66
-23%
35%
3%
3/10/20
7/6/20
1/20/21
St Clair
Ala.
219
229
188
5%
-18%
-14%
3/10/20
7/6/20
1/20/21
Talladega
Ala.
301
224
305
-26%
36%
1%
3/10/20
7/6/20
1/20/21
Washington
Ala.
58
38
32
-34%
-16%
-45%
3/10/20
7/6/20
1/20/21
Baxter
Ark.
120
86
120
-28%
40%
0%
3/10/20
7/6/20
1/20/21
Boone
Ark.
103
74
103
-28%
39%
0%
3/10/20
7/6/20
1/20/21
Columbia
Ark.
78
28
48
-64%
71%
-38%
3/10/20
7/6/20
1/20/21
Crawford
Ark.
215
166
232
-23%
40%
8%
3/10/20
7/6/20
1/20/21
Cross
Ark.
69
61
52
-12%
-15%
-25%
3/10/20
7/6/20
1/20/21
Drew
Ark.
63
34
45
-46%
32%
-29%
3/10/20
7/6/20
1/20/21
Faulkner
Ark.
466
218
367
-53%
68%
-21%
3/10/20
7/6/20
1/20/21
Franklin
Ark.
36
24
86
-33%
258%
139%
3/10/20
7/6/20
1/20/21
Hempstead
Ark.
68
53
63
-22%
19%
-7%
3/10/20
7/6/20
1/20/21
Howard
Ark.
41
15
23
-63%
53%
-44%
3/10/20
7/6/20
1/20/21
Jefferson
Ark.
293
173
180
-41%
4%
-39%
3/10/20
7/6/20
1/20/21
Johnson
Ark.
63
37
75
-41%
103%
19%
3/10/20
7/6/20
1/20/21
Marion
Ark.
42
22
74
-48%
236%
76%
3/10/20
7/6/20
1/20/21
Monroe
Ark.
16
12
12
-25%
0%
-25%
3/10/20
7/6/20
1/20/21
Nevada
Ark.
55
33
51
-40%
55%
-7%
3/10/20
7/6/20
1/20/21
Poinsett
Ark.
80
49
71
-39%
45%
-11%
3/10/20
7/6/20
1/20/21
Pope
Ark.
193
134
163
-31%
22%
-16%
3/10/20
7/6/20
1/20/21
Saline
Ark.
233
131
177
-44%
35%
-24%
3/10/20
7/6/20
1/20/21
St Francis
Ark.
71
35
30
-51%
-14%
-58%
3/10/20
7/6/20
1/20/21
Stone
Ark.
36
37
33
3%
-11%
-8%
3/10/20
7/6/20
1/20/21
Union
Ark.
199
137
158
-31%
15%
-21%
3/10/20
7/6/20
1/20/21
Van Buren
Ark.
78
29
34
-63%
17%
-56%
3/10/20
7/6/20
1/20/21
Washington
Ark.
678
405
572
-40%
41%
-16%
3/10/20
7/6/20
1/20/21
White
Ark.
277
80
210
-71%
163%
-24%
3/10/20
7/6/20
1/20/21
Yavapai
Ariz.
537
448
468
-17%
4%
-13%
3/10/20
7/6/20
1/20/21
Yuma
Ariz.
427
366
460
-14%
26%
8%
3/10/20
7/6/20
1/20/21
El Dorado
Calif.
383
324
332
-15%
2%
-13%
3/10/20
7/6/20
1/20/21
Siskiyou
Calif.
91
80
69
-12%
-14%
-24%
3/10/20
7/6/20
1/20/21
Stanislaus
Calif.
1343
1043
1165
-22%
12%
-13%
3/10/20
7/13/20*
1/20/21
Yuba
Calif.
383
219
229
-43%
5%
-40%
3/10/20
7/6/20
1/20/21
Arapahoe
Colo.
1123
681
813
-39%
19%
-28%
3/10/20
7/6/20
1/20/21
Bent
Colo.
55
31
63
-44%
103%
15%
3/10/20
7/6/20
1/20/21
Boulder
Colo.
647
410
390
-37%
-5%
-40%
3/10/20
7/6/20
1/20/21
Douglas
Colo.
339
216
257
-36%
19%
-24%
3/10/20
7/6/20
1/20/21
Jefferson
Colo.
1258
642
775
-49%
21%
-38%
3/10/20
7/6/20
1/20/21
Pueblo
Colo.
643
388
409
-40%
5%
-36%
3/10/20
7/6/20
1/20/21
Alachua
Fla.
729
669
806
-8%
20%
11%
3/10/20
7/6/20
1/20/21
Broward
Fla.
1706
1580
1711
-7%
8%
0%
3/10/20
7/6/20
1/20/21
Clay
Fla.
418
437
423
5%
-3%
1%
3/10/20
7/6/20
1/20/21
DeSoto
Fla.
147
161
161
10%
0%
10%
3/10/20
7/6/20
1/20/21
Flagler
Fla.
203
175
200
-14%
14%
-1%
3/10/20
7/6/20
1/20/21
Lake
Fla.
18
10
26
-44%
160%
44%
3/10/20
7/6/20
1/20/21
Monroe
Fla.
510
394
460
-23%
17%
-10%
3/10/20
7/6/20
1/20/21
Nassau
Fla.
236
172
231
-27%
34%
-2%
3/10/20
7/6/20
1/20/21
Okeechobee
Fla.
256
249
283
-3%
14%
11%
3/10/20
7/6/20
1/20/21
Sarasota
Fla.
866
779
874
-10%
12%
1%
3/10/20
7/6/20
1/20/21
St Lucie
Fla.
1303
1218
1323
-7%
9%
2%
3/10/20
7/6/20
1/20/21
Walton
Fla.
435
405
442
-7%
9%
2%
3/10/20
7/6/20
1/20/21
Bartow
Ga.
671
531
589
-21%
11%
-12%
3/10/20
7/6/20
1/20/21
Berrien
Ga.
96
69
80
-28%
16%
-17%
3/10/20
7/6/20
1/20/21
Brantley
Ga.
122
124
104
2%
-16%
-15%
3/10/20
7/6/20
1/20/21
Bulloch
Ga.
343
254
320
-26%
26%
-7%
3/10/20
7/6/20
1/20/21
Burke
Ga.
106
93
111
-12%
19%
5%
3/10/20
7/6/20
1/20/21
Camden
Ga.
112
132
137
18%
4%
22%
3/10/20
7/6/20
1/20/21
Carroll
Ga.
441
302
383
-32%
27%
-13%
3/10/20
7/6/20
1/20/21
Catoosa
Ga.
228
129
208
-43%
61%
-9%
3/10/20
7/6/20
1/20/21
Columbia
Ga.
276
182
204
-34%
12%
-26%
3/10/20
7/6/20
1/20/21
Coweta
Ga.
412
247
333
-40%
35%
-19%
3/10/20
7/6/20
1/20/21
Decatur
Ga.
116
117
143
1%
22%
23%
3/10/20
7/6/20
1/20/21
Dodge
Ga.
123
116
121
-6%
4%
-2%
3/10/20
7/6/20
1/20/21
Dougherty
Ga.
579
414
528
-28%
28%
-9%
3/10/20
7/6/20
1/20/21
Douglas
Ga.
681
344
369
-49%
7%
-46%
3/10/20
7/6/20
1/20/21
Effingham
Ga.
236
142
153
-40%
8%
-35%
3/10/20
7/6/20
1/20/21
Elbert
Ga.
95
48
65
-49%
35%
-32%
3/10/20
7/6/20
1/20/21
Fayette
Ga.
205
127
190
-38%
50%
-7%
3/10/20
7/6/20
1/20/21
Floyd
Ga.
639
471
525
-26%
11%
-18%
3/10/20
7/6/20
1/20/21
Gordon
Ga.
290
239
268
-18%
12%
-8%
3/10/20
7/6/20
1/20/21
Habersham
Ga.
162
114
132
-30%
16%
-19%
3/10/20
7/6/20
1/20/21
Haralson
Ga.
184
116
191
-37%
65%
4%
3/10/20
7/6/20
1/20/21
Jackson
Ga.
143
111
186
-22%
68%
30%
3/10/20
7/6/20
1/20/21
Lamar
Ga.
58
38
47
-34%
24%
-19%
3/10/20
7/6/20
1/20/21
Laurens
Ga.
337
285
292
-15%
2%
-13%
3/10/20
7/6/20
1/20/21
Liberty
Ga.
209
176
198
-16%
13%
-5%
3/10/20
7/6/20
1/20/21
Monroe
Ga.
128
102
143
-20%
40%
12%
3/10/20
7/6/20
1/20/21
Polk
Ga.
179
156
106
-13%
-32%
-41%
3/10/20
7/6/20
1/20/21
Rabun
Ga.
108
60
71
-44%
18%
-34%
3/10/20
7/6/20
1/20/21
Richmond
Ga.
1021
891
973
-13%
9%
-5%
3/10/20
7/6/20
1/20/21
Spalding
Ga.
386
260
349
-33%
34%
-10%
3/10/20
7/6/20
1/20/21
Sumter
Ga.
157
129
148
-18%
15%
-6%
3/10/20
7/6/20
1/20/21
Tattnall
Ga.
87
36
76
-59%
111%
-13%
3/10/20
7/6/20
1/20/21
Turner
Ga.
67
61
48
-9%
-21%
-28%
3/10/20
7/6/20
1/20/21
Union
Ga.
49
39
49
-20%
26%
0%
3/10/20
7/6/20
1/20/21
Upson
Ga.
103
59
93
-43%
58%
-10%
3/10/20
7/6/20
1/20/21
Ware
Ga.
419
340
442
-19%
30%
5%
3/10/20
7/6/20
1/20/21
Washington
Ga.
78
76
90
-3%
18%
15%
3/10/20
7/6/20
1/20/21
Whitfield
Ga.
484
336
424
-31%
26%
-12%
3/10/20
7/6/20
1/20/21
Worth
Ga.
69
85
72
23%
-15%
4%
3/10/20
7/6/20
1/20/21
Buena Vista
Iowa
22
7
14
-68%
100%
-36%
3/10/20
7/6/20
1/20/21
Cerro Gordo
Iowa
68
39
48
-43%
23%
-29%
3/10/20
7/6/20
1/20/21
Clinton
Iowa
59
35
61
-41%
74%
3%
3/10/20
7/6/20
1/20/21
Dallas
Iowa
27
36
35
33%
-3%
30%
3/10/20
7/6/20
1/20/21
Dickinson
Iowa
13
7
6
-46%
-14%
-54%
3/10/20
7/6/20
1/20/21
Hardin
Iowa
84
79
64
-6%
-19%
-24%
3/10/20
7/6/20
1/20/21
Ida
Iowa
7
1
5
-86%
400%
-29%
3/10/20
7/6/20
1/20/21
Lyon
Iowa
14
9
4
-36%
-56%
-71%
3/10/20
7/6/20
1/20/21
Plymouth
Iowa
41
28
0
-32%
-100%
-100%
3/10/20
7/6/20
1/20/21
Polk
Iowa
885
542
726
-39%
34%
-18%
3/10/20
7/6/20
1/5/21
Story
Iowa
70
25
68
-64%
172%
-3%
3/10/20
7/6/20
1/20/21
Worth
Iowa
8
1
2
-88%
100%
-75%
3/10/20
7/6/20
1/20/21
Blaine
Idaho
64
50
13
-22%
-74%
-80%
3/10/20
7/6/20
1/20/21
Bonneville
Idaho
392
275
244
-30%
-11%
-38%
3/10/20
7/6/20
1/20/21
Canyon
Idaho
445
383
355
-14%
-7%
-20%
3/10/20
7/6/20
1/20/21
Nez Perce
Idaho
128
79
86
-38%
9%
-33%
3/10/20
7/6/20
1/20/21
Power
Idaho
14
13
5
-7%
-62%
-64%
3/10/20
7/6/20
1/20/21
Washington
Idaho
40
39
33
-3%
-15%
-18%
3/10/20
7/6/20
1/20/21
Kendall
Ill.
156
137
146
-12%
7%
-6%
3/10/20
7/6/20
1/20/21
Macon
Ill.
300
261
302
-13%
16%
1%
3/10/20
7/6/20
1/20/21
Moultrie
Ill.
24
28
36
17%
29%
50%
3/10/20
7/6/20
1/20/21
Randolph
Ill.
25
24
19
-4%
-21%
-24%
3/10/20
7/6/20
1/20/21
Will
Ill.
687
580
609
-16%
5%
-11%
3/10/20
7/6/20
1/20/21
Woodford
Ill.
52
56
72
8%
29%
38%
3/10/20
7/6/20
1/20/21
Clinton
Ind.
151
119
158
-21%
33%
5%
3/10/20
7/6/20
1/4/21
Hamilton
Ind.
294
227
291
-23%
28%
-1%
3/10/20
7/6/20
1/20/21
Jackson
Ind.
249
173
191
-31%
10%
-23%
3/10/20
7/6/20
1/20/21
Tippecanoe
Ind.
508
426
454
-16%
7%
-11%
3/10/20
7/6/20
1/20/21
Brown
Kan.
12
14
18
17%
29%
50%
3/10/20
7/6/20
1/20/21
Cherokee
Kan.
81
44
78
-46%
77%
-4%
3/10/20
7/6/20
1/20/21
Coffey
Kan.
28
20
0
-29%
-100%
-100%
3/10/20
7/6/20
1/20/21
Crawford
Kan.
74
49
66
-34%
35%
-11%
3/10/20
7/6/20
1/20/21
Dickinson
Kan.
20
16
4
-20%
-75%
-80%
3/10/20
7/6/20
1/20/21
Doniphan
Kan.
9
8
3
-11%
-63%
-67%
3/10/20
7/6/20
1/20/21
Finney
Kan.
95
88
58
-7%
-34%
-39%
3/10/20
7/6/20
1/20/21
Geary
Kan.
100
77
84
-23%
9%
-16%
3/10/20
7/6/20
1/20/21
Jackson
Kan.
82
55
67
-33%
22%
-18%
3/10/20
7/6/20
1/20/21
Jefferson
Kan.
28
32
16
14%
-50%
-43%
3/10/20
7/6/20
1/20/21
Pratt
Kan.
22
11
10
-50%
-9%
-55%
3/10/20
7/6/20
1/20/21
Rooks
Kan.
18
8
9
-56%
13%
-50%
3/10/20
7/6/20
1/20/21
Sherman
Kan.
18
27
17
50%
-37%
-6%
3/10/20
7/6/20
1/20/21
Sumner
Kan.
142
43
101
-70%
135%
-29%
3/10/20
7/6/20
1/20/21
Thomas
Kan.
14
9
10
-36%
11%
-29%
3/10/20
7/6/20
1/20/21
Trego
Kan.
11
3
6
-73%
100%
-45%
3/10/20
7/6/20
1/20/21
Wabaunsee
Kan.
9
5
5
-44%
0%
-44%
3/10/20
7/6/20
1/20/21
Woodson
Kan.
9
8
5
-11%
-38%
-44%
3/10/20
7/6/20
1/20/21
Boone
Ky.
453
370
467
-18%
26%
3%
3/10/20
7/6/20
1/20/21
Christian
Ky.
768
522
602
-32%
15%
-22%
3/10/20
7/6/20
1/20/21
Letcher
Ky.
108
92
98
-15%
7%
-9%
3/10/20
7/6/20
1/20/21
Todd
Ky.
135
81
115
-40%
42%
-15%
3/10/20
7/6/20
1/20/21
Allen
La.
102
62
58
-39%
-6%
-43%
3/10/20
7/6/20
1/20/21
Assumption
La.
101
94
133
-7%
41%
32%
3/10/20
7/6/20
1/20/21
Avoyelles
La.
424
332
301
-22%
-9%
-29%
3/10/20
7/6/20
1/20/21
Beauregard
La.
161
137
165
-15%
20%
2%
3/10/20
7/6/20
1/20/21
Bienville
La.
41
29
22
-29%
-24%
-46%
3/10/20
7/6/20
1/20/21
Bogalusa City
La.
18
14
15
-22%
7%
-17%
3/10/20
7/6/20
1/20/21
Caldwell
La.
610
502
572
-18%
14%
-6%
3/10/20
7/6/20
1/20/21
Cameron
La.
27
20
13
-26%
-35%
-52%
3/10/20
7/6/20
1/20/21
Catahoula
La.
72
47
52
-35%
11%
-28%
3/10/20
7/6/20
1/20/21
Claiborne
La.
575
465
400
-19%
-14%
-30%
3/10/20
7/6/20
1/20/21
East Feliciana
La.
244
215
233
-12%
8%
-5%
3/10/20
7/6/20
1/20/21
Evangeline
La.
74
51
59
-31%
16%
-20%
3/10/20
7/6/20
1/20/21
Franklin
La.
815
680
808
-17%
19%
-1%
3/10/20
7/6/20
1/20/21
Hammond City
La.
14
11
9
-21%
-18%
-36%
3/10/20
7/6/20
1/20/21
Iberia
La.
403
326
360
-19%
10%
-11%
3/10/20
7/6/20
1/20/21
Iberville
La.
106
111
117
5%
5%
10%
3/10/20
7/6/20
1/20/21
Jackson
La.
131
120
0
-8%
-100%
-100%
3/10/20
7/6/20
1/20/21
Jefferson Davis
La.
159
70
104
-56%
49%
-35%
3/10/20
7/6/20
1/20/21
LaSalle
La.
73
58
80
-21%
38%
10%
3/10/20
7/6/20
1/20/21
Lafayette
La.
990
527
537
-47%
2%
-46%
3/10/20
7/6/20
1/20/21
Lafourche
La.
458
315
326
-31%
3%
-29%
3/10/20
7/6/20
1/20/21
Madison
La.
35
42
77
20%
83%
120%
3/10/20
7/6/20
1/20/21
Morehouse
La.
464
504
432
9%
-14%
-7%
3/10/20
7/6/20
1/20/21
Oakdale
La.
1
1
1
0%
0%
0%
3/10/20
7/6/20
1/20/21
Pointe Coupee
La.
98
79
78
-19%
-1%
-20%
3/10/20
7/6/20
1/20/21
Red River
La.
64
57
55
-11%
-4%
-14%
3/10/20
7/6/20
1/20/21
Richland
La.
751
583
678
-22%
16%
-10%
3/10/20
7/6/20
1/20/21
Sabine
La.
203
169
185
-17%
9%
-9%
3/10/20
7/6/20
1/20/21
Shreveport
La.
63
12
26
-81%
117%
-59%
3/10/20
7/6/20
1/20/21
St Charles
La.
458
417
406
-9%
-3%
-11%
3/10/20
7/6/20
1/20/21
St James
La.
68
39
55
-43%
41%
-19%
3/10/20
7/6/20
1/20/21
St John
La.
146
122
74
-16%
-39%
-49%
3/10/20
7/6/20
1/20/21
St Mary
La.
223
165
184
-26%
12%
-17%
3/10/20
7/6/20
1/20/21
Sulphur
La.
11
17
14
55%
-18%
27%
3/10/20
7/6/20
1/20/21
Tangipahoa
La.
572
465
573
-19%
23%
0%
3/10/20
7/6/20
1/20/21
Tensas
La.
18
19
15
6%
-21%
-17%
3/10/20
7/6/20
1/20/21
Terrebonne
La.
645
502
536
-22%
7%
-17%
3/10/20
7/6/20
1/20/21
Vermilion
La.
146
134
160
-8%
19%
10%
3/10/20
7/6/20
1/20/21
Vernon
La.
131
101
121
-23%
20%
-8%
3/10/20
7/6/20
1/20/21
Ville Platte
La.
16
6
12
-63%
100%
-25%
3/10/20
7/6/20
1/20/21
Washington
La.
163
138
175
-15%
27%
7%
3/10/20
7/6/20
1/20/21
Webster
La.
627
550
583
-12%
6%
-7%
3/10/20
7/6/20
1/20/21
West Baton Rouge
La.
320
251
262
-22%
4%
-18%
3/10/20
7/6/20
1/20/21
West Feliciana
La.
25
15
116
-40%
673%
364%
3/10/20
7/6/20
1/20/21
Winnfield
La.
24
20
4
-17%
-80%
-83%
3/10/20
7/6/20
1/20/21
Worcester
Mass.
766
465
515
-39%
11%
-33%
3/10/20
7/6/20
1/20/21
Allegany
Md.
189
141
125
-25%
-11%
-34%
3/10/20
7/6/20
1/20/21
Prince Georges
Md.
884
749
976
-15%
30%
10%
3/10/20
7/6/20
1/20/21
Cumberland
Maine
349
299
306
-14%
2%
-12%
3/10/20
7/6/20
1/20/21
Wayne
Mich.
2086
2157
3041
3%
41%
46%
3/10/20
7/6/20
1/20/21
Beltrami
Minn.
113
91
86
-19%
-5%
-24%
3/10/20
7/6/20
1/20/21
Blue Earth
Minn.
114
68
65
-40%
-4%
-43%
3/10/20
7/6/20
1/20/21
Carlton
Minn.
33
14
23
-58%
64%
-30%
3/10/20
7/6/20
1/20/21
Chisago
Minn.
61
25
35
-59%
40%
-43%
3/10/20
7/6/20
1/20/21
Clay
Minn.
117
69
92
-41%
33%
-21%
3/10/20
7/6/20
1/20/21
Clearwater
Minn.
17
12
13
-29%
8%
-24%
3/10/20
7/6/20
1/20/21
Crow Wing
Minn.
155
96
99
-38%
3%
-36%
3/10/20
7/6/20
1/20/21
Fillmore
Minn.
7
10
2
43%
-80%
-71%
3/10/20
7/6/20
1/20/21
Hubbard
Minn.
63
40
53
-37%
33%
-16%
3/10/20
7/6/20
1/20/21
Isanti
Minn.
57
31
25
-46%
-19%
-56%
3/10/20
7/6/20
1/20/21
Kanabec
Minn.
45
18
14
-60%
-22%
-69%
3/10/20
7/6/20
1/20/21
Kandiyohi
Minn.
91
79
46
-13%
-42%
-49%
3/10/20
7/6/20
1/20/21
Lac Qui Parle
Minn.
4
5
4
25%
-20%
0%
3/10/20
7/6/20
1/20/21
Le Sueur
Minn.
23
12
15
-48%
25%
-35%
3/10/20
7/6/20
1/20/21
McLeod
Minn.
36
22
24
-39%
9%
-33%
3/10/20
7/6/20
1/20/21
Mille Lacs
Minn.
79
51
36
-35%
-29%
-54%
3/10/20
7/6/20
1/20/21
Morrison
Minn.
31
20
24
-35%
20%
-23%
3/10/20
7/6/20
1/20/21
Mower
Minn.
79
57
51
-28%
-11%
-35%
3/10/20
7/6/20
11/13/20
Nicollet
Minn.
26
12
11
-54%
-8%
-58%
3/10/20
7/6/20
1/20/21
Pennington
Minn.
34
31
43
-9%
39%
26%
3/10/20
7/6/20
1/20/21
Pipestone
Minn.
14
10
9
-29%
-10%
-36%
3/10/20
6/23/20*
1/20/21
Redwood
Minn.
12
13
16
8%
23%
33%
3/10/20
7/6/20
1/20/21
Renville
Minn.
39
15
19
-62%
27%
-51%
3/10/20
7/6/20
1/20/21
Roseau
Minn.
21
10
9
-52%
-10%
-57%
3/10/20
7/6/20
1/20/21
Scott
Minn.
140
57
96
-59%
68%
-31%
3/10/20
7/6/20
1/20/21
Sherburne
Minn.
307
259
228
-16%
-12%
-26%
3/10/20
7/6/20
1/20/21
Sibley
Minn.
9
4
8
-56%
100%
-11%
3/10/20
7/6/20
1/20/21
Swift
Minn.
4
4
4
0%
0%
0%
3/10/20
7/6/20
1/20/21
Todd
Minn.
21
9
15
-57%
67%
-29%
3/10/20
7/6/20
1/20/21
Winona
Minn.
30
22
20
-27%
-9%
-33%
3/10/20
7/6/20
1/20/21
Wright
Minn.
182
91
151
-50%
66%
-17%
3/10/20
7/6/20
1/20/21
Yellow Medicine
Minn.
15
13
9
-13%
-31%
-40%
3/10/20
7/6/20
1/20/21
Barry
Mo.
45
44
57
-2%
30%
27%
3/10/20
7/6/20
1/20/21
Benton
Mo.
35
20
30
-43%
50%
-14%
3/10/20
7/6/20
1/20/21
Boone
Mo.
252
202
254
-20%
26%
1%
3/10/20
7/6/20
1/20/21
Buchanan
Mo.
217
165
202
-24%
22%
-7%
3/10/20
7/6/20
1/20/21
Cape Girardeau
Mo.
148
151
203
2%
34%
37%
3/10/20
6/11/20*
1/20/21
Clay
Mo.
300
215
197
-28%
-8%
-34%
3/10/20
7/6/20
1/20/21
Jackson
Mo.
839
697
770
-17%
10%
-8%
3/10/20
7/6/20
1/20/21
Jasper
Mo.
200
168
190
-16%
13%
-5%
3/10/20
7/6/20
1/20/21
Johnson
Mo.
202
86
120
-57%
40%
-41%
3/10/20
7/6/20
1/20/21
Joplin
Mo.
56
28
45
-50%
61%
-20%
3/10/20
7/6/20
1/20/21
Lawrence
Mo.
77
76
73
-1%
-4%
-5%
3/10/20
7/6/20
1/20/21
Lewis
Mo.
8
7
13
-13%
86%
63%
3/10/20
7/6/20
1/20/21
Marion
Mo.
79
58
79
-27%
36%
0%
3/10/20
7/6/20
1/20/21
Morgan
Mo.
79
63
122
-20%
94%
54%
3/10/20
7/6/20
1/20/21
Nodaway
Mo.
12
10
18
-17%
80%
50%
3/10/20
7/6/20
1/20/21
Stone
Mo.
65
69
39
6%
-43%
-40%
3/10/20
7/6/20
1/20/21
Adams
Miss.
76
78
72
3%
-8%
-5%
3/10/20
7/6/20
1/20/21
Clay
Miss.
68
51
69
-25%
35%
1%
3/10/20
7/6/20
1/20/21
Jackson
Miss.
338
370
359
9%
-3%
6%
3/10/20
7/6/20
1/20/21
Jasper
Miss.
30
24
21
-20%
-13%
-30%
3/10/20
7/6/20
1/20/21
Kemper
Miss.
380
369
338
-3%
-8%
-11%
3/10/20
7/6/20
1/20/21
Lee
Miss.
194
201
250
4%
24%
29%
3/10/20
7/6/20
1/20/21
Tunica
Miss.
27
23
22
-15%
-4%
-19%
3/10/20
7/6/20
1/20/21
Broadwater
Mont.
47
32
42
-32%
31%
-11%
3/10/20
7/6/20
1/20/21
Lewis and Clark
Mont.
102
109
104
7%
-5%
2%
3/10/20
7/6/20
1/20/21
Ravalli
Mont.
41
47
50
15%
6%
22%
3/10/20
7/6/20
1/20/21
Rosebud
Mont.
11
10
10
-9%
0%
-9%
3/10/20
7/13/20*
1/20/21
Valley
Mont.
40
28
21
-30%
-25%
-48%
3/10/20
7/6/20
1/20/21
Alamance
N.C.
361
217
239
-40%
10%
-34%
3/10/20
7/6/20
1/20/21
Anson
N.C.
49
45
49
-8%
9%
0%
3/10/20
7/6/20
1/20/21
Brunswick
N.C.
244
163
218
-33%
34%
-11%
3/10/20
7/6/20
1/20/21
Burke
N.C.
133
118
112
-11%
-5%
-16%
3/10/20
7/6/20
1/20/21
Cabarrus
N.C.
323
195
195
-40%
0%
-40%
3/10/20
7/6/20
1/20/21
Carteret
N.C.
165
109
200
-34%
83%
21%
3/10/20
7/6/20
1/20/21
Catawba
N.C.
302
216
215
-28%
0%
-29%
3/10/20
7/6/20
1/20/21
Cleveland
N.C.
324
184
218
-43%
18%
-33%
3/10/20
7/6/20
1/20/21
Davidson
N.C.
340
207
229
-39%
11%
-33%
3/10/20
7/6/20
1/20/21
Guilford
N.C.
1051
780
719
-26%
-8%
-32%
3/10/20
7/6/20
1/20/21
Lee
N.C.
119
93
109
-22%
17%
-8%
3/10/20
7/6/20
1/20/21
Lincoln
N.C.
148
69
102
-53%
48%
-31%
3/10/20
7/6/20
1/20/21
Moore
N.C.
138
105
142
-24%
35%
3%
3/10/20
7/6/20
1/20/21
New Hanover
N.C.
444
358
402
-19%
12%
-9%
3/10/20
7/6/20
1/20/21
Pender
N.C.
88
71
79
-19%
11%
-10%
3/10/20
7/6/20
1/20/21
Randolph
N.C.
255
201
213
-21%
6%
-16%
3/10/20
7/6/20
1/20/21
Richmond
N.C.
114
77
77
-32%
0%
-32%
3/10/20
7/6/20
1/20/21
Rowan
N.C.
341
236
245
-31%
4%
-28%
3/10/20
7/6/20
1/20/21
Sampson
N.C.
253
165
176
-35%
7%
-30%
3/10/20
7/6/20
1/20/21
Stanly
N.C.
156
96
132
-38%
38%
-15%
3/10/20
7/6/20
1/20/21
Transylvania
N.C.
77
44
35
-43%
-20%
-55%
3/10/20
7/6/20
1/20/21
Wake
N.C.
1246
1054
1141
-15%
8%
-8%
3/10/20
7/6/20
1/20/21
Washington
N.C.
459
308
285
-33%
-7%
-38%
3/10/20
7/6/20
1/20/21
Stutsman
N.D.
47
35
42
-26%
20%
-11%
3/10/20
7/6/20
1/20/21
Williams
N.D.
90
115
108
28%
-6%
20%
3/10/20
7/6/20
1/20/21
Hall
Neb.
275
206
193
-25%
-6%
-30%
3/10/20
7/6/20
1/20/21
Lancaster
Neb.
625
467
592
-25%
27%
-5%
3/10/20
7/6/20
1/20/21
Lincoln
Neb.
117
108
105
-8%
-3%
-10%
3/10/20
7/6/20
1/20/21
Burlington
N.J.
375
263
372
-30%
41%
-1%
3/10/20
7/6/20
12/3/21
Cumberland
N.J.
337
251
285
-26%
14%
-15%
3/10/20
7/6/20
1/20/21
Hunterdon
N.J.
46
27
36
-41%
33%
-22%
3/10/20
7/6/20
1/20/21
Ocean
N.J.
326
253
287
-22%
13%
-12%
3/10/20
7/6/20
1/20/21
Sussex
N.J.
75
42
59
-44%
40%
-21%
3/10/20
7/6/20
1/20/21
Bernalillo
N.M.
1680
1343
1266
-20%
-6%
-25%
3/10/20
7/6/20
12/6/20
Curry
N.M.
183
158
155
-14%
-2%
-15%
3/10/20
7/6/20
1/20/21
Hobbs
N.M.
11
21
18
91%
-14%
64%
3/10/20
7/6/20
1/20/21
Lea
N.M.
234
132
139
-44%
5%
-41%
3/10/20
7/6/20
1/20/21
San Juan
N.M.
508
318
442
-37%
39%
-13%
3/10/20
7/6/20
1/20/21
Monroe
N.Y.
766
596
735
-22%
23%
-4%
3/10/20
7/6/20
1/20/21
Clinton
Ohio
80
55
41
-31%
-25%
-49%
3/10/20
7/6/20
1/20/21
Delaware
Ohio
233
164
130
-30%
-21%
-44%
3/10/20
7/6/20
1/20/21
Erie
Ohio
129
79
86
-39%
9%
-33%
3/10/20
7/6/20
1/20/21
Franklin
Ohio
2002
1527
1638
-24%
7%
-18%
3/10/20
7/6/20
1/20/21
Guernsey
Ohio
105
89
80
-15%
-10%
-24%
3/10/20
7/6/20
1/20/21
Hamilton
Ohio
1499
1124
1349
-25%
20%
-10%
3/10/20
7/6/20
1/20/21
Morrow
Ohio
104
59
52
-43%
-12%
-50%
3/10/20
7/6/20
1/20/21
Pickaway
Ohio
119
116
85
-3%
-27%
-29%
3/10/20
7/6/20
1/20/21
Wood
Ohio
169
98
140
-42%
43%
-17%
3/10/20
7/6/20
1/20/21
Comanche
Okla.
357
273
303
-24%
11%
-15%
3/10/20
7/6/20
1/20/21
Creek
Okla.
225
144
229
-36%
59%
2%
3/10/20
7/6/20
1/20/21
Garvin
Okla.
67
57
67
-15%
18%
0%
3/10/20
7/6/20
1/20/21
Mayes
Okla.
77
97
79
26%
-19%
3%
3/10/20
7/6/20
1/20/21
McClain
Okla.
96
64
71
-33%
11%
-26%
3/10/20
7/6/20
1/20/21
Okmulgee
Okla.
174
212
144
22%
-32%
-17%
3/10/20
7/6/20
1/20/21
Pottawatomie
Okla.
203
191
215
-6%
13%
6%
3/10/20
7/6/20
1/20/21
Baker
Ore.
32
14
22
-56%
57%
-31%
3/10/20
7/6/20
1/20/21
Clackamas
Ore.
427
186
232
-56%
25%
-46%
3/10/20
7/6/20
1/20/21
Clatsop
Ore.
56
43
52
-23%
21%
-7%
3/10/20
7/6/20
1/20/21
Douglas
Ore.
200
123
127
-39%
3%
-37%
3/10/20
7/6/20
1/20/21
Harney
Ore.
8
3
7
-63%
133%
-13%
3/10/20
7/6/20
1/20/21
Jackson
Ore.
321
260
258
-19%
-1%
-20%
3/10/20
7/6/20
1/20/21
Josephine
Ore.
185
154
100
-17%
-35%
-46%
3/10/20
7/6/20
1/20/21
Klamath
Ore.
136
68
78
-50%
15%
-43%
3/10/20
7/6/20
1/20/21
Lincoln
Ore.
161
77
99
-52%
29%
-39%
3/10/20
7/6/20
1/20/21
Marion
Ore.
420
277
311
-34%
12%
-26%
3/10/20
7/6/20
1/20/21
Marion Work Center
Ore.
90
39
42
-57%
8%
-53%
3/10/20
7/6/20
1/20/21
Multnomah
Ore.
1118
659
803
-41%
22%
-28%
3/10/20
7/6/20
1/20/21
Polk
Ore.
109
63
66
-42%
5%
-39%
3/10/20
7/6/20
1/20/21
Wasco
Ore.
132
65
74
-51%
14%
-44%
3/10/20
7/6/20
1/20/21
Washington
Ore.
874
540
462
-38%
-14%
-47%
3/10/20
7/6/20
1/20/21
Yamhill
Ore.
166
62
94
-63%
52%
-43%
3/10/20
7/6/20
1/20/21
Cumberland
Pa.
409
230
236
-44%
3%
-42%
3/10/20
7/6/20
1/20/21
Dauphin
Pa.
1110
867
1003
-22%
16%
-10%
3/10/20
7/6/20
1/20/21
Lancaster
Pa.
786
674
620
-14%
-8%
-21%
3/10/20
7/6/20
1/20/21
Anderson City
S.C.
95
84
101
-12%
20%
6%
3/10/20
7/6/20
1/20/21
Berkeley
S.C.
438
297
396
-32%
33%
-10%
3/10/20
7/6/20
1/20/21
Cherokee
S.C.
357
265
319
-26%
20%
-11%
3/10/20
7/6/20
1/20/21
Darlington
S.C.
161
128
177
-20%
38%
10%
3/10/20
7/6/20
1/20/21
Kershaw
S.C.
80
86
94
8%
9%
18%
3/10/20
7/6/20
1/20/21
Laurens
S.C.
226
162
183
-28%
13%
-19%
3/10/20
7/6/20
1/20/21
Lexington
S.C.
498
312
444
-37%
42%
-11%
3/10/20
7/6/20
1/20/21
Marion
S.C.
66
55
87
-17%
58%
32%
3/10/20
7/6/20
1/20/21
Pickens
S.C.
302
226
221
-25%
-2%
-27%
3/10/20
7/6/20
1/20/21
Sumter
S.C.
309
266
287
-14%
8%
-7%
3/10/20
7/6/20
1/20/21
York Prison
S.C.
61
7
27
-89%
286%
-56%
3/10/20
7/6/20
1/20/21
Clay
S.D.
12
14
19
17%
36%
58%
3/10/20
7/6/20
1/20/21
Blount
Tenn.
534
472
468
-12%
-1%
-12%
3/10/20
7/6/20
1/20/21
Macon
Tenn.
300
262
302
-13%
15%
1%
3/10/20
7/6/20
1/20/21
Polk
Tenn.
181
154
159
-15%
3%
-12%
3/10/20
7/6/20
1/20/21
Shelby
Tenn.
1807
1398
1225
-23%
-12%
-32%
3/10/20
7/6/20
1/20/21
Wayne
Tenn.
151
122
128
-19%
5%
-15%
3/10/20
7/6/20
1/20/21
Archer
Texas
26
30
24
15%
-20%
-8%
3/10/20
7/6/20
1/20/21
Bell
Texas
859
772
1041
-10%
35%
21%
3/10/20
7/6/20
1/20/21
Brown
Texas
161
152
162
-6%
7%
1%
3/10/20
7/6/20
1/20/21
Calhoun
Texas
76
88
88
16%
0%
16%
3/10/20
7/6/20
1/20/21
Cochran
Texas
12
13
12
8%
-8%
0%
3/10/20
7/6/20
1/20/21
Coleman
Texas
33
30
38
-9%
27%
15%
3/10/20
7/6/20
1/20/21
DeWitt
Texas
81
87
77
7%
-11%
-5%
3/10/20
7/6/20
1/20/21
Ellis
Texas
375
301
372
-20%
24%
-1%
3/10/20
7/6/20
1/20/21
Erath
Texas
79
64
68
-19%
6%
-14%
3/10/20
7/6/20
1/20/21
Galveston
Texas
991
845
983
-15%
16%
-1%
3/10/20
7/6/20
1/20/21
Hopkins
Texas
159
185
166
16%
-10%
4%
3/10/20
7/6/20
1/20/21
Jim Wells
Texas
61
56
55
-8%
-2%
-10%
3/10/20
7/6/20
1/20/21
Lavaca
Texas
25
20
11
-20%
-45%
-56%
3/10/20
7/6/20
1/20/21
Liberty
Texas
240
273
245
14%
-10%
2%
3/10/20
7/6/20
1/20/21
Lubbock
Texas
1242
1279
1218
3%
-5%
-2%
3/10/20
7/6/20
1/20/21
Milam
Texas
137
141
159
3%
13%
16%
3/10/20
7/6/20
1/20/21
Parmer
Texas
28
22
21
-21%
-5%
-25%
3/10/20
7/6/20
1/20/21
Polk
Texas
184
160
205
-13%
28%
11%
3/10/20
7/6/20
1/20/21
Randall
Texas
413
381
390
-8%
2%
-6%
3/10/20
7/6/20
1/20/21
Robertson
Texas
43
36
60
-16%
67%
40%
3/10/20
7/6/20
1/20/21
Rockwall
Texas
220
221
185
0%
-16%
-16%
3/10/20
7/6/20
1/20/21
Shelby
Texas
37
39
0
5%
-100%
-100%
3/10/20
7/6/20
1/20/21
Terry
Texas
83
89
92
7%
3%
11%
3/10/20
7/6/20
1/20/21
Titus
Texas
133
94
76
-29%
-19%
-43%
3/10/20
7/6/20
1/20/21
Tom Green
Texas
392
420
441
7%
5%
13%
3/10/20
7/6/20
1/20/21
Wharton
Texas
145
103
103
-29%
0%
-29%
3/10/20
7/6/20
1/20/21
Salt Lake
Utah
2138
1186
1439
-45%
21%
-33%
3/10/20
7/6/20
1/20/21
Sanpete
Utah
13
14
9
8%
-36%
-31%
3/10/20
7/6/20
1/20/21
Danville
Va.
363
320
312
-12%
-3%
-14%
3/10/20
7/6/20
1/20/21
Middle Peninsula
Va.
169
162
160
-4%
-1%
-5%
3/10/20
7/25/20*
1/20/21
Middle River
Va.
900
729
852
-19%
17%
-5%
3/10/20
7/6/20
1/20/21
Norfolk
Va.
935
684
981
-27%
43%
5%
3/10/20
7/6/20
1/20/21
Riverside
Va.
1360
1144
1242
-16%
9%
-9%
3/10/20
7/6/20
1/20/21
Roanoke
Va.
173
146
172
-16%
18%
-1%
3/10/20
7/6/20
1/20/21
Virginia Beach
Va.
1509
1142
1306
-24%
14%
-13%
3/10/20
7/6/20
1/13/21
Western Virginia
Va.
944
746
806
-21%
8%
-15%
3/10/20
7/6/20
1/20/21
Chelan
Wash.
190
156
154
-18%
-1%
-19%
3/10/20
7/6/20
1/20/21
Clallam Forks
Wash.
17
10
11
-41%
10%
-35%
3/10/20
7/6/20
1/20/21
Clark
Wash.
655
422
428
-36%
1%
-35%
3/10/20
7/6/20
1/20/21
Columbia
Wash.
6
10
7
67%
-30%
17%
3/10/20
7/6/20
1/20/21
Grays Harbor
Wash.
177
140
125
-21%
-11%
-29%
3/10/20
7/6/20
1/20/21
Grays Harbor Aberdeen
Wash.
20
14
6
-30%
-57%
-70%
3/10/20
7/6/20
1/20/21
Grays Harbor Hoquiam
Wash.
31
27
19
-13%
-30%
-39%
3/10/20
7/6/20
1/20/21
Island
Wash.
68
44
48
-35%
9%
-29%
3/10/20
7/6/20
1/20/21
Jefferson
Wash.
28
22
17
-21%
-23%
-39%
3/10/20
7/6/20
1/20/21
King Issaquah
Wash.
56
33
29
-41%
-12%
-48%
3/10/20
7/6/20
1/20/21
Kitsap
Wash.
379
233
277
-39%
19%
-27%
3/10/20
7/6/20
1/20/21
Lewis
Wash.
191
168
153
-12%
-9%
-20%
3/10/20
7/6/20
1/20/21
Okanogan
Wash.
159
90
99
-43%
10%
-38%
3/10/20
7/6/20
1/20/21
Skagit
Wash.
275
154
170
-44%
10%
-38%
3/10/20
7/6/20
1/20/21
Skamania
Wash.
24
22
12
-8%
-45%
-50%
3/10/20
7/6/20
12/29/20
Snohomish
Wash.
743
440
454
-41%
3%
-39%
3/10/20
7/6/20
1/20/21
Snohomish Lynnwood
Wash.
49
9
15
-82%
67%
-69%
3/10/20
7/6/20
1/20/21
Snohomish Marysville
Wash.
35
10
5
-71%
-50%
-86%
3/10/20
7/6/20
1/20/21
Thurston Olympia
Wash.
22
13
10
-41%
-23%
-55%
3/10/20
7/6/20
1/20/21
Walla Walla
Wash.
83
74
75
-11%
1%
-10%
3/10/20
7/6/20
1/20/21
Whatcom
Wash.
292
205
223
-30%
9%
-24%
3/10/20
7/6/20
1/20/21
Whitman
Wash.
31
18
33
-42%
83%
6%
3/10/20
7/6/20
1/20/21
Yakima
Wash.
871
444
585
-49%
32%
-33%
3/10/20
7/6/20
1/20/21
Brown
Wis.
699
586
692
-16%
18%
-1%
3/10/20
7/6/20
1/20/21
Douglas
Wis.
156
113
155
-28%
37%
-1%
3/10/20
7/6/20
1/20/21
Eau Claire
Wis.
273
190
197
-30%
4%
-28%
3/10/20
7/6/20
1/20/21
La Crosse
Wis.
151
96
96
-36%
0%
-36%
3/10/20
7/6/20
1/20/21
Lincoln
Wis.
104
77
90
-26%
17%
-13%
3/10/20
7/6/20
1/20/21
Manitowoc
Wis.
204
178
146
-13%
-18%
-28%
3/10/20
7/6/20
1/20/21
Milwaukee
Wis.
1920
1506
1538
-22%
2%
-20%
3/10/20
7/6/20
1/20/21
Ozaukee
Wis.
195
160
160
-18%
0%
-18%
3/10/20
7/6/20
1/20/21
Racine
Wis.
753
578
672
-23%
16%
-11%
3/10/20
7/6/20
1/20/21
Sawyer
Wis.
114
87
82
-24%
-6%
-28%
3/10/20
7/6/20
1/20/21
Sheboygan
Wis.
347
329
310
-5%
-6%
-11%
3/10/20
7/6/20
12/29/20
*Some jails did not have population data in the NYU database for the first Monday in July. We used the population for the closest date available for those jails.
Instead of releasing more people to the safety of their homes, parole boards in many states held fewer hearings and granted fewer approvals during the ongoing, deadly pandemic
Prisons have had 10 months to take measures to reduce their populations and save lives amidst the ongoing pandemic. Yet our comparison of 13 states’ parole grant rates from 2019 and 2020 reveals that many have failed to utilize parole as a mechanism for releasing more people to the safety of their homes. In over half of the states we studied—Alabama, Iowa, Michigan, Montana, New York, Oklahoma, Pennsylvania, and South Carolina – between 2019 and 2020, there was either no change or a decrease in parole grant rates (that is, the percentage of parole hearings that resulted in approvals).
Granting parole to more people should be an obvious decarceration tool for correctional systems, during both the pandemic and more ordinary times. Since parole is a preexisting system, it can be used to reduce prison populations without requiring any new laws, executive orders, or commutations. And since anyone going before the parole board has already completed their court-ordered minimum sentences, it would make sense for boards to operate with a presumption of release.1 But only 34 states even offer discretionary parole, and those that do are generally not set up to help people earn release. Parole boards often choose to deny the majority of those who appear before them.
Of the 34 states with discretionary parole, we were able to find parole data for both 2019 and 2020 for these 13 states. Four states – Alabama, Hawaii, Iowa, and New Jersey – report their parole data by the fiscal year instead of the calendar year. Thus, the impact of the pandemic on parole releases may appear less extreme in these four states. (Fiscal Year 2020 data from Alabama reflects hearings held between Oct 1, 2019 and Sept 1, 2020, while Fiscal Year 2020 data in the other three states reflects hearings held between July 1, 2019 and June 30, 2020.) We’ve still included these states, however, as they capture early parole responses to the pandemic.
We also found that, with the exception of Oklahoma and Iowa, parole boards held fewer hearings in 2020 than in 2019, meaning fewer people had opportunities to be granted parole. This may be in part due to boards being slow or unwilling to adapt to using technology during the pandemic, and instead postponing hearings for months. Due to the combined factors of fewer hearings and failures to increase grant rates, only four of the 13 states – Hawaii, Iowa, New Jersey, and South Dakota – actually approved more people for parole in 2020 than in 2019.
Denying people parole during a pandemic only serves to further the spread of the virus both inside and outside of prisons. As the number of cases and deaths in prisons due to COVID-19 continue to rise, parole boards still have the opportunity to help slow the spread of the virus by releasing more people in 2021.
Number of parole hearings, percent approved for release, and number of approvals, 2019 and 2020
It’s important to note that people released on parole are not truly free, and complete the remainder of their maximum sentences on community supervision. There are many problems with community supervision, including that it sets people up to fail with strict conditions and intense surveillance. But in the context of the pandemic where mitigation efforts like social distancing are virtually impossible inside of prisons, it is generally safer for people to be released into a flawed community supervision system than to remain behind bars.
We calculated Montana’s parole numbers by 2019 and 2020 calendar year, using the official list of decisions for each month published by the Montana Board of Pardons and Parole. However, the Montana Department of Corrections’ 2021 biennial report notes the total number of parole hearings, number of approvals, and number of denials, broken down by fiscal year. Here, the DOC reports a much higher grant rate, which we were unable to replicate using the monthly data from the Board of Pardons and Parole.
Pennsylvania Act 115 (2019) reduced the number of people eligible for parole hearings by creating presumptive release for some people serving sentences of two years or less. The Act likely contributed to the drop in parole hearings and total approvals in Pennsylvania in 2020.


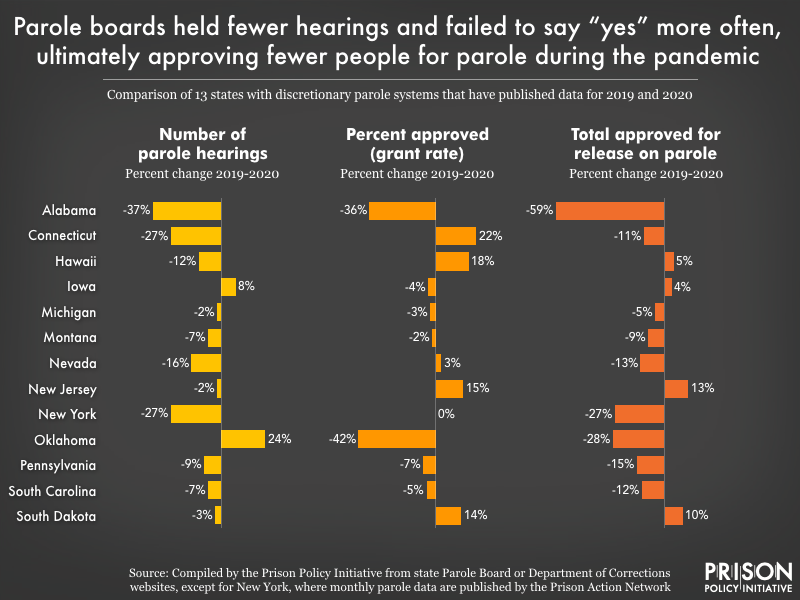 Of the 34 states with discretionary parole, we were able to find parole data for both 2019 and 2020 for these 13 states. Four states – Alabama, Hawaii, Iowa, and New Jersey – report their parole data by the fiscal year instead of the calendar year. Thus, the impact of the pandemic on parole releases may appear less extreme in these four states. (Fiscal Year 2020 data from Alabama reflects hearings held between Oct 1, 2019 and Sept 1, 2020, while Fiscal Year 2020 data in the other three states reflects hearings held between July 1, 2019 and June 30, 2020.) We’ve still included these states, however, as they capture early parole responses to the pandemic.


