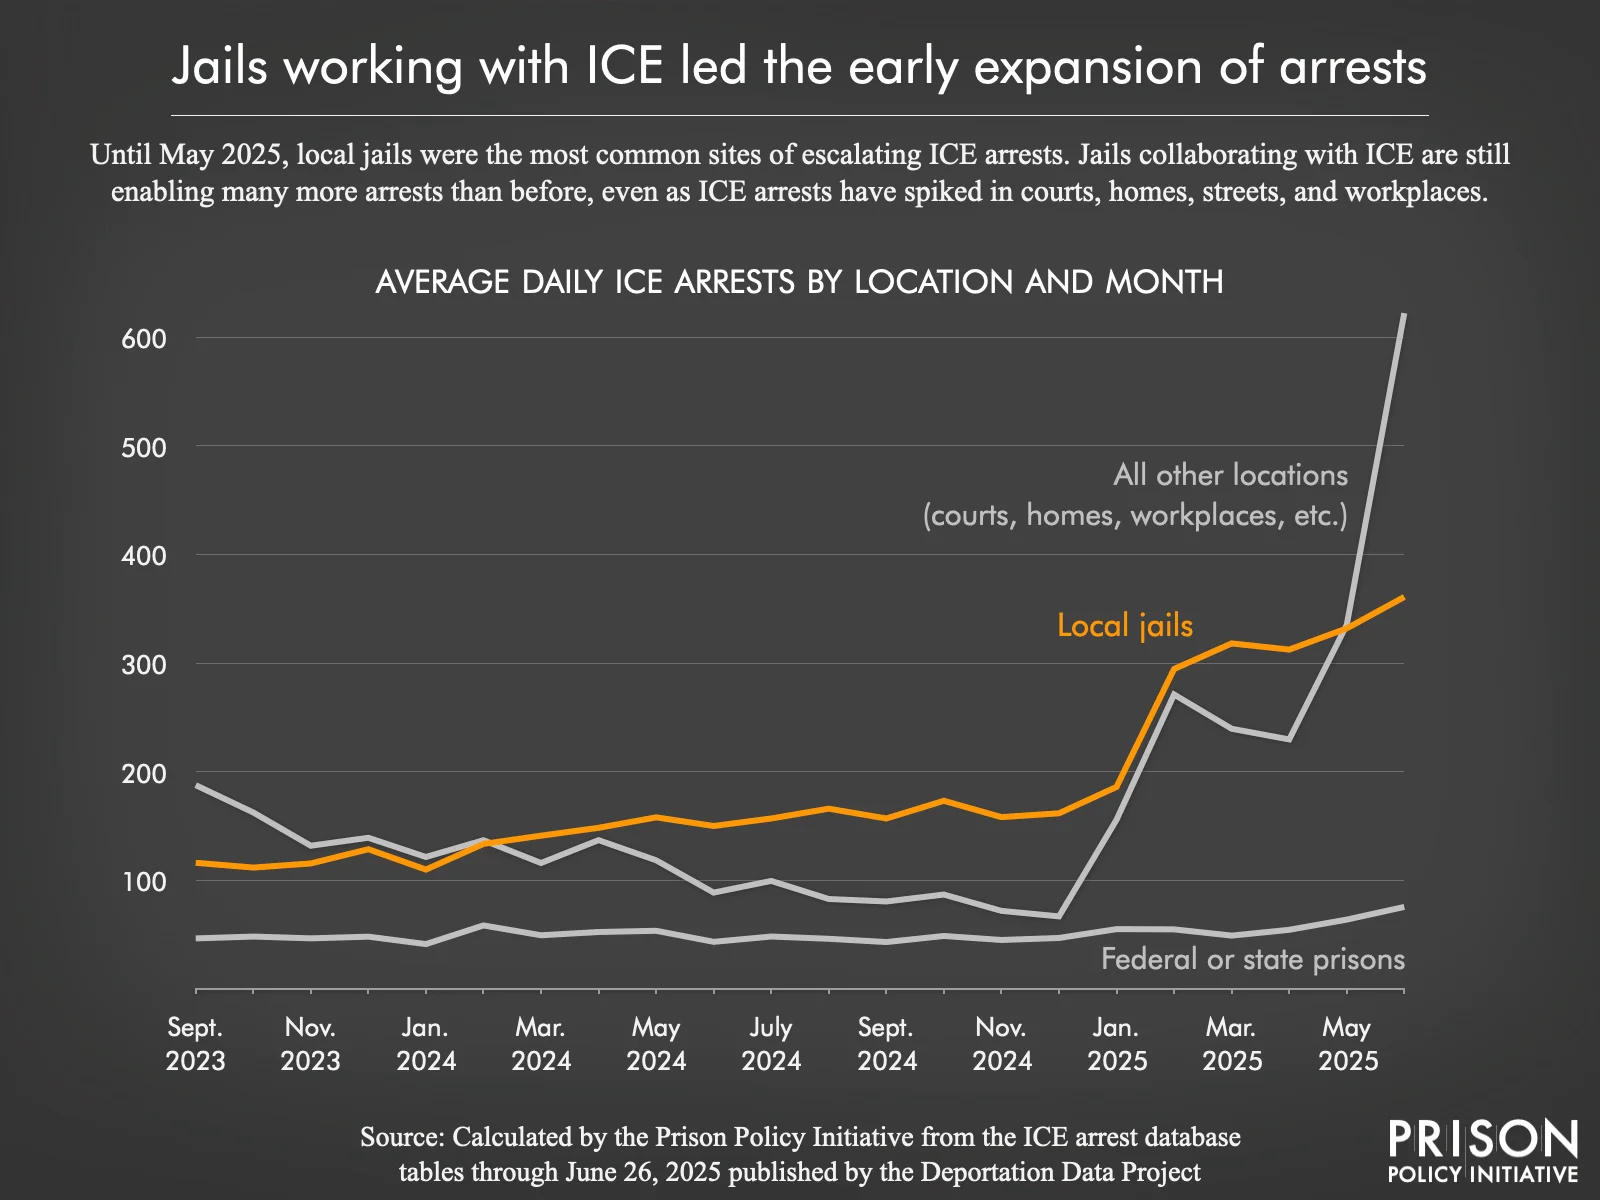
Data Source: Calculated by the Prison Policy Initiative from the ICE arrest database tables through June 26, 2025 published by the Deportation Data Project. (Graph: Wendy Sawyer, 2025)
This graph originally appeared in Hiding in Plain Sight: How local jails obscure and facilitate mass deportation under Trump.
ICE arrests at local jails skyrocketed in February 2025 alongside a major escalation in arrests during field operations at courts and other locations. These two locations point to the Trump administration’s approaches to ramping up arrests and deportations in jurisdictions that collaborate with federal law enforcement (via local jails) and those that do not (via field operations).


