We are looking for our next Creator-in-Residence to produce engaging and informative social video content about the problems in the American criminal legal system.
Support us
Can you make a tax-deductible gift to support our work?
From arrest to sentencing, racial and ethnic disparities are a defining characteristic of our criminal justice system. Not only does racial bias pervade the justice process; people of color also face disproportionately high rates of poverty, meaning they suffer from the justice system's unequal treatment of poor people. Black Americans, in particular, are disproportionately likely to be incarcerated and to receive the harshest sentences, including death sentences.
Below is some of our key research on racial disparities in the criminal justice system:
Key statistics:
Black Americans as a percentage of all U.S. residents: 14%1
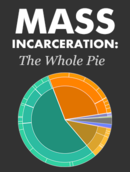
Our report breaks down how many people are incarcerated in the U.S., where, and why — highlighting causes of incarceration that get too little attention as well as 10 incarceration "myths" that receive too much.
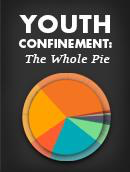
We explain where the 31,900 kids in the criminal legal system are held, under what conditions, and for what offenses. We also look at the growing racial disparities in youth confinement.
The Trump Administration's mass arrest and deportation agenda is made possible by federal prosecutors, but they generally need the collaboration of local jails. Until this report, the actual scope of this collaboration — and the true scale of immigrant arrests and detentions -- has not been publicly available.
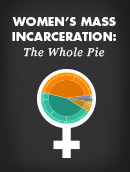
Our report breaks down where and why 190,600 women are locked up in the U.S. It also explains the unique ways women experience the criminal legal system.
Our analysis of rare survey data shows how mass incarceration has been used to warehouse people with marginalized identities and those struggling with poverty, substance use disorders, and housing insecurity, among other serious problems.
Our first-of-its-kind report shows how all 50 states exclude some people with criminal records from serving on juries, making juries less diverse and trials less fair.
At least 4.9 million people go to county and city jails each year, our national analysis shows. We find that people who go to jail - particularly those who go more than once a year - are disproportionately likely to be Black.
Our first-of-its-kind report breaks down the pre-incarceration incomes of people in prison by race and gender. We find that even before their incarceration, people in prison are much poorer than Americans of similar ages.
We find that affording money bail is impossible for many defendants because the typical money bail amount represents — depending on race and gender of the defendant — between 8 and 13 months of income.
The prison construction boom was largely a rural prison construction boom. In this report, we measure one of the downstream results: the degree to which, in each state, mass incarceration has created jobs for white people while disproportionately locking up people of color.
Our analysis of NYPD data on stop-and-frisk shows that the police used physical force in almost a quarter of stops — and that their use of force is also racially discriminatory.
Increasing drug sentences in school zones is meant to protect children, but has worsened racial disparities in state prisons. We've published three reports about why these geography-based penalties are ineffective and harmful.
New ICE arrest data show the power of state and local governments to curtail mass deportations, by Jacob Kang-Brown and Brian Nam-Sonenstein, December 11, 2025 Using fresh data on ICE arrests through mid-October from the Deportation Data Project, we examine how jails continue to facilitate mass deportation, spotlighting important opportunities for resistance at the state and local levels.
New, expanded data on Indian country jails show concerning trends extend to tribal lands, by Emily Widra, October 8, 2024 In this briefing, we look at data that shows in Indian country jails, populations have rebounded from pandemic lows, the detention of women and older adults is increasing, and new offense type data raise questions about why so many people are incarcerated on tribal lands.
Force multipliers: How the criminal legal and child welfare systems cooperate to punish families, by Emma Peyton Williams, January 8, 2024 Child protective service agencies position themselves as providers of welfare, but their relationship to the criminal legal system demonstrates their shared role in punishing families and exacerbating the conditions that lead to system involvement in the first place.
Updated data and charts: Incarceration stats by race, ethnicity, and gender for all 50 states and D.C., by Leah Wang, September 27, 2023 New data visualizations and updated tables show the national landscape of persistent racial disparity in state prisons and local jails. In this briefing we also provide a downloadable spreadsheet of the most recently available incarceration data for people in state prisons and in local jails, by race and ethnicity and by sex.
Racial disparities in diversion: A research roundup, by Leah Wang, March 7, 2023 Research shows diversion "works," reducing harmful outcomes and increasing access to social services. However, studies also suggest diversion is routinely denied to people of color, sending them deeper into the criminal legal system. We review the research and remind practitioners that most diversion programs aren't designed around racial equity — but should be.
New BJS data reveals a jail-building boom in Indian country, by Emily Widra, Wanda Bertram, and Wendy Sawyer, October 30, 2020 Across the country, local governments are building more jail space rather than working to reduce incarceration. New data shows that this trend is especially visible on tribal lands.
Visualizing the racial disparities in mass incarceration, by Wendy Sawyer, July 27, 2020 Racial inequality is evident in every stage of the criminal justice system - here are the key statistics compiled into a series of charts.
Ten key facts about policing: Highlights from our work, by Wendy Sawyer, June 5, 2020 Police disproportionately target Black and other marginalized people in stops, arrests, and use of force; and are increasingly called upon to respond to problems, such as homelessness, that are unrelated to public safety.
How race impacts who is detained pretrial, by Wendy Sawyer, October 9, 2019 The government hasn't collected national data on the race or ethnicity of people awaiting trial in jail since 2002. We review the academic literature published since then to offer a more current assessment of racial disparities in pretrial detention.
The crippling effect of incarceration on wealth, by Meredith Booker, April 26, 2016 The wealth disparity between young men who experience prison and those who never do is staggering - and contains a heavy racial component.
New poll shows mass incarceration is a Latinx issue, by Lucius Couloute, January 24, 2018 A new poll from Latino Justice PRLDEF shows that the Latinx community is deeply concerned about mass incarceration.
The proven truth: Police treat Black Americans with less respect, by Lucius Couloute, June 8, 2017 New research out of Stanford University substantiates what Black America has always known - that police officers treat Blacks differently than they do whites.
Our reports on the "collateral consequences" of punishment (such as long-lasting barriers to employment) often include race breakdowns, revealing how incarceration has lasting effects for Black and brown communities.
By focusing law enforcement on low-level offenses and subjecting criminal defendants to money bail and other fees, our country punishes people for being poor. This unequal treatment hits people of color the hardest.
How much of mass incarceration is a result of policies about drugs? We measure the impact of the decades-long drug war and highlight specific policy failures.
This figure refers to the number of total arrests made, not the number of individual Black Americans arrested. For more information, see FBI Crime Data Explorer. ↩


 Women's Mass Incarceration: The Whole Pie 2024
 Women's Mass Incarceration: The Whole Pie 2024
 Beyond the Count: A deep dive into state prison populations
 Rigging the jury: How each state reduces jury diversity by excluding people with criminal records
 Arrest, Release, Repeat: How police and jails are misused to respond to social problems
 Arrest, Release, Repeat: How police and jails are misused to respond to social problems
 Prisons of Poverty: Uncovering the pre-incarceration incomes of the imprisoned
 Prisons of Poverty: Uncovering the pre-incarceration incomes of the imprisoned
 Detaining the Poor: How money bail perpetuates an endless cycle of poverty and jail time
 Detaining the Poor: How money bail perpetuates an endless cycle of poverty and jail time
 The Racial Geography of Mass Incarceration
 The Racial Geography of Mass Incarceration
 What "Stop-and-Frisk" Really Means: Discrimination & Use of Force
 What "Stop-and-Frisk" Really Means: Discrimination & Use of Force
 Combating racially imbalanced "sentencing enhancement zones"
 Combating racially imbalanced "sentencing enhancement zones"
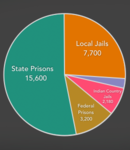


 Collateral consequences
 Collateral consequences
 Poverty and debt
 Poverty and debt
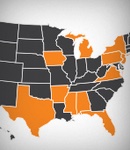 Drug policy
 Drug policy


