Incarceration in the U.S.: The big picture
Very little data exists about how many people are locked up in U.S. prisons and jails (much less on parole and probation). So the Prison Policy Initiative collects and presents the data that does exist, in order to illustrate the unprecedented size and reach of our criminal justice system:
Mass Incarceration: The Whole Pie 2025
Our report and comprehensive graphic provide the big picture: nearly 2 million people are locked up in in U.S. more than 6,000 correctional facilities operated by thousands of agencies. We break down how many people are incarcerated in the U.S., where, and why — highlighting causes of incarceration that get too little attention as well as 10 incarceration “myths” that receive too much. Also, check out our other Whole Pie reports that focus specifically on the incarceration of women and the incarceration of young people.
States of Incarceration: The Global Context 2024
This report and infographic directly situate individual U.S. states in the global context, revealing that every region in the U.S. is out of step with the rest of the world when it comes to incarceration. We also have a companion report focused on the incarceration of women.
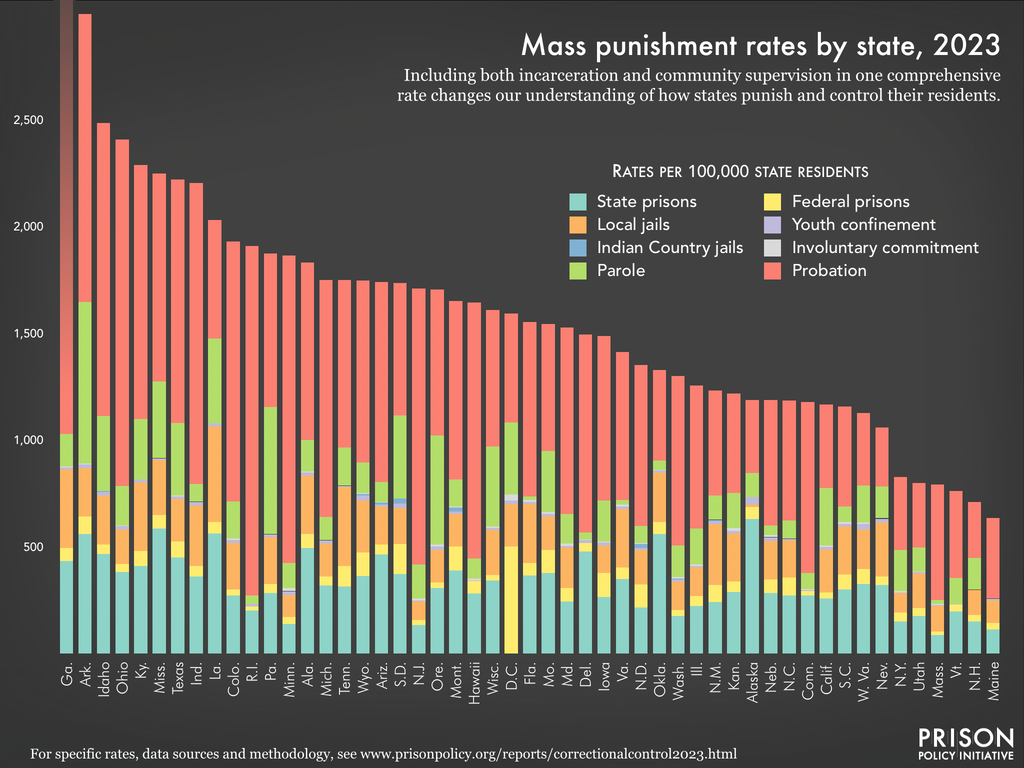
Punishment Beyond Prisons 2023: Incarceration and Supervision by State
The U.S. has a staggering 1.9 million people behind bars, but even this number doesn’t capture the true reach of the criminal legal system. In this report, using 100+ state-specific graphics, we examine the full system of mass punishment — incarceration, probation, and parole — to show the true number of people ensnared in the criminal legal system.
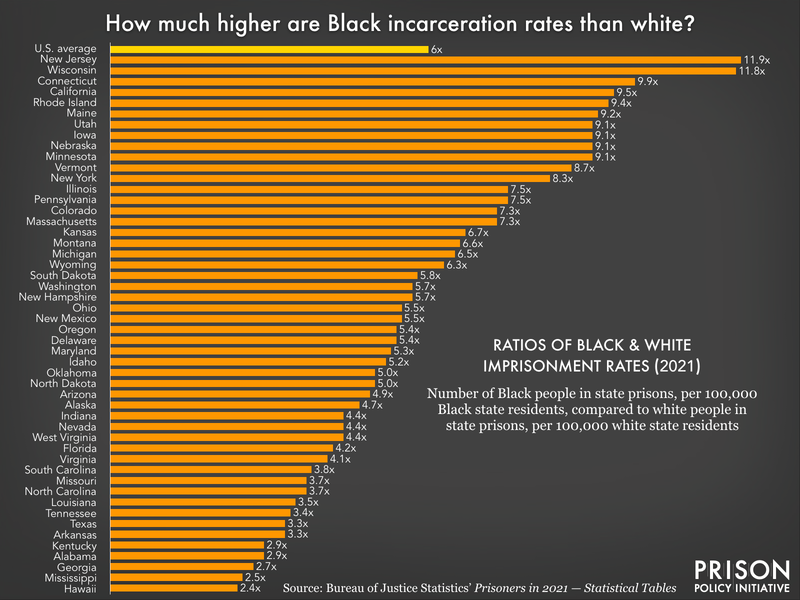
State-by-State Incarceration Rates by Race/Ethnicity and Sex
We've pulled together the most recently available incarceration data for people in state prisons and local jails, by race and ethnicity, and by sex, for all 50 states and D.C. This dataset allows for comparisons across state lines to better understand racial disparities in the criminal legal system — and offers surprising insights. We also produced more than 100 charts to show racial disparities in each state.
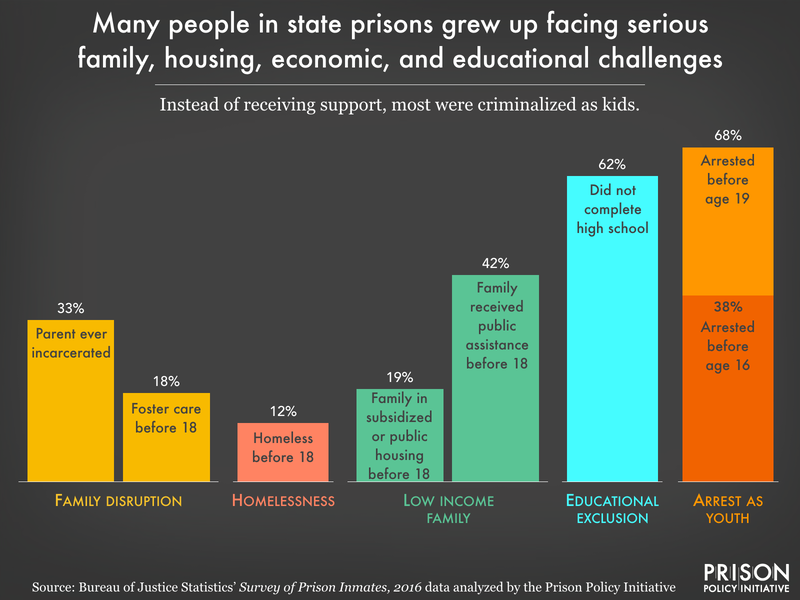
Beyond the Count: A deep dive into state prison population
In this report we take a deep dive into a large-scale survey of incarcerated people to gain a better understanding of how mass incarceration has been used to warehouse people with marginalized identities and those struggling with poverty, substance use disorder, housing insecurity, and more.
The “bigger picture”: our other research, organized by topic
We've published highly-readable reports on issues including exploitation in the criminal justice system, how many women and youth are in prison, people's experiences on probation and parole, and much more. See our research on:
- Jails and bail
- Racial justice
- Drug policy
- Poverty and debt
- Probation and parole
- Exploitation in the criminal justice system
- Communication behind bars
- The collateral consequences of incarceration
- Women and gender
- Public health
- Policing
- COVID-19
- Prison gerrymandering
Data for every state:
Select your state:
Events
- April 15-17, 2025:
Sarah Staudt, our Director of Policy and Advocacy, will be attending the MacArthur Safety and Justice Challenge Network Meeting from April 15-17 in Chicago. Drop her a line if you’d like to meet up!
Not near you?
Invite us to your city, college or organization.


