Affidavit of Peter Wagner
Affidavit prepared by Peter Wagner for a Revere, Massachusetts case regarding a city ordinance that would banish a person classified as a level 3 sex offender from the city.
by Peter Wagner, August 14, 2006
This affidavit was prepared for a case in Revere Massachusetts where the city was preparing to enforce a city ordinance that would banish a person classified as a level 3 sex offender from the city. The clerk-magistrate declined to issue a complaint and the prosecution did not proceed.
Affidavit of Peter Wagner
1. I, Peter Wagner, am an attorney and Executive Director of the Prison Policy Initiative a non-profit research organization based in Easthampton, Massachusetts. The Prison Policy Initiative focuses on the intersection of criminal justice policy and other social issues. In my role as Executive Director, I regularly make maps and analyze Census data.
2. In March 2004, I gave an invited presentation of my research at “America’s Scorecard: The Census in an Ever-Changing Nation”, an academic symposium organized by the Census Bureau in Washington D.C., and in June 2005 I gave an invited presentation to a panel of the National Academy of Sciences investigating Census Bureau methodology.
3. I am currently leading a project at the Prison Policy Initiative that involves mapping 1,000 foot zones around urban and rural schools in Hampden County and then analyzing the Census populations of the affected areas.
4. On July 12, 2006, I testified in the United States District Court for the Northern District of Georgia in Whitaker v. Perdue (4:06-cv-00140-CC) in support of plaintiff’s motion for a preliminary injunction barring enforcement of HB1059, Georgia’s Sex Offender Residence law. To prepare for my testimony, I prepared maps of 1,000 foot exclusion zones around schools, day care centers, bus stops, parks and other areas listed in the statute as places that people on the sex offender registry cannot live.
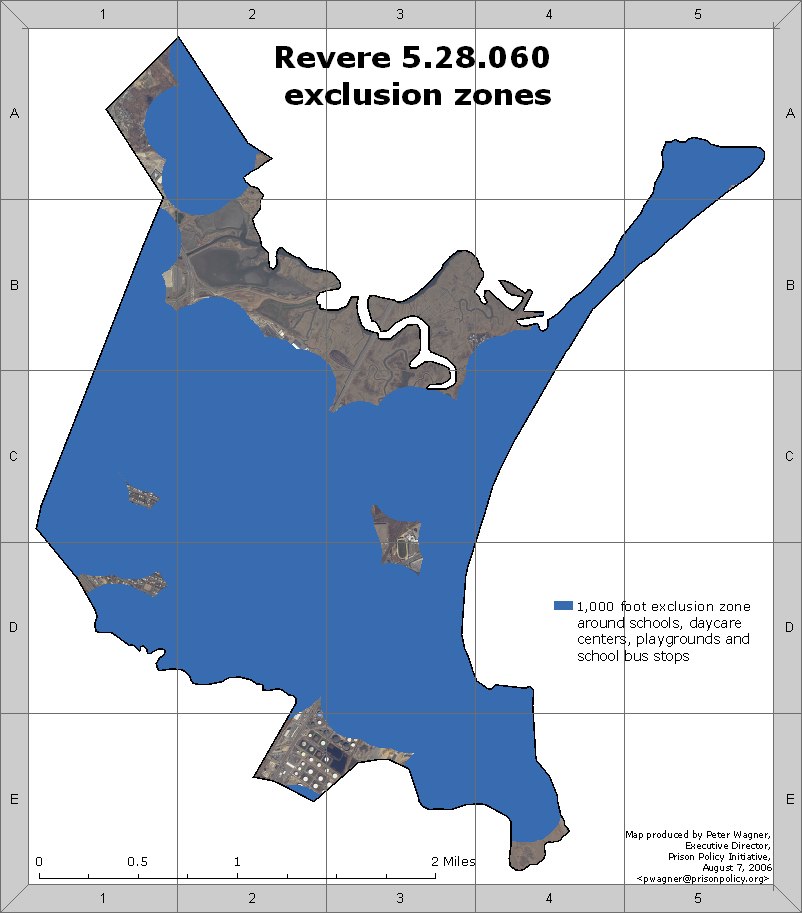
5. I used GIS technology and a software package called Arcview 9.1 to map the areas in the city of Revere which are one thousand linear feet of a public or private school, nursery school, day care center, kindergarten, and playground. The map entitled “Revere 5.28.060 exclusion zones” represents that the Revere ordinance of October 25, 2005 would prohibit level III sex offenders from living in more than 99% of the city. No more than 100 residential buildings in the City of Revere are outside of the ordinance’s exclusion zone.
6. The map “Revere 5.28.060 exclusion zones” shows that the majority of Revere is included in the exclusion zones. The majority of the remainder is industrial (grids E2, E3) Suffolk Downs (C3, D3) or marsh (B2, B3, B4, C3, E4). Most of the land in grid A1 that is not in an exclusion zone is undeveloped woodland.
7. Residential houses outside of the exclusion zone can be seen only in Grids A1, C1 and D1. However, many of the houses visible in the photographs may also be off limits to people designated as level 3 offenders for other reasons. First, the map shows the exclusion zones as measured only from a single point on the property of day care centers and schools. In reality, day care centers and schools are much larger than a single point, as they may contain multiple buildings, playing fields, etc, the exclusion zones are actually larger than they appear on the map. Second, while the aerial pictures show structures, they do not show property lines of individual residences. Many of the residential structures seen in the aerial photographs are on properties that partially extend in to the exclusion zone and are therefore off limits to people designated as level 3 offenders. The map “HB1059 exclusion reaches beyond 1,000 feet“, which I prepared for the Whitaker v. Perdue case, demonstrates the drawing simple circles with a radius of 1,000 feet understates the actual impact of the exclusion zones. Finally, aerial photography can only identify structures. It can not, by itself, confirm whether any of the remaining structures outside the exclusion zone are in fact available for rent or purchase.
8. To make these maps I used a variety of data sources:
- Schools: I used a file created by MassGIS, the Commonwealth’s Office of Geographic and Environmental Information, within the Massachusetts Executive Office of Environmental Affairs that represented each public and private school in the state as of October 18, 2004. This file does not represent the property line of each school, instead showing only one point for each school. The property lines for schools in Revere were not immediately available.
- Day Care Centers: The Massachusetts Department of Early Education and Care maintains a list of all licensed child care facilities in the state. I used the address of each facility in Revere to place single points on the map. The property lines for day care centers in Revere were not immediately available.
- Playgrounds: I downloaded the MassGIS database of Protected and Recreational Open Space (last updated February 2006) and filtered it to use only the shapes of properties that had “park” or “beach” in the title.
- Bus stops: Peter Martino at Revere Transportation Department provided a list of school bus stops which were then placed on the map.
- Aerial photography: MassGIS publishes aerial photography taken in April 2005 at the 1:5000 scale.
- The Census block maps and Revere City boundary file was created by the U.S. Census Bureau and distributed by ESRI, the manufacturer of the ArcView GIS program.
9. On August 10, 2006, I learned that the City of Revere had amended ordinance 5.28.060 to restrict people classified as a level 3 from living within 1,000 feet of schools. Based with this information, I made a new map and then overlaid the 1,000 foot exclusion zones over Census Bureau data to determine that at least 4,400 housing units in Revere are now off limits to people classified as level 3 sex offenders. This is 21.8% of the housing units in Revere. Those housing units contain at least 10,252 people, or 21.7% of the city.
10. According to the U.S. Census, in 2000 Revere had 47,283 people and 20,181 housing units. The use of Census Bureau data from 2000 is appropriate for three reasons. First, the decennial census is the only reliable source of block level data. Second, Census Bureau estimates for the entire city show that the population has been relatively stable from 2000 to the most recent estimates in July 2003. The population of Revere in July 2003 was estimated to be 47,002, or only 0.6% smaller. Third, the aerial photography from 2005 shows that there are no new large housing developments outside of the exclusion zones. The unpopulated marsh and industrial areas in Revere remained uninhabitable.
11. As in Paragraph 7, this methodology also understates the impact of the exclusion zones because I used the point of each school’s address rather than its actual border. Schools are significantly larger than a single point, as a school may contain several buildings, playgrounds and other land. Secondly, this methodology also understates the impact of the Revere ordinance because I was unable to show the property lines of individual residences in Revere.
12. Therefore, the fact that at least 4,400 housing units in Revere are off limits to people classified as a level 3 should be seen as only a minimal figure. The actual number of housing units off limits under this ordinance can not be lower than 4,400, but it may be higher.
Signed under the pains and penalties of perjury this 14 day of August, 2006.
Peter Wagner