HELP US END MASS INCARCERATION
The Prison Policy Initiative uses research, advocacy, and organizing to dismantle mass incarceration. We’ve been in this movement for 23 years, thanks to individual donors like you.
Can you help us sustain this work?
Thank you,
Peter Wagner, Executive Director Donate
Can you help us sustain this work?
Thank you,
Peter Wagner, Executive Director Donate

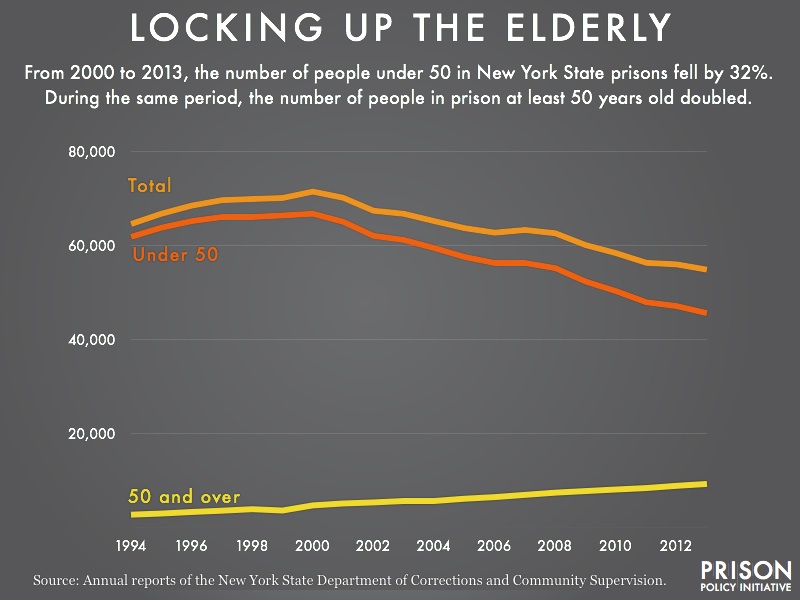
Data Source: Annual reports of the New York State Department of Corrections and Community Supervision. (Graph: Peter Wagner, 2014)
This graph originally appeared in What’s wrong with this picture? Elderly in NY’s prisons.


