HELP US END MASS INCARCERATION
The Prison Policy Initiative uses research, advocacy, and organizing to dismantle mass incarceration. We’ve been in this movement for 23 years, thanks to individual donors like you.
Can you help us sustain this work?
Thank you,
Peter Wagner, Executive Director Donate
Can you help us sustain this work?
Thank you,
Peter Wagner, Executive Director Donate

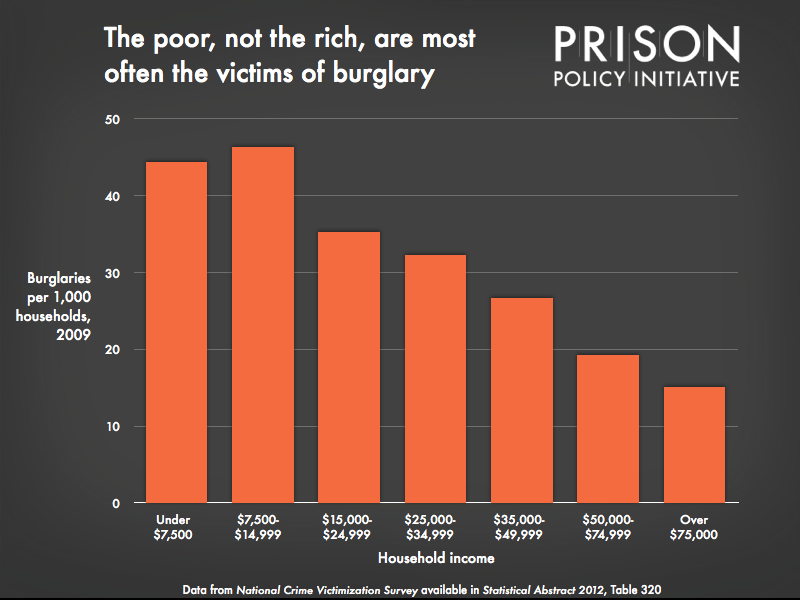
Data Source: National Crime Victimization Survey available in Statistical Abstract 2012, Table 320. (Graph: Peter Wagner, 2012)
This graph originally appeared in Trayvon Martin, Fear of Crime and Mass Incarceration.


