How the prison phone industry incentivizes bad policy
Verizon says no; but the industry and sheriffs say yes to ripping off poor families and endangering public safety.
by Sarah Hertel-Fernandez, August 12, 2014
The prison and jail communications industry all too often isolates those incarcerated and preys on their families. Despite the FCC issuing a cap on phone rates last year, the companies are raising their fees and innovating exploitative new practices like video-only visitation. Regulation of the cost and quality of communication is more necessary than ever.
The evidence is continuing to mount, and it’s also coming in from some unlikely sources. Verizon, one of the largest telecommunications companies in the country and a previous participant in the prison phone industry, submitted this powerful amicus curiae in an ongoing lawsuit where the industry is trying to halt the FCC’s preliminary regulations. Verizon supports the FCC’s conclusion that “site commissions are not reasonably and directly related to the provision of inmate calling services” and so cannot be “recovered” by inflating rates charged to their end users– the families and friends of those behind bars. After all, “[t]he FCC is required to ensure that the charges for the interstate telecommunications services are ‘just and reasonable'”; and as the company explained in a blog post: “Everyone benefits when inmates successfully transition out of the prison system [and that] affordable contact with family and friends while in prison can help make that happen.”
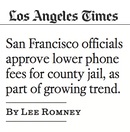 Verizon isn’t alone. A growing number of state and local governments are losing patience with the system. Lee Romney wrote this great article for the LA Times on how government officials in San Francisco are pushing back against predatory rates. California already bans state prisons from accepting commissions, and is considering a bill to ban county jails from accepting commissions and require them to award contracts to phone companies that offer the lowest cost of service for those incarcerated. Opponents of the bill say that the commissions are used to fund inmate services, but as lead sponsor Assemblyman Quirk says: there are better sources of funding “than taxing grandma”.
 But the industry is always evolving. Cari Wade Gervin’s article for Metropulse reports on a disturbing new trend: in Knox County, Tennessee, video visits have replaced in-person visits entirely. She follows the money trail for the implementation of this program.
The plan will supposedly save both the families and facilities money, and in theory will increase overall accessibility and safety. In practice, the exorbitant and unregulated fees charged to the families reduce accessibility. And of course, left off the county’s balance sheet are the incredibly damaging psychological and social costs of eliminating in-person visits.
The kicker is this: Video visitation isn’t a random choice on the part of the Knox County Sheriff. It has been massively incentivized by companies — in this case, installation and future maintenance would be provided by Pay-Tel for free, “provided every 15-minute video session would cost $5.99. The county would receive 43.75 percent of those fees… Any revenues go straight to the county’s general fund.” Metro Pulse asked PPI Director Peter Wagner for his reaction: “This is such a uniformly bad idea, I’m kind of speechless.”
Gervin delved deeper into how the profit motive is skewing correctional priorities in her companion blog post: Tech Friends, the company that provides the kiosks used in Knox County, sells their units with the insidious-sounding promise that they will Reduce Inmate Movement and Reduce Jail Traffic. “Seriously,” writes Gervin, “it actually says that part of the point of video visitation is reduce visitors.”