Overview: Trends in the Crime Control Industry
This overview takes a brief look at trends within various parts of the crime control industry. It's a fair assumption that barring outside action, what happens tomorrow will resemble what happened yesterday. But with so many factors at play in the crime control industry, we should look at what influences the health of the industry in order to assess likely industry scenarios in the future.
Each section provides a short summary of the numerical trends, and then lists some factors that will determine what happens in the next two to five years. Many of these factors are directly or indirectly political, and therefore ripe for being influenced by advocacy efforts.
Incarceration
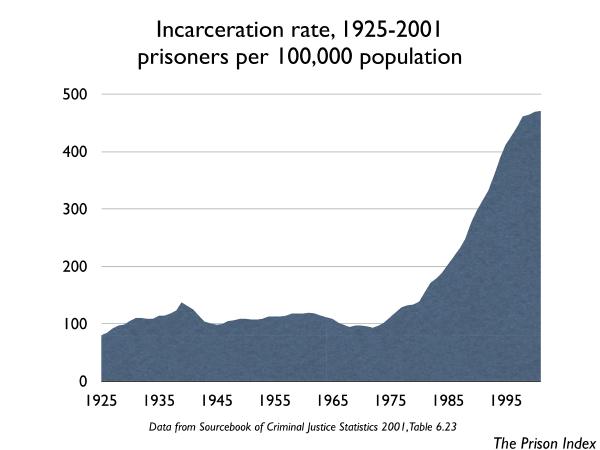
This graph represents the number of people in federal and state prisons (but not local jails) per 100,000 population. It shows how common incarceration is, regardless of changes in the total population size. We see that incarceration was relatively stable from the start of the statistics in 1925 through the early 1970s at about 100 per 100,000 residents. As of June 30, 2001, the U.S. imprisonment rate was 472 per 100,000 people. 1 Adding the 631,240 persons held in local jails creates an incarceration rate of 690 per 100,000. 2
From 1990 to 2001, the average growth in incarceration was 5.8% per year3, however, this was not a steady growth nor was it evenly distributed across the country. After peaking at 9% growth in 1994-1995, the growth rate dropped to 2.3% in 1999-2000 and 1% in 2000-2001. In the last year, most states had very small growth, and 11 states reduced their prisoner populations between mid-year 2000 and 2001. There were anomalies, however. New Mexico's prison population grew 15.4% and South Dakota's grew 7.3%.4 While the states restricted their combined growth to 4,329 prisoners, in that same period the federal prison system added 10,258 prisoners for a 7% growth rate.5
A large portion of the prison increase since 1990 has been from a decrease in prisoners being paroled and an increase in the frequency with which parolees are returned to prison for technical violations of parole terms without the commission of new crimes. Changes in sentencing laws requiring longer sentences have also played a major part. Political decisions like these outweigh the small changes in the crime rate from year to year.
Factors suggesting that high incarceration growth will resume in the next two to five years:
- The baby boom echo means more people are entering their teens and early twenties, an age where crime is more common.6
- The September 11th attacks and the War on Terrorism have created a more punitive atmosphere towards immigrants. Detention of immigrants which is not tracked as incarceration was on the rise even before September 11. Empty cells from overbuilt jails and prisons could be filled by contracts with the INS as some states make policy changes (e.g. drug law reform) that reduce local prison and jail populations.
- The federal government's war on drugs does not appear to be restrained by the economic crisis facing the states.
Factors suggesting that the rate of incarceration will remain stable or decline in the next two to five years:
- The economic crisis is forcing states to reexamine the expensive policy of using mass incarceration as a response to crime.
- The "War on Terrorism" may divert funds from the "War on Drugs".
- Many states are reforming their drug laws, and the growth rate for federal drug prisoners is slowing. 7 In 2000, 21% of state prisoners and 57% of federal prisoners were incarcerated for drug offenses. 8
- We may be approaching the numerical limits of the prison system. Almost 4% of the civil labor force is in prison or works to put people there9 and 13.3% of Black men in their late twenties are already in prison. 10
This page is an excerpt from The Prison Index: Taking the Pulse of the Crime Control Industry (April 2003) by Peter Wagner, published by the Western Prison Project and the Prison Policy Initiative.
Footnotes
1 Bureau of Justice Statistics, Prisoners and Jail Inmates at Mid-year 2001, 5/10/02 revised edition, p. 3
2 Bureau of Justice Statistics, Prisoners and Jail Inmates at Mid-year 2001, 5/10/02 revised edition, Table 1.
3 Bureau of Justice Statistics, Prisoners and Jail Inmates at Mid-year 2001, 5/10/02 revised edition,p. 2.
4 Bureau of Justice Statistics, Prisoners 2001, Table 4.
5 Calculations based on Bureau of Justice Statistics, Prisoners and Jail Inmates at Mid-year 2001, 5/10/02 revised edition, Table 2.
6 Blumstein and Wallman ed, The Crime Drop in America (2000), p. 11.
7 Bureau of Prisons, Quick Facts, May 2002, viewed January 4, 2003, http://www.bop.gov/fact0598.html.
8 Bureau of Justice Statistics, Prisoners 2001, p. 12, 14.
9 3993 per 100,000 civil labor force. Nils Christie, Crime Control as Industry, 2000 ed, p 141.
10 Calculations based on Bureau of Justice Statistics, Prisoners and Jail Inmates at Mid-year 2001, 5/10/02 revised edition, Table 15.
Recommended Reading:

The unmet health needs of people in prison
States fall far short of their duty to meet the health needs of incarcerated people.

All profit, no risk
The bail industry exploits cracks and loopholes in the legal system to avoid accountability, while growing its profits.

Compare your state's use of the prison to the world at large
Criminal justice policy in every region of the United States is out of step with the rest of the world.

Prison Gerrymandering Project
We are leading the movement to protect our democracy from the Census Bureau's prison miscount.