New BJS figures show that mass incarceration is getting bigger
New report serves as a sobering reminder that state-level criminal justice policy decisions are continuing to ensure that our nation remains the top incarcerator in the world.
by Peter Wagner and Leah Sakala, September 16, 2014
 This morning, the criminal justice policy world got a new key metric on mass incarceration in the U.S.: the Bureau of Justice Statistics’ national update, Prisoners in 2013. This report serves as a sobering reminder that state-level criminal justice policy decisions are continuing to ensure that our nation remains the top incarcerator in the world. While the report indicates a few promising improvements, the overall picture is grim.
Key takeaways from the report:
- Overall, the state and federal prison population increased slightly between 2012 and 2013. Although this is the first overall increase since 2009, the overall prison population has held fairly steady compared to the rapid rise of earlier decades.
- The number of people incarcerated in California increased. In the past several years, in response to a Supreme Court mandate, California’s prison population declined enough to pull the national incarceration rate down.
- While the total number of people incarcerated grew, the country as a whole grew faster, so there was a slight decline of less than half of a percent in the incarceration rate. This change is far too small to impact the results of our June report States of Incarceration: The Global Context finding that every state in this country uses incarceration far more than most of the world.
Here’s the good news:
- For the first time, the federal prison population reported a decline. Over the last decade, the federal Bureau of Prisons had been reporting a growth rate more than 4 times faster than the states, so this is a significant change in direction.
- Some states continue consistent declines in their prison population: New York and New Jersey have declined populations every year but one since 1999, Hawaii has declined for eight years in a row, and South Carolina 4 years in a row.
- 21 states reported declines in their sentenced prison population
- 10 states that had reported growing prison populations for both 2011 and 2012 reported a decline in 2013.
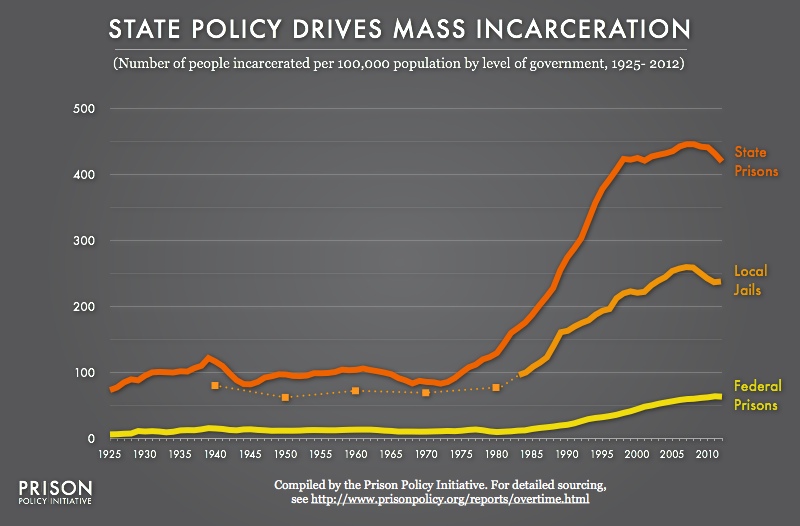 Ending the U.S. experiment with mass incarceration requires us to focus on state policy because individual states are the most active incarcerating bodies in the nation. Graph from our May 2014 report, Tracking State Prison Growth in 50 States shows the number of people (per 100,000 national population at that time) that is confined in state, local and federal correctional facilities from 1925 to the present. State prisons are the largest part. (See larger or as raw numbers.)
And the bad news:
- Reversing 3 years of declining populations, the total prison population increased.
- The number of admissions to prison increased and the number of releases fell in 2013. Each are a bad sign and the combination of both is particularly harmful.
- Racial disparities continue to constitute the defining characteristic of the prison system. For example, 3% of Black males of all ages are currently incarcerated in state or federal prisons. This is a rate 6 times higher than white males.
- 14 states hit new record high prison populations in 2013: Arizona, Arkansas, Indiana, Kansas, Minnesota, Missouri, Nebraska, North Dakota, Ohio, Oklahoma, Oregon, Tennessee, Utah, and Wyoming.
- Texas, one of the states with the highest incarceration rates and which had a much heralded “reform” of its prison population, saw an increase in both its total prison population, its sentenced population, and its incarceration rate.
And remember, this new report from the Bureau of Justice Statistics is just talking about the state and federal prison population, which form just a portion of the much larger incarceration pie of which jails are the next largest piece:
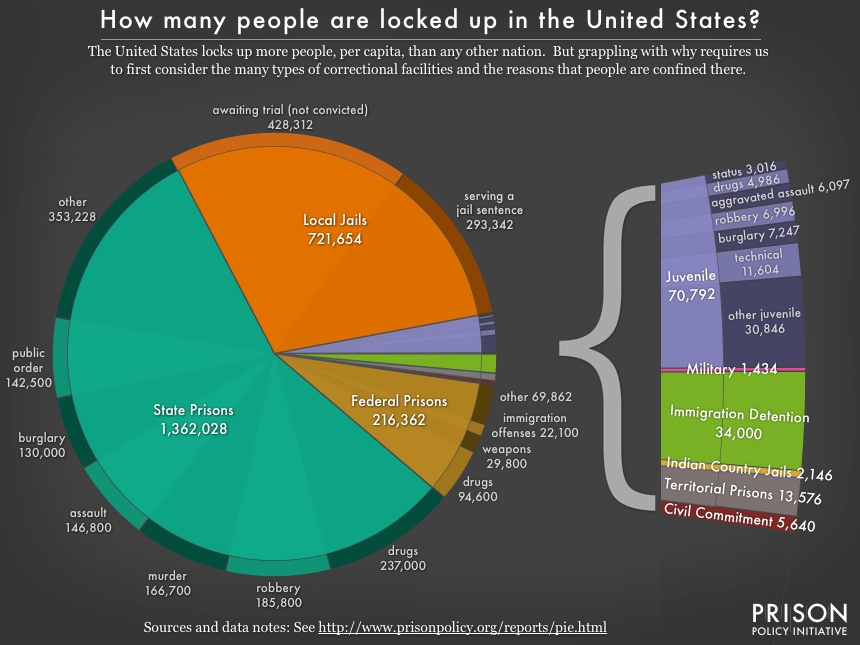 Lets not forget that people incarcerated in prison are just a portion of the people under control of the correctional system. There are jails, juvenile prisons, military prisons, immigration detention, Indian Country jails, territorial prisons, civil commitment, plus probation and parole of which there are 3,981,090 adults on probation, and 851,662 adults on parole.
For more information about ending mass incarceration in your state, see our state profiles.


[…] have been closely following BJS’ recent releases. In BJS’ Prisoners in 2013, we learned that the state and federal prison population increased slightly from 2012 to 2013, the first overall increase since 2009. Although these figures may point out that it is too early […]
[…] in the U.S. in 2013 (excluding people in jail). The Prison Policy Initiative offered a good summary of the report. They key takeaway is […]
[…] New BJS figures show that mass incarceration is getting bigger Peter Wagner and Leah Sakala, Prison Policy Initiative, September 16, 2014 […]