Incremental declines can’t erase mass incarceration
Mass incarceration grew at breakneck speed, year after year. Our reforms need to be equally ambitious.
by Peter Wagner, June 5, 2018
Last month, the Vera Institute of Justice released a useful report with each state’s prison population as of year-end 2017. Their report fills an important gap until the Bureau of Justice Statistics publishes similar (and more detailed) numbers at the end of this year or early next. Compared to how criminal justice data usually works in this country, having numbers just 6 months old feels like a luxury.
Now, armed with timely data, we should discuss what this means and why our elected officials aren’t doing enough. But first, here are the big picture takeaways from the report:
- Total prison population is down 1% over the previous year.
- Some states are down even more, including Maryland, down 9%.
- Twenty states increased their prison populations, and half of those hit new all-time-highs.
By adding in other historical data, we can bring the broader trends into focus and highlight a hidden truth behind the slow decline of the national prison population: the sustained reductions in prison populations in just three large states — California, New York and New Jersey (plus, in the last 5 years, the Bureau of Prisons) — are responsible for a disproportionate share of the recent prison decline.
The prison populations of those three states peaked at different times, but to keep things simple, let’s look at the impact policy changes in those states have had, on the country and on themselves, since 1999 (when New York and New Jersey peaked):
| 1999-2017 | ||
|---|---|---|
| Change | Growth | |
| California | -31,669 | -19.4% |
| New Jersey | -12,040 | -38.2% |
| New York | -22,497 | -30.9% |
| National | 125,911 | 9.2% |
| National without CA, NY, NJ | 192,117 | 17.5% |
So the news that Maryland’s prison population was down 9% during 2017 is good news. And it’s even better news in the context that this one-year drop comes after 6 consecutive years of smaller decreases. But through the longer lens of history, we see that Maryland has much further to go to undo the damage caused by the 1980s alone, when its prison population grew by 8% each year for a decade.
Nationwide, the state prison population in this country is 4.5 times larger now than it was in 1980, because the 1980s and 1990s saw very high rates of annual growth, year after year:
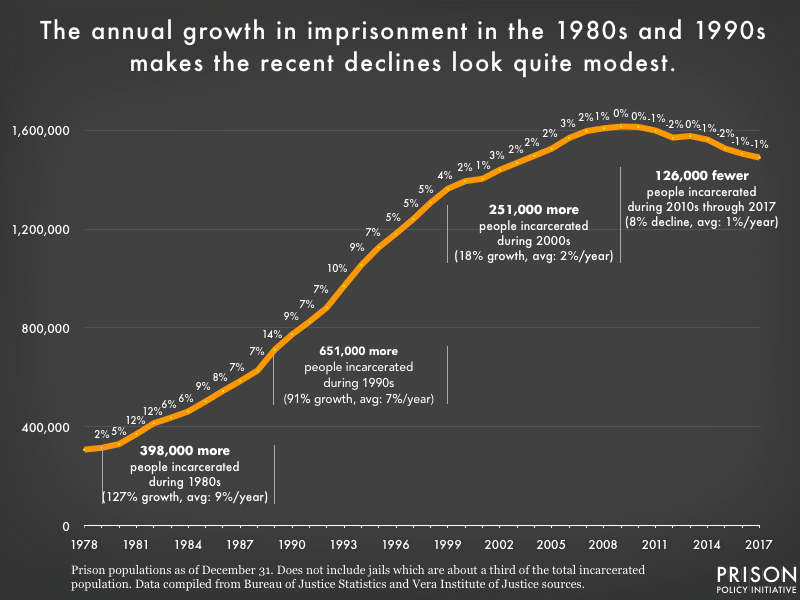
| 1980s | 1990s | 2000s | 2010-2017 | |
|---|---|---|---|---|
| Annual Prison growth | 8.6% | 6.7% | 1.7% | -1.0% |
As you would expect, some years were worse than others. For example, the entire national prison system grew by about 12% in both 1981 and 1982. The historic but single-year 9% drop in Maryland can hardly make a dent in the national damage done in just those two years. Neither can reformer New York, whose entire state prison population is currently smaller than the growth in the national prison population each and every year in the 1990s.
We arrived at our position as the world’s largest incarcerator not overnight, but by making the wrong choices to large effect, year after year for decades. Undoing it will require making the better policy choices, year after year, with the same consistency.
There are many ways to do better. Take the sentences imposed when someone is found guilty by a court. In the United States, the most common outcome is incarceration. In other countries, other options are more common, as explained by this graph, based on data from a Finnish government report:
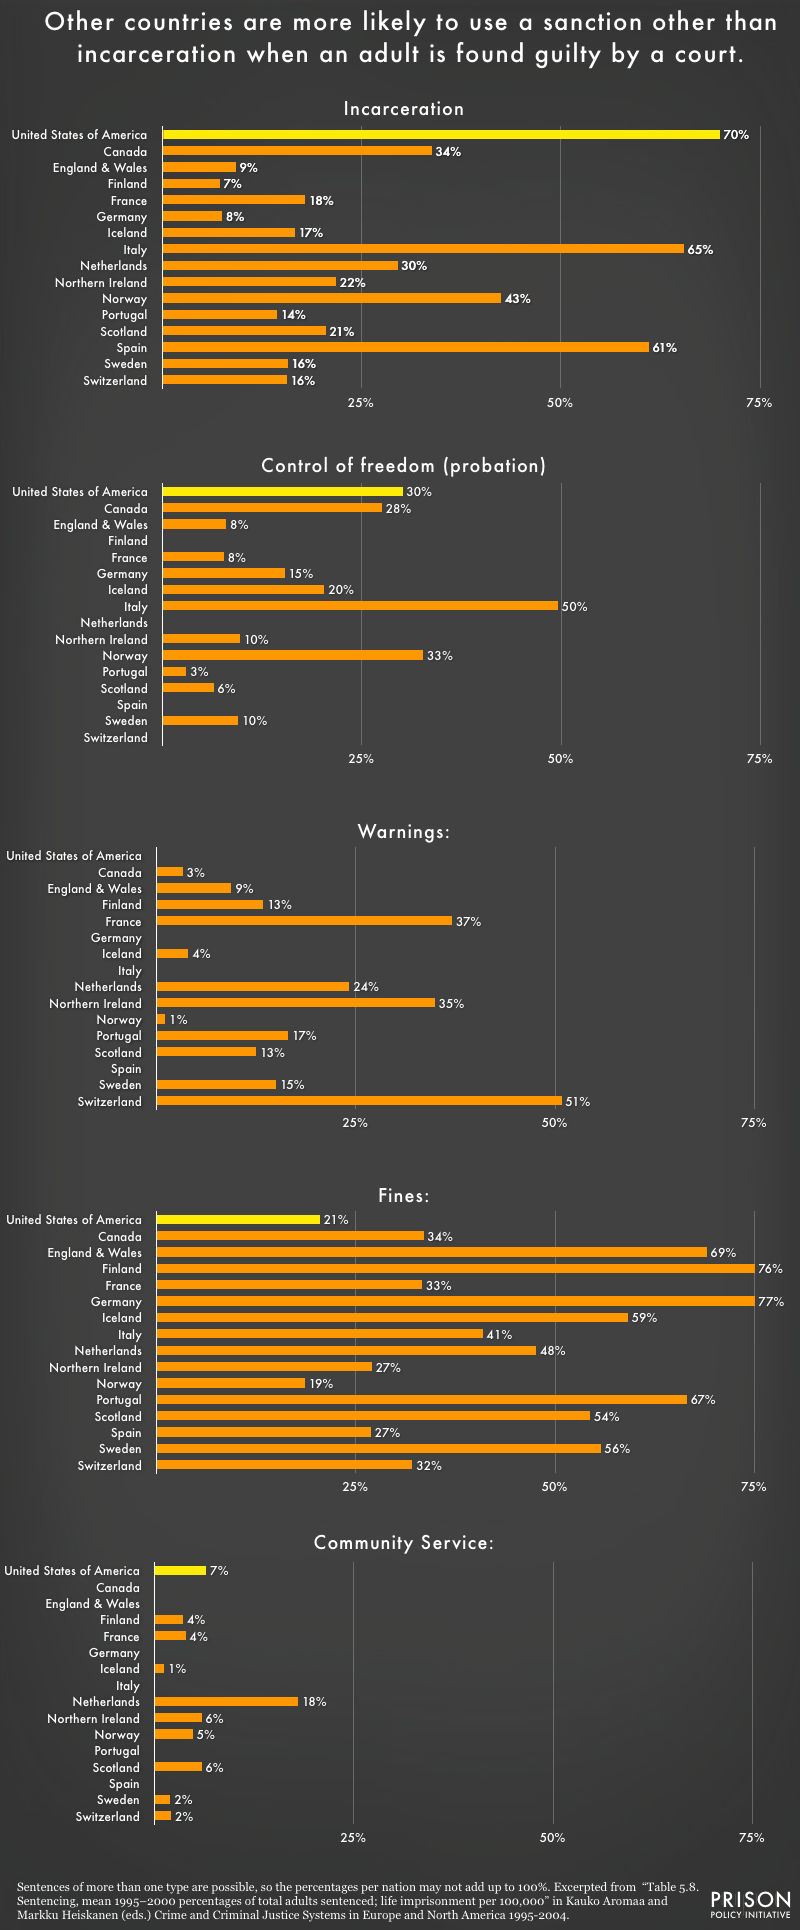 In the United States, the most common punishment upon a guilty verdict is incarceration. Other countries rely more heavily on a range of options from fines, warnings, community service and “control of freedom,” which in the United States would be called probation.
I found this study cited in a very useful 2011 report by the Justice Policy Institute, Finding Direction: Expanding Criminal Justice Options by Considering Policies of Other Nations. The report compares large stable democracies, finding a lot of basic similarities: educational attainment, government spending on education and even the occurrence of crime. Where they differ is on approaches to criminal justice, both in terms of incarceration, and in many of the policy choices that lead to it.
The Justice Policy Institute report emphasizes that it’s not just the size of the systems, but how they are run that matters. For example:
- Adults in Finland are more than twice as likely to be “suspected, arrested, or cautioned” by law enforcement than adults in the United States. (This is true even though Finland has a fewer police per capita than the United States.) (p. 15) (Despite the frequency of these interactions, 96% of Finns report trusting the police, indicating significant qualitative differences in police encounters between the U.S. and Finland. The Justice Policy Institute report touches upon these differences, p. 14).
- Sentences for similar crimes are much longer in the United States than in England and Wales, Australia and Finland. (p. 22)
- Even in countries where drug sentences are somewhat similar in length to those in the United States, all countries have a much smaller portion of their prisons filled with people serving drug sentences. (p. 26 and 22) (And this difference isn’t explained by differences in drug usage, p. 27)
- Other countries are more likely to release people to an intermediate status of supervision prior to the maximum end of their sentence. (p. 34-35)
- Other countries are more likely to provide social services rather than confinement to youth, and most countries have much higher ages of criminal responsibility than the United States. (These are laws that allow children as young as 6 — in the United States — or 14 in the case of Germany to be charged with a crime.) p. 47
Of course the Justice Policy Institute report did identify differences between nations, some of which make it harder or easier for those nations to address crime more effectively. But some of these differences also indicate that some of the best ways to address crime might be found outside of criminal
justice. For example:
- Australia, Canada, Finland and Germany each spend a larger portion of their GDP supporting unemployed people than does the United States. (p 55.)
Ending mass incarceration will require a fresh and holistic look at our societal values and priorities. Our challenge is to overcome the ideology that made it so easy for states to create the system of mass incarceration: While building up the system required complex budgetary and infrastructure changes, ideologically it was quite simple for the state to rally the public around locking up “dangerous criminals.” There were no sudden shifts in societal thinking, just a lot of tiny levers that were gradually pulled over 30 years to make every step of the criminal justice system more punitive.
Successfully ending mass incarceration will require the mirror image of the process of creating it: a sustained, multi-decade, 50-state series of policy changes that reduce the prison population significantly, year after year. It’s clear from the data above that the current pace of reform will not end mass incarceration in our lifetimes, but the fact that the system was built so quickly also means that it could, if the political will can be created, be dismantled just as quickly.


