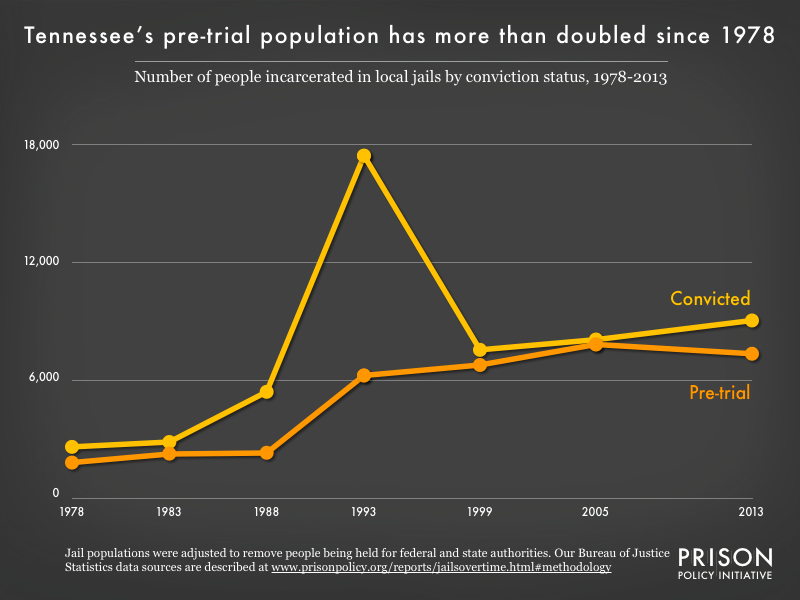
(Graph: Joshua Aiken, May 2017)
This graph excludes people held for state or federal authorities from the total count of people held in Tennessee jails. Because a significant proportion (33%) of the population in Tennessee’s jails is held for the state prison system and the U.S. Marshals Service, this graph likely overstates the convicted population and understates the pre-trial population. (See our methodology.)
 This graph is a part of the Prison Policy Initiative report, Era of Mass Expansion: Why State Officials Should Fight Jail Growth.
Recommended Reading:

The unmet health needs of people in prison
States fall far short of their duty to meet the health needs of incarcerated people.

All profit, no risk
The bail industry exploits cracks and loopholes in the legal system to avoid accountability, while growing its profits.

Compare your state's use of the prison to the world at large
Criminal justice policy in every region of the United States is out of step with the rest of the world.

Prison Gerrymandering Project
We are leading the movement to protect our democracy from the Census Bureau's prison miscount.