Our new video explains that sentencing enhancement zone laws (a.k.a. school zone laws) do not work and will never work.
by Peter Wagner,
June 30, 2014
One of our specialties here at the Prison Policy Initiative is explaining the geographic implications of criminal justice policy. Sometimes we focus on how criminal justice policy — and the forced migration of millions of people to remote prisons cells — distorts our electoral process through prison gerrymandering.
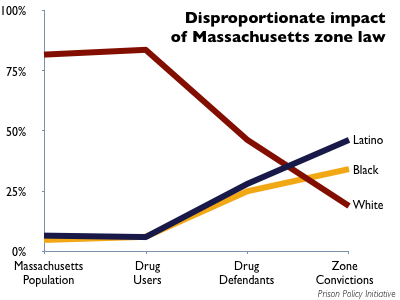
We’ve also been working from the other end, focusing on the geographically-flawed thinking in state legislatures that punishes some drug crimes more severely because they happen to be committed in an urban area. These laws don’t work, can’t ever work, and lead directly to increasing the racial disparities in our nation’s prisons.
Over the years, we’ve done a number of detailed state specific reports about the problem and the obvious solutions, and today we present a short video that explains the fundamental flaw in these laws: When you make everywhere special, nowhere is special.
For more information, see our overview page about sentencing enhancement zones, and some of our previous reports:
 Reaching too far: How Connecticut’s large sentencing enhancement zones miss the mark
by Aleks Kajstura, March 2014.
This report analyzes Connecticut’s 1,500-foot sentencing enhancement zones, mapping the zones in the state’s cities and towns and demonstrating both that the law is ineffective, and that it creates an “urban penalty”.
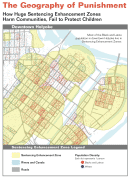 The Geography of Punishment: How Huge Sentencing Enhancement Zones Harm Communities, Fail to Protect Children
by Aleks Kajstura, Peter Wagner and William Goldberg, July 2008.
This first-of-a-kind report mapped every sentencing enhancement zone in urban, rural and suburban Hampden County, and quantified the race and ethnicity of the people who live inside and outside of the zones.
 Reaching too far, coming up short: How large sentencing enhancement zones miss the mark
by Aleks Kajstura, Peter Wagner and Leah Sakala
January, 2009.
This followup report again focusing on Hampden County Massachusetts found that Blacks are 26 times as likely, and Latinos 30 times as likely as White residents to be convicted and receive a mandatory sentencing enhancement zone sentence.
Our report goes viral and takes down our website. This is a good problem to have.
by Sarah Hertel-Fernandez,
June 27, 2014
Prisonpolicy.org was down for almost four hours on Thursday afternoon. The cause? Our report showing each U.S. state’s use of the prison into an international context, released two weeks ago, had gone viral in an unprecedented way. With 185 requests every second, the website couldn’t keep up. This was a good problem to have….
The report vividly illustrates that, when compared to the rest of the world, the United States is quite literally off the charts:
The National Institute of Corrections says of our “excellent” graphic and report:
“This is required reading for those people striving to reform the correctional system in the United States…. or anyone concerned with issues related to confinement…. It definitively shows that the use of incarceration by individual states dwarfs the utilization of imprisonment around the world.”
It was gratifying to see so many people and organizations use the data to draw their own connections and conclusions:
Brian Smith wrote a great piece for MLive.com about the report:
Michigan’s rate is below the national rate, at 628 inmates per 100,000, but that’s still high enough to exceed every other country in the world.
Vox’s German Lopez wrote an article pairing the chart with information about the rise of incarceration in the U.S. and its causes.
“Even the most liberal state in America has a higher incarceration rate than most other countries around the world… Vermont, the state with the lowest incarceration rate, still imprisons people at far higher rates than countries like New Zealand, the UK, and even conflict-torn Israel.”
And others offered international context:
It was particularly exciting to see some of the articles emphasize the report’s methodology and indirectly refer to our work urging the Census Bureau to count incarcerated people as residents of their legal home addresses instead of their remote prison cells. See this example from Eileen Shim on Mic.com:
One important thing to keep in mind is that these numbers are taken from the 2010 US Census, which counts inmates as residents of the states where they are behind bars. As such, it does not accurately reflect where the inmates are actually from, since a large portion of the incarcerated population happen to be in federal or state prisons in states they are not originally from. Still, as Prison Policy Initiative notes, “State politics certainly influence whether and where federal prisons are built,” and it’s worth knowing which states decide to open their doors to more inmates.
So if you haven’t had a chance to check out States of Incarceration: The Global Context, a collaboration between Executive Director Peter Wagner and Senior Policy Analyst Leah Sakala at the Prison Policy Initiative and Data Artist Josh Begley, now is the time.
And if you enjoyed the report, please consider making a donation today to help us pay for the server upgrade we need keep producing this kind of content and sharing it with the world.
RRASC intern Sophia Robohn sums up the social media response to PPI's new 50-state incarceration profile series.
by Sophia Robohn,
June 16, 2014
2 weeks ago, Prison Policy Initiative staff Peter Wagner and Leah Sakala released two briefings on profiles they created of national and state incarceration rates, a task previously performed by the federal government. The reports revealed the significant role that states play in determining what mass incarceration looks like.
Peter’s briefing, Tracking State Prison Growth in 50 States, focuses on the increasing rates of incarceration nationally and by state, dating back several decades. Leah’s briefing, Breaking Down Mass Incarceration in the 2010 Census: State-by-State Incarceration Rates by Race/Ethnicity, gives us grave figures to begin to comprehend racial disparities in every states’ prisons and jails.
For many, these conclusions are not new; but this data presented by PPI are the first intensive reports of this kind, and it is sparking new conversations about how to shape perception of mass incarceration. Prison Policy Initiative also created a set of state profiles that combines the material presented in the reports, making it easier to interpret at the state level. Supporters on social media are starting these discussions using the reports and profiles.
Piper Kerman, author and creator of Orange is the New Black, called the reports “excellent” and tweeted both the profiles and reports to her followers:
Commenting on the size and value of this data, Philip Cohen, sociologist and demographer at the University of Maryland also posted about it (which was then retweeted by Katrina vandenHeuvel, editor and publisher of The Nation):
Social justice organizations are also tweeting about the state profiles to their followers. Creating smaller community understandings of these large sets of data can help relate the work back to people, as demonstrated by these groups:
The Women’s Prison Association in New York City, an advocacy group for women in the criminal justice system, tweeted:
State advocates and civil rights group, The ACLU of Louisiana, also tweeted:
The reports also sparked some great articles. Nicole Flatow, a writer with ThinkProgress.org, highlighted our findings about state roles in incarceration rates and the hidden roles of local jails, in an article called “The Exponential Growth of American Incarceration, in Three Graphs”:
But for all the talk these past few months about the federal prison population — and the concerns there are urgent — these charts call out the major perpetrators of the prison explosion: the states, where incarceration rates have increased more than fourfold.
While the report does not focus on local jails, they make up some 30 percent of U.S. incarceration by PPI’s count. People in jails are typically held for shorter periods of time, either while awaiting trial or for less serious crimes. But these jails will also come into play as states consider reducing mass incarceration. Many put behind bars for marijuana possession, for example, end up in local jails. And Alabama earned the distinction last year of detaining the only U.S. journalist incarcerated for doing his job in a county jail.
Pete Brook wrote a great piece on his Prison Photography blog that summed up his excitement for the reports and Prison Policy Initiative’s entitled “Every Graph, Stat and Data Point You Need For Research on U.S. Mass Incarceration,” writing,
Not content with *only* filing lawsuits, pressing states to move away from Prison Based Election Gerrymandering; battling corrupt and expensive jail phone systems; and protecting prisoners’ rights to communicate unhindered by letter, PPI is committed to providing fellow prison reformers with accurate up-to-date data on mass incarceration. We cannot rely on the government to provide recent data.
PPI has used data from the more recent 2010 U.S. Census counts to measure each state’s incarceration rates by race and ethnicity. Most (57%) people incarcerated in the United States have been convicted of violating state law and are imprisoned in a state prison. Monitoring trends at the state-level is imperative.
It’s exciting to see what discussions are beginning around the state profiles on incarceration, and how people and organizations are grappling with its’ implications. We are just beginning to see how and what these profiles can be used for to improve the current standards for mass incarceration.
Sophia Robohn is supported by the Civil Liberties and Public Policy Program.
by Leah Sakala,
June 13, 2014
The Huffington Post just published my new article, The Father’s Day Profiteers That Put Hallmark to Shame. Here’s how it starts:
This Sunday, more than a million families will face a huge Father’s Day problem, and it’s not figuring out which tie pattern dad would like best. It’s the astronomical cost of wishing him a Happy Father’s Day over the phone if he happens to be one of the 1.2 million parents in prison or jail. That’s because the prison telephone industry wants to charge families as much as $1/minute just to tell incarcerated loved ones that they are loved and missed.
The article includes some heart-breaking first-hand testimonies from the tens of thousands of petition messages that we collected with SumOfUs calling for Federal Communication Commission (FCC) regulation:
- “…because I’m a single mom now, I can’t afford to indulge [my daughter] so she can talk to the only man she’s ever called Daddy. That is wrong.”
- “My little boy turned one today and it cost $12 for his dad to be able to sing him happy birthday. It’s not right that prison phone calls are so overpriced.”
- “While [my son’s] dad tries to write letters & cards, talking on the phone is a much more accessible way to connect with and develop a semblance of a relationship with a small child. My son rarely gets to talk to his dad anymore…”
- “My son’s father has been in prison for most of my son’s life. My son has only spoken to his father once in the last 10 years. My son is 14 now. If it were more affordable to speak to his father, perhaps my son would feel like he has some sort of connection with his father.”
- “My dad was in jail when I was a child and at this price there is no way my mom would have been able to afford to let me talk to him. Without my dad I would not be who I am today.”
Alongside these families that have been calling for prison phone justice for more than a decade, here at Prison Policy Initiative we’ll keep fighting to ensure that families can afford to stay connected on Father’s Day and every day.
Legislators listen up,
we want fair elections!
You can't count constituents
in your house of corrections!
by Leah Sakala,
June 12, 2014
I have the good fortune to be a bike commuter for most of the year, which gives me some good bike path thinking time every morning. A couple of years ago, I was riding along and mulling over ways to explain prison gerrymandering (as you do) when the lyrics started to come to me for a new spin on the classic Yankee Doodle.
Here’s how it starts:
If there’s a prison in your district,
don’t get so elated
‘cause it’s not fair to count folks there
who are incarcerated
Your district may be padded full,
but please don’t you gloat
’cause you are violating my right
to one person, one vote
Chorus:
Legislators listen up,
we want fair elections!
You can’t count constituents
in your house of corrections
The full sing-along print-out version is here.
How does your state compare to the international community when it comes to the use of incarceration? Not very well, says a new infographic and report by the Prison Policy Initiative and data artist Josh Begley.
June 11, 2014
 June 11, 2014 — How does your state compare to the international community when it comes to the use of incarceration? Not very well, says a new infographic and report by the Prison Policy Initiative and data artist Josh Begley.
This report, “States of Incarceration: The Global Context,” recognizes that while there are important differences between how U.S. states handle incarceration, incarceration policy in every region of this country is out of step with the rest of the world.
“It is essential to focus on the incarceration practices of individual states,” said Peter Wagner, Executive Director of the Prison Policy Initiative. “Most criminal justice policy decisions are made at the state level and the vast majority of the people locked up are locked up for violating state laws,”
This report is the first to directly situate individual U.S. states in the global context. The report and infographic draws international figures on incarceration from the International Centre for Prison Studies and state-level data from the U.S. Census Bureau.
“Compared to Louisiana, most U.S. states appear to have reasonable rates of incarceration, but it is disturbing to see where these ‘reasonable’ states stack up in the broader carceral landscape,” said data-artist and co-author Josh Begley.
The non-profit, non-partisan Prison Policy Initiative produces cutting edge research to expose the broader harm of mass incarceration, and then sparks advocacy campaigns to create a more just society. Josh Begley, a graduate of the Interactive Telecommunications Program at New York University, is most famous for creating an iPhone app that tracks every reported United States drone strike. Past collaborations between Mr. Begley and the Prison Policy Initiative have included an infographic about whether the states that bar the most people from the polls should in fact be picking the next president and Prison Map, a website exploring the geography of incarceration.
Links:
– 30 –
Senator Robert Byrd’s passion for pork was legendary, and his love for prison-flavored pork helped fuel the record breaking growth in the federal prison population.
by Peter Wagner,
June 10, 2014
While preparing our report Breaking Down Mass Incarceration in the 2010 Census: State-by-State Incarceration Rates by Race/Ethnicity, we discovered something interesting: West Virginia has more federal prison cells per capita than any other state. In fact, there are more people incarcerated in federal prisons in the state than are incarcerated in state and local jails combined.
Almost one out of every 200 people in the state is locked up in a federal prison, a rate more than seven times higher than the country as a whole. Of course, this doesn’t meant that West Virginians violate federal law more than other states, but it does mean that that state has more federal prisons than anywhere else. (And given the fact that West Virginia is one of the whitest states in the country, it certainly makes a difference to the demographics reported in the census.)
So why does West Virginia have so many federal prisons? Because until 2010, the senior senator on the U.S. Senate’s appropriation’s committee was West Virginia Senator Robert Byrd. As the longest serving U.S. Senator in history — not to mention multi-term Chairman of the Senate Committee on Appropriations — Byrd was powerful, and he focused his political clout on bringing as much federal money in to West Virginia as he could.
Senator Byrd’s passion for pork was legendary and his love for prison-flavored pork helped fuel the record breaking growth in the federal prison population over the last three decades. That’s because prison is no exception to the saying “if you build it, they will come.”
Now, it would be fair to wonder if Senator Byrd wasn’t just advocating for his state to receive federal prison money that was already earmarked to be spent somewhere. Unfortunately, the historical record makes it clear that support from the longest serving U.S. Senator in history can make things happen that wouldn’t otherwise, such as the opening of brand new FCI McDowell prison despite the Bush administration’s attempts to cut it from the budget.
Source: Jake Stump, “Byrd hopes the $126 million he secured to run prisons is really secure” Charleston Daily Mail, July 12, 2007.


