County and city jails have been called “mass incarceration’s front door,” but campaigns to reform or close jails often don’t receive the attention they deserve. Why? Because the traditional way we measure the impact of jails – the average daily population – significantly understates the number of people directly affected by these local facilities.
Because people typically stay in jail for only a few days, weeks or months, the daily population represents a small fraction of the people who are admitted over the course of a year. But the statistic that better reflects a jail’s impact on a community – the number of people who go to jail – is rarely accessible to the public.
Thankfully, we can now get close to closing this gap in the data and making the impact of jails clearer. Building on our new national report Arrest, Release, Repeat, we’re able to estimate the number of people in every state who go to local jails each year.
To produce these estimates, we analyzed results of the National Survey on Drug Use and Health, an annual survey that primarily concerns health trends but also contains useful data about individuals who have been arrested. The table below shows the results of our state-by-state analysis. For a rich demographic breakdown of people who go to jail (including how many go to jail multiple times a year), see our national report.
Sources and data notes: Estimates of the average daily jail population in every state come from the Bureau of Justice Statistics’ Mortality in Correctional Institutions Statistical Tables (2014). Daily population estimates are not available for six states (Alaska, Connecticut, Delaware, Hawaii, Rhode Island, and Vermont) where the jail system is mostly or entirely integrated into the state prison system. Estimates of how many people in every state go to local jails every year come from our own analysis of the National Survey on Drug Use and Health (NSDUH) 2-Year RDAS (2016-2017). It is important to note that the NSDUH survey methodology excludes several groups, including two groups of people likely to be arrested: people in “group quarters” (like jails, prisons, and hospitals) and people who are homeless and do not use shelters. Because of these exclusions, our estimates of how many people go to jails each year represent a minimum. For a detailed analysis of who goes to jail every year and how many times they go, see our national report Arrest, Release, Repeat. To find out how many people every year are admitted specifically to your county jail, ask your county sheriff.
State
Number of unique annual jail admissions
State population
Unique jail admissions per 100,000 state residents
Average statewide daily jail population
Alabama
90,000
4,867,646
1,849
14,322
Alaska
11,000
740,659
1,485
n/a
Arizona
117,000
6,962,456
1,680
13,961
Arkansas
45,000
2,996,255
1,502
7,945
California
368,000
39,416,565
934
82,440
Colorado
87,000
5,568,630
1,562
12,209
Connecticut
45,000
3,587,935
1,254
n/a
Delaware
18,000
957,319
1,880
n/a
District of Columbia
12,000
689,154
1,741
1,969
Florida
350,000
20,820,495
1,681
54,002
Georgia
236,000
10,371,500
2,275
43,720
Hawaii
15,000
1,428,111
1,050
n/a
Idaho
27,000
1,698,485
1,590
3,685
Illinois
173,000
12,818,875
1,350
22,536
Indiana
122,000
6,650,413
1,834
17,234
Iowa
40,000
3,138,290
1,275
4,326
Kansas
60,000
2,910,427
2,062
7,483
Kentucky
89,000
4,445,151
2,002
22,028
Louisiana
86,000
4,685,245
1,836
31,169
Maine
14,000
1,333,070
1,050
1,820
Maryland
83,000
6,038,465
1,375
11,164
Massachusetts
70,000
6,841,770
1,023
10,228
Michigan
163,000
9,947,878
1,639
16,990
Minnesota
69,000
5,550,828
1,243
6,930
Mississippi
84,000
2,984,758
2,814
13,071
Missouri
128,000
6,102,354
2,098
11,350
Montana
18,000
1,044,575
1,723
2,318
Nebraska
30,000
1,913,840
1,568
3,489
Nevada
38,000
2,968,647
1,280
7,286
New Hampshire
25,000
1,338,905
1,867
2,200
New Jersey
86,000
8,992,030
956
14,997
New Mexico
49,000
2,086,751
2,348
8,278
New York
267,000
19,842,843
1,346
27,453
North Carolina
128,000
10,215,054
1,253
19,412
North Dakota
13,000
755,471
1,721
1,418
Ohio
150,000
11,640,582
1,289
19,112
Oklahoma
96,000
3,926,036
2,445
13,599
Oregon
42,000
4,114,383
1,021
5,985
Pennsylvania
170,000
12,796,311
1,329
37,764
Rhode Island
19,000
1,058,603
1,795
n/a
South Carolina
89,000
4,992,096
1,783
11,501
South Dakota
25,000
865,604
2,888
1,733
Tennessee
117,000
6,682,694
1,751
27,210
Texas
505,000
28,104,729
1,797
66,434
Utah
32,000
3,073,077
1,041
7,352
Vermont
9,000
623,506
1,443
n/a
Virginia
111,000
8,442,200
1,315
30,159
Washington
98,000
7,343,339
1,335
12,311
West Virginia
34,000
1,822,247
1,866
4,292
Wisconsin
129,000
5,784,200
2,230
13,209
Wyoming
8,000
582,113
1,374
1,940
Overall
4,889,000
324,562,557
1,506
750,128
Understanding the true number of people directly affected by local jails allows policymakers to better assess the impact of jail policies. But more importantly, these statistics ought to prompt state and local policymakers to question whether it is necessary to jail so many people in the first place.
As we found in Arrest, Release, Repeat, people who go to county and city jails are disproportionately likely to have a substance use disorder, suffer from a serious mental illness, and lack health insurance. They’re also significantly more likely to be unemployed, have incomes under $10,000, and lack a high school diploma. States and counties should not be using incarceration to address these serious problems of public health and economic inequality.
Moreover, most jail bookings do not improve public safety. Research from the Vera Institute shows that only 5% of arrests every year are for violent offenses, and our analysis in Arrest, Release, Repeat indicates that even the vast majority (88%) of people arrested multiple times per year don’t pose a serious public safety risk.
Needlessly jailing vulnerable people isn’t only a waste of public money: Even short stints in jail can throw an individual’s life into disarray by forcing them to miss work, isolating them from loved ones, and cutting off any medications they are taking. Considering the enormous human costs of excessive incarceration, policymakers should use this new data to assess whether their jails are being used to protect the public or as a temporary – and ineffective – remedy for social problems.
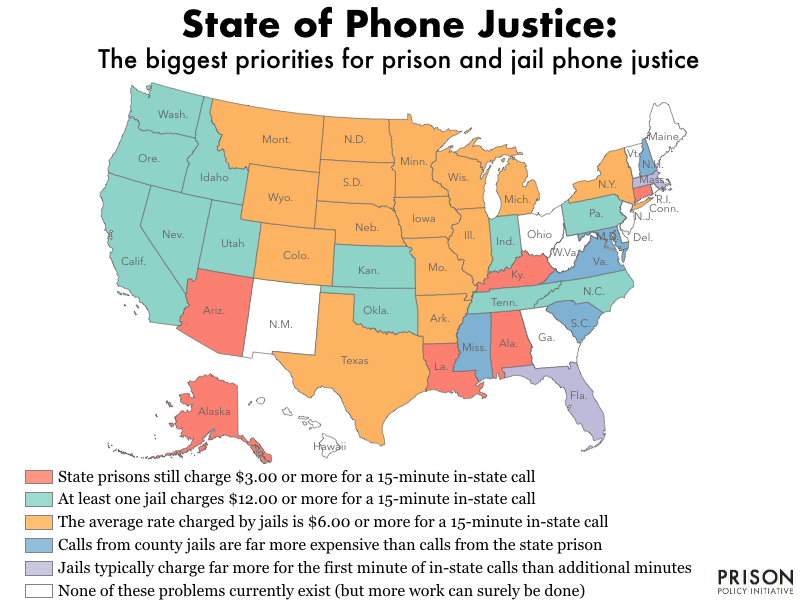
It can be hard to figure out where to start to improve phone justice in each state, especially in the states where legislators, regulators, or individual correctional facilities have already instituted partial reforms. For that reason, we’ve re-organized our national survey of in-state phone rates in to this handy map showing the biggest remaining issues in each state:
No state is perfect on prison and jail telephone issues, and there are many ways to measure “how bad” a state’s prison and jail phone rates are. Some states have good phone rates if they are measured by one criterion, but terrible if measured by a different one. For example, the Minnesota Department of Corrections charges only $0.75 for a 15-minute in-state call from state prison, but the jails in the state charge, on average, $7.19 for the same call. To give a more complete picture of how, exactly, each state is failing, we compiled data on five different measures of prison and jail phone justice (see Table 1 below). For states that rate poorly on multiple measures, the map above offers our opinion about which issue is most important and actionable in that state.
Table 1. How each state fares on five measures of phone justice.
State
State prisons still charge $3.00 or more for a fifteen-minute in-state call (See Table 2)
The average rate charged by jails is $6.00 or more for a fifteen-minute in-state call (See Table 3)
Calls from county jails are far more expensive than calls from the state prison (See Table 4)
At least one jail charges $12.00 or more for a fifteen-minute in-state call (See Table 5)
Jails typically charge far more for the first minute of calls than additional minutes (See Table 6)
Alabama
X
Alaska
X
Arizona
X
Arkansas
X
X
X
California
X
Colorado
X
X
X
Connecticut
X
Delaware
Florida
X
Georgia
Hawaii
Idaho
X
Illinois
X
X
X
X
Indiana
X
X
X
Iowa
X
X
X
Kansas
X
X
X
Kentucky
X
Louisiana
X
Maine
Maryland
X
Massachusetts
X
Michigan
X
X
X
Minnesota
X
X
X
Mississippi
X
Missouri
X
X
X
Montana
X
X
X
Nebraska
X
X
X
Nevada
X
New Hampshire
X
X
New Jersey
New Mexico
New York
X
X
North Carolina
X
North Dakota
X
X
X
Ohio
Oklahoma
X
X
X
Oregon
X
Pennsylvania
X
X
Rhode Island
South Carolina
X
South Dakota
X
X
Tennessee
X
X
Texas
X
X
X
X
Utah
X
X
Vermont
Virginia
X
X
Washington
X
West Virginia
Wisconsin
X
X
Wyoming
X
X
Table 2. Most expensive state prison rates for in-state calls (showing states were the cost is $3 or more)
State
15-Minute Rate from State Prison
Alabama
$3.34
Alaska
$3.15
Arizona
$3.34
Arkansas
$4.80
Connecticut
$3.65
Indiana
$3.60
Kentucky
$3.15
Louisiana
$3.15
Oklahoma
$3.00
Table 3. Average rate charged by jails in each state for in-state calls (showing the most expensive states)
State
Average rate for 15-minute call from jail
Arkansas
$14.19
Colorado
$6.50
Illinois
$7.11
Indiana
$6.31
Iowa
$7.03
Kansas
$8.49
Michigan
$12.03
Minnesota
$7.19
Missouri
$6.90
Montana
$9.24
Nebraska
$8.02
New York
$7.79
North Dakota
$7.62
Oklahoma
$6.34
South Dakota
$7.11
Texas
$6.53
Wisconsin
$7.99
Wyoming
$7.77
Table 4. How much more expensive are jail phone calls in each state compared to prison calls? (Comparing the cost of 15-minute in-state calls and showing states where jail phone calls cost at least 5 times as much as prison calls.)
State
Disparity between average cost of jail call vs. a state prison call
Illinois
52.7
Maryland
5.8
Michigan
5
Minnesota
9.6
Mississippi
9.6
Missouri
9.2
Nebraska
8.5
New Hampshire
23.2
New York
12
North Dakota
6.4
South Carolina
6.9
South Dakota
5.9
Texas
7.3
Virginia
7.4
Table 5. Highest cost for a call in each state (Showing states where at least one jail charges more than $12 for an in-state call)
State
Highest 15-Minute Rate
Arkansas
$24.82
California
$17.80
Colorado
$14.85
Idaho
$17.25
Illinois
$15.52
Indiana
$15.15
Iowa
$14.10
Kansas
$18.62
Michigan
$22.56
Minnesota
$12.02
Missouri
$20.12
Montana
$14.68
Nebraska
$15.80
Nevada
$14.25
North Carolina
$12.00
North Dakota
$12.00
Oklahoma
$18.87
Oregon
$15.75
Pennsylvania
$12.20
Tennessee
$14.29
Texas
$17.25
Utah
$15.06
Virginia
$14.65
Washington
$17.35
Wisconsin
$21.97
Wyoming
$14.22
Table 6. How much more expensive is the first minute of a jail call with subsequent minutes? For example, many jails in New York charge $4.35 for the first minute and $0.40
for subsequent minutes, for a disparity of almost 11 times.) Setting higher first minute rates is a complicated but particularly exploitative practice. (Showing the average disparity between first and subsequent minutes in each state where the first minute cost is at 7 or more times higher than subsequent minutes. States like New York where some or many counties have high first/subsequent minute disparities are not included if the state’s average disparity was less than 7. For county-by-county data, see our 2018 Phones Rate Survey.)
State
Disparity between first minute and subsequent minutes
Colorado
25.04
Florida
7.8
Illinois
8.98
Iowa
9.29
Kansas
25.47
Massachusetts
20.26
Montana
22.84
New Hampshire
9.65
Pennsylvania
7.04
Tennessee
22.49
Texas
15.03
Utah
33.16
For even more detailed data for individual facilities in each state, see these appendix tables from our State of Phone Justice report:
Now that leaders and advocates in each state have easy access to the biggest issues standing in the way of phone justice in their states, it’s time to get moving on making justice a reality.