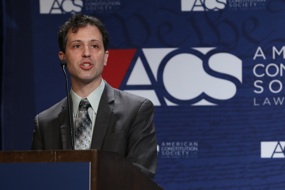
The American Constitution Society has posted the video (and some pictures) from my remarks accepting the David Carliner Award.
by Peter Wagner,
August 12, 2014
In June, I was honored to receive the American Constitution Society’s 2014 David Carliner Public Interest Award. The award “recognizes outstanding public interest lawyers whose work best exemplifies its namesake’s legacy of fearless, uncompromising and creative advocacy on behalf of marginalized people.”
David Carliner (1918-2007) was one of the great public interest lawyers of the 20th Century. He challenged segregation and state bans on interracial marriage, and he fought for the rights of immigrants and the LGBT community. As the founder of the National Capital chapter of the ACLU and the International Human Rights Law Group (now GlobalRights), he was a strong defender of civil liberties and human rights at home and abroad. Carliner liked to say that one shouldn’t mind being an agitator since agitators are the ones who get the dirt out.
I consider the award both a big personal honor and a milestone for the criminal justice reform movement. I went to law school a decade ago when prison populations were going up, and up, and up seemed like the only future. Both the powers that be — and the established progressive movement — were ignoring criminal justice advocates and the idea of criminal justice reform. Things have changed, and it was an honor to celebrate that fact with more than a 1,000 progressive attorneys — including some of the colleagues who encouraged my work over the last decade.
The ACS recently made the video of the award presentation and my remarks available:
(The video starts with ACS President Caroline Fredrickson introducing the award, then David Carliner’s granddaughter Sarah Remes, presenting the award at 3:13, and then my remarks start at 6:30.)
And here are some pictures from that evening:
by Bernadette Rabuy,
August 11, 2014

Today, I had the opportunity to sit down with Sophia Robohn, a Hampshire College student who has been interning at Prison Policy Initiative. Read below to learn more about Sophia.
What brought you to Prison Policy Initiative?
I’m completing a Reproductive Rights Activist Service Corps (RRASC) internship through the Civil Liberties and Public Policy Program at Hampshire College.
Can you tell me more about the internship program?
RRASC sends interns to disciplines that intersect with reproductive rights and gender equality. These disciplines include immigrant rights, local food, and education.
What are some of your interests?
I study medical anthropology and women’s health at Hampshire College. I am heavily involved in feminist studies and activism at Hampshire College as well as emergency medicine.
What projects have you been working on at Prison Policy Initiative?
I have started research on the way school boards district when they have prisons within their boundaries and how that affects the principle of “one person, one vote.” This has included calling everyone from school board secretaries to court judge executives to find district maps, population data, and how they use Census Bureau data to draw their districts.
Why are school boards important?
While there tends to be more interest in congressional districts, school boards can be more heavily impacted by redistricting. I have also seen the way that local politics interfere with school boards. At the end of the day, school boards are responsible for important tasks such as determining school budgets as well as curricula.
What has surprised you about the work you’ve done?
There is a widespread lack of knowledge on how places district and the history of redistricting among school boards. I’ve had superintendents ask me to send them their own district maps because they don’t have a copy. I’ve talked to school board secretaries who know nothing about how their school board is set up or elected.
What has been particularly challenging about the work?
The most difficult part about understanding how school districts work is knowing who to call and when to do so when it seems like you have run out of options. From that, I’ve learned that it’s important to find out if the school district used a demographer or if the district drew the lines themselves. Sometimes, this is in crayon or marker, making maps difficult to decipher. For example, Warrior Run School District in Union County, Pennsylvania has a map that is particularly hard to read and drawn in marker. For El Reno School District in Oklahoma, the map is on the back of a newspaper clipping and is over 20 years ago. Another challenge is finding the right words to say. For example, precinct can mean a polling place in one school district, and, in another school district, it can mean an actual district with boundaries. Terms vary by state and even by county.
What are some questions that you are still hoping to explore?
I’m hoping to learn more about why school boards choose districts over at-large representation in certain areas of the country.
Thank you for your time. Best of luck!
Thank you! I’m really excited about the work I did at Prison Policy Initiative this summer, and I will be on the lookout for future work on prison gerrymandering.
Thanks to Sophia, we will have updates coming soon to our Prisoners of the Census page. Stay tuned!
Awesome piece with one small mistake on the difference between prisons and jails.
by Peter Wagner,
August 4, 2014
In case you missed it, two weeks ago comedian John Oliver did an amazing 17 minute piece on the U.S. prison system on his Last Week Tonight program:
Now as Cari Gervin notes on the Metro Pulse blog, one thing that Oliver gets wrong is the difference between prisons and jails:
It’s a good piece, and it should make you infuriated—the state of mass incarceration in this country is atrocious. Privatizing—and profiting from—locking up people is really screwed up. But there’s one point Oliver misses. Right after showing a clip from Sesame Street, Oliver says, “At least Sesame Street is actually talking about prison. The rest of us are much happier completely ignoring it, perhaps because it’s so easy not to care about prisoners. They are by definition convicted criminals.”
Actually, 428,000 of the people locked up each day are presumed innocent. They have either just been arrested and are trying to make bail, or they are too poor to make bail and are being held until trial. Now this population is a portion — 18% — of the 2.4 million people who are locked up, but the speed at which people churn through jails adds up to big numbers: jails lock up 12 million people over the course of a year. That’s a lot of people, and as Cari Gervin notes: “conditions in local jails are often much worse—and more restrictive—than state or federal prisons”. She attributes the conditions to the fact that “municipal budgets are even more strapped than state budgets” although I’d make the point that because jails are all operated independently, there is less oversight and less attention paid to identifying and following best practices.
Now one of the worst practices is the idea of making families pay to visit their loved ones, and that’s something that to my knowledge exists only in jails, as I can’t imagine a state prison system banning in-person visitation and requiring people to use expensive paid video visitation instead. But sadly, a number of jails do this, and that’s the subject of Cari Gervin’s excellent cover story in Metro Pulse about the Knox County, Tennessee jail.
 Toward the end of the Last Week Tonight video, Oliver sits on a stoop talking to puppets about their parents in jail. “That’s actually a zoo, that’s different,” Oliver says to an crocodile complaining that his “daddy’s in jail and people pay money to see him.”
The comedic effect gets lost when you consider just how much money people have to pay to see their incarcerated human relatives.
Remembering Edwin "Eddie" Ellis.
by Peter Wagner,
July 25, 2014

Photo of Edwin “Eddie” Ellis speaking at Citizens Against Recidivism, Inc. (Photo: Citizens Against Recidivism, Inc.)
I was saddened to read this morning of the passing of Eddie Ellis, one of the first people to encourage my work to end prison gerrymandering, frequently inviting me to his On the Count radio program on WBAI.
Being on his program, and having Eddie introduce me to other important activists in New York City was a great honor for a young law student and then young lawyer, but I don’t think I ever told him that I was a fan of his long before he starting telling people to read my Importing Constituents report.
I first learned of Eddie Ellis from footage when he was still incarcerated in the excellent film The Last Graduation about the value of higher education in prisons and the horrible decision by the Clinton administration and Congress to end Pell Grants for incarcerated people, thereby shutting down very cost-effective college programs nationwide.
Eddie, a former Black Panther, served 23 years for a murder he didn’t commit. After his release, Eddie hit the ground running, continuing the work he started when he was on the inside. As the New York Times summarized a decade ago:
Rather than talk in broad sociological terms of crime and punishment, Mr. Ellis and his prison colleagues prefer to sketch out a sociological whirlwind: 47 percent prisoner recidivism rooted in an annual traffic of 26,000 prisoners going in and 23,000 coming out…
Out-of-Date Strategies
“The fact that must be faced, then, is that at least 11,000 new crimes are going to be committed by these guys coming out, most of them in their home neighborhoods,” Mr. Ellis stressed. “So what we do in the prisons can’t be done in the abstract, removed from these neighborhoods and their Afrocentric and Latino cultures.” Traditional prison strategies, he argued, are 50 years out of date and geared for the “Jimmy Cagney” days when Italian and Irish prisoners were the white majority in a much smaller, pre-drug-culture prison population.
The study groups within the prisons have crafted room for their activities from the tolerance for reform that followed the Attica prison riot of 1971. The chief groups, sometimes operating with church or civil rights sponsors, meet regularly in Green Haven, Eastern, Sing Sing, Woodbourne, Walkill and Auburn prisons. Each year they sponsor a seminar rooted in their nontraditional approach and attended by outside specialists.
…
[Ellis is interested] in shaping fresh changes in prison and tapping what he and some prison administrators see as a thoughtful talent pool of first-hand experience residing behind bars. Even more, as he exults in being back on the streets of Harlem, his beloved birthplace, Mr. Ellis keeps his departing galley-ship image of the prison system in mind.
“We’ve had enough textbook penology,” he said, trying to urge an outside world sick of the deepening rut of crime and punishment to consider alternative perspectives from some of the system’s resident experts.
The organization that Eddie founded, the Center for Nu Leadership, has a longer obituary.
David Carliner Award Finalist Barbara Graves-Poller tells the FCC that New York prison phonecall price gouging routinely causes people to lose their parental rights.
by Peter Wagner,
July 24, 2014
One of the highlights of the American Constitution Society Conference in Washington DC was quite serendipitous. I was at the conference to accept the David Carliner Public Interest Award, and I had the opportunity to have an amazing dinner with David Carliner’s family and the finalist for the award, Barbara Graves-Poller. Barbara mentioned her travel plans for the next day, and I recognized that on my way to a family event I’d be driving directly past the same New York City airport she needed to get to. I offered her a ride, and we had a long conversation about the intersections between our work that led to three collaborations. First I’m excited to announce that Barbara joined the Prison Policy Initiative advisory board. Secondly I’d like to share how Barbara’s work in family law provided powerful support to our work on regulating the prison phone industry. (Stay tuned for collaboration #3.)
Barbara is a supervising attorney at MFY Legal Services in New York City, where she specializes in providing legal representation to “kinship caregivers”, i.e., “grandparents and other relatives caring for children whose biological parents are unavailable due to incarceration, illness, death or other causes.” In so many cases in our poorest communities, incarceration is what rips families apart.
Now, I’ve been working to bring fairness to the prison and jail telephone industry for a long time, but what Barbara said next still shocked me: In New York, high phone costs can cost incarcerated parents their parental rights.
Barbara sent a three page letter to the Federal Communications Commission, alerting them to this important additional reason why further reductions in the unnecessary cost of calling home from prison or jail is necessary. The whole letter is a must read, but check out this excerpt first:
I. Inmates’ Relatives Often Serve as Informal “Kinship Caregivers” for Children and Cannot Bear the Expense of Uncapped Collect Calls
…
Taken together, the poverty and lack of social supports that define the kinship caregiver community make unreasonably high telephone bills particularly burdensome. As a consequence, low-income family members may be discouraged from taking in children with incarcerated parents, thus resulting in an increase in the foster care population, or restrict communications between children and their parents in prison.
II. Inmates Who Cannot Communicate with their Children or the Children’s Caregivers Routinely Lose their Parental Rights
Under New York Domestic Relations Law S 111(2), a parent who fails to visit or communicate with his or her child or designated caregiver for six months is deemed to have forfeited his or her parental rights. See In re Annette B., 828 N.E.2d 661 (N.Y. 2005). Incarcerated parents are not exempted from this rule and bear the burden of convincing a judge that they were unable to communicate with their children or provide financial assistance while in prison. Furthermore, nothing in the Domestic Relations Law requires foster care agencies to facilitate communications between incarcerated parents and their children. Indeed, many foster care agencies currently do not accept collect calls. Foster parents have discretion to accept collect calls but are not required to incur such expenses as a condition of caregiving.
Accordingly, inmates with children in the foster care system and kinship care arrangements risk losing their parental rights if they or their children’s caregivers cannot afford to pay for telephone communications. Time and again, New York courts terminate parental rights of currently and recently incarcerated parents because of the parent’s failure to communicate within the statutory period set forth in the Domestic Relations Law. In In re Yamilette MG., 986 N.Y.S.20 485, 487 (N.Y. App. Div. 2014), for example, the appellate court made clear that a father’s “incarceration did not absolve him of the responsibility to provide financial support for the child, according to his means, and to maintain regular contact with the child or the petitioner.” It made no inquiry into the father’s ability to afford calls while incarcerated, nor did it require proof that the foster care agency helped to facilitate communications between the father and child….
Thank you, Barbara, for sharing your experience with the FCC, and thank you Carliner Family and the American Constitution Society for making this connection.
And stay tuned for what the FCC does next.
Alabama’s new rules will force prison phone industry to end kickbacks from Western Union/MoneyGram.
by Peter Wagner,
July 21, 2014
On July 7, the Alabama Public Service Commission announced new rules to go into effect on October 1 to cap the rates and fees charged by the prison and jail telephone industry operating in that state.
The new rules are notable for addressing not just the high rates charged to families for each phone call, but also for the comprehensive way in which Alabama addresses the additional fees that families must pay to open accounts, deposit money, have accounts, and receive refunds. Fees are complicated and get less attention than the rates, but fees are important. As we explain in our Please Deposit All Your Money report, we found that fees account for 38% of the money spent on calls from correctional facilities.
The final rules largely resemble the proposed rules we analyzed and praised last year. And the new order confirms that the phone companies are not somehow exempt from unclaimed property laws, and must refund unused pre-paid funds to the customers or hand it over to the State as well as imposing new rules that discourage jails from banning in-person visitation to replace it with paid video visitation.
And most notably, the new rules significantly strengthen the Alabama Public Service Commission’s finding that many parts of the industry are receiving secret kickbacks from payment processors like Western Union and MoneyGram and creates a solution that should have an immediate nation-wide impact.
The final rules require all companies operating in Alabama to submit to the Commission by October 1 the fees charged by third party companies like Western Union and MoneyGram to send payments to that company. If the fee is more than the more typical charge of $5.95:
the provider shall submit a sworn affidavit signed by the provider’s Owner, President, or Chief Executive Officer and notarized, affirming that the ICS provider, its parent company, nor any subsidiary/affiliate of the provider or its parent company receives no portion of the revenue charged the provider’s customers by the listed third-party payment transfer services. For any payment transfer fee that exceeds $5.95, the ICS provider shall also provide to the Commission a copy of the provider’s contract with the third-party payment transfer service and shall justify to the Commission in writing, signed by the provider’s Owner, President, or Chief Executive Officer, why it is unable to arrange for payment transfer services at fees that do not exceed $5.95. (¶ 8.20)
Assuming that the companies aren’t willing to commit perjury, the companies will have three choices:
- Renegotiate the contract like NCIC did to lower the price charged to families.
- Renegotiate the contact just for payments in Alabama, thereby admitting to every other state that kickbacks are in place elsewhere.
- Give up the Western Union and MoneyGram kickbacks nation-wide.
Given that poor people often don’t have access to banks and credit cards and must instead rely on services like Western Union and MoneyGram, this order will have a massive impact, leaving families with more money to spend on the actual phone calls or other family needs. Bravo Alabama!
Other states: What are you waiting for?
Our new video explains that sentencing enhancement zone laws (a.k.a. school zone laws) do not work and will never work.
by Peter Wagner,
June 30, 2014
One of our specialties here at the Prison Policy Initiative is explaining the geographic implications of criminal justice policy. Sometimes we focus on how criminal justice policy — and the forced migration of millions of people to remote prisons cells — distorts our electoral process through prison gerrymandering.
We’ve also been working from the other end, focusing on the geographically-flawed thinking in state legislatures that punishes some drug crimes more severely because they happen to be committed in an urban area. These laws don’t work, can’t ever work, and lead directly to increasing the racial disparities in our nation’s prisons.
Over the years, we’ve done a number of detailed state specific reports about the problem and the obvious solutions, and today we present a short video that explains the fundamental flaw in these laws: When you make everywhere special, nowhere is special.
For more information, see our overview page about sentencing enhancement zones, and some of our previous reports:
 Reaching too far: How Connecticut’s large sentencing enhancement zones miss the mark
by Aleks Kajstura, March 2014.
This report analyzes Connecticut’s 1,500-foot sentencing enhancement zones, mapping the zones in the state’s cities and towns and demonstrating both that the law is ineffective, and that it creates an “urban penalty”.
 The Geography of Punishment: How Huge Sentencing Enhancement Zones Harm Communities, Fail to Protect Children
by Aleks Kajstura, Peter Wagner and William Goldberg, July 2008.
This first-of-a-kind report mapped every sentencing enhancement zone in urban, rural and suburban Hampden County, and quantified the race and ethnicity of the people who live inside and outside of the zones.
 Reaching too far, coming up short: How large sentencing enhancement zones miss the mark
by Aleks Kajstura, Peter Wagner and Leah Sakala
January, 2009.
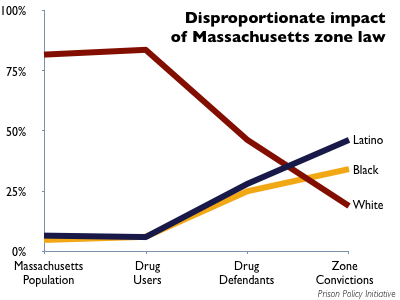
This followup report again focusing on Hampden County Massachusetts found that Blacks are 26 times as likely, and Latinos 30 times as likely as White residents to be convicted and receive a mandatory sentencing enhancement zone sentence.
Our report goes viral and takes down our website. This is a good problem to have.
by Sarah Hertel-Fernandez,
June 27, 2014
Prisonpolicy.org was down for almost four hours on Thursday afternoon. The cause? Our report showing each U.S. state’s use of the prison into an international context, released two weeks ago, had gone viral in an unprecedented way. With 185 requests every second, the website couldn’t keep up. This was a good problem to have….
The report vividly illustrates that, when compared to the rest of the world, the United States is quite literally off the charts:
The National Institute of Corrections says of our “excellent” graphic and report:
“This is required reading for those people striving to reform the correctional system in the United States…. or anyone concerned with issues related to confinement…. It definitively shows that the use of incarceration by individual states dwarfs the utilization of imprisonment around the world.”
It was gratifying to see so many people and organizations use the data to draw their own connections and conclusions:
Brian Smith wrote a great piece for MLive.com about the report:
Michigan’s rate is below the national rate, at 628 inmates per 100,000, but that’s still high enough to exceed every other country in the world.
Vox’s German Lopez wrote an article pairing the chart with information about the rise of incarceration in the U.S. and its causes.
“Even the most liberal state in America has a higher incarceration rate than most other countries around the world… Vermont, the state with the lowest incarceration rate, still imprisons people at far higher rates than countries like New Zealand, the UK, and even conflict-torn Israel.”
And others offered international context:
It was particularly exciting to see some of the articles emphasize the report’s methodology and indirectly refer to our work urging the Census Bureau to count incarcerated people as residents of their legal home addresses instead of their remote prison cells. See this example from Eileen Shim on Mic.com:
One important thing to keep in mind is that these numbers are taken from the 2010 US Census, which counts inmates as residents of the states where they are behind bars. As such, it does not accurately reflect where the inmates are actually from, since a large portion of the incarcerated population happen to be in federal or state prisons in states they are not originally from. Still, as Prison Policy Initiative notes, “State politics certainly influence whether and where federal prisons are built,” and it’s worth knowing which states decide to open their doors to more inmates.
So if you haven’t had a chance to check out States of Incarceration: The Global Context, a collaboration between Executive Director Peter Wagner and Senior Policy Analyst Leah Sakala at the Prison Policy Initiative and Data Artist Josh Begley, now is the time.
And if you enjoyed the report, please consider making a donation today to help us pay for the server upgrade we need keep producing this kind of content and sharing it with the world.
RRASC intern Sophia Robohn sums up the social media response to PPI's new 50-state incarceration profile series.
by Sophia Robohn,
June 16, 2014
2 weeks ago, Prison Policy Initiative staff Peter Wagner and Leah Sakala released two briefings on profiles they created of national and state incarceration rates, a task previously performed by the federal government. The reports revealed the significant role that states play in determining what mass incarceration looks like.
Peter’s briefing, Tracking State Prison Growth in 50 States, focuses on the increasing rates of incarceration nationally and by state, dating back several decades. Leah’s briefing, Breaking Down Mass Incarceration in the 2010 Census: State-by-State Incarceration Rates by Race/Ethnicity, gives us grave figures to begin to comprehend racial disparities in every states’ prisons and jails.
For many, these conclusions are not new; but this data presented by PPI are the first intensive reports of this kind, and it is sparking new conversations about how to shape perception of mass incarceration. Prison Policy Initiative also created a set of state profiles that combines the material presented in the reports, making it easier to interpret at the state level. Supporters on social media are starting these discussions using the reports and profiles.
Piper Kerman, author and creator of Orange is the New Black, called the reports “excellent” and tweeted both the profiles and reports to her followers:
Commenting on the size and value of this data, Philip Cohen, sociologist and demographer at the University of Maryland also posted about it (which was then retweeted by Katrina vandenHeuvel, editor and publisher of The Nation):
Social justice organizations are also tweeting about the state profiles to their followers. Creating smaller community understandings of these large sets of data can help relate the work back to people, as demonstrated by these groups:
The Women’s Prison Association in New York City, an advocacy group for women in the criminal justice system, tweeted:
State advocates and civil rights group, The ACLU of Louisiana, also tweeted:
The reports also sparked some great articles. Nicole Flatow, a writer with ThinkProgress.org, highlighted our findings about state roles in incarceration rates and the hidden roles of local jails, in an article called “The Exponential Growth of American Incarceration, in Three Graphs”:
But for all the talk these past few months about the federal prison population — and the concerns there are urgent — these charts call out the major perpetrators of the prison explosion: the states, where incarceration rates have increased more than fourfold.
While the report does not focus on local jails, they make up some 30 percent of U.S. incarceration by PPI’s count. People in jails are typically held for shorter periods of time, either while awaiting trial or for less serious crimes. But these jails will also come into play as states consider reducing mass incarceration. Many put behind bars for marijuana possession, for example, end up in local jails. And Alabama earned the distinction last year of detaining the only U.S. journalist incarcerated for doing his job in a county jail.
Pete Brook wrote a great piece on his Prison Photography blog that summed up his excitement for the reports and Prison Policy Initiative’s entitled “Every Graph, Stat and Data Point You Need For Research on U.S. Mass Incarceration,” writing,
Not content with *only* filing lawsuits, pressing states to move away from Prison Based Election Gerrymandering; battling corrupt and expensive jail phone systems; and protecting prisoners’ rights to communicate unhindered by letter, PPI is committed to providing fellow prison reformers with accurate up-to-date data on mass incarceration. We cannot rely on the government to provide recent data.
PPI has used data from the more recent 2010 U.S. Census counts to measure each state’s incarceration rates by race and ethnicity. Most (57%) people incarcerated in the United States have been convicted of violating state law and are imprisoned in a state prison. Monitoring trends at the state-level is imperative.
It’s exciting to see what discussions are beginning around the state profiles on incarceration, and how people and organizations are grappling with its’ implications. We are just beginning to see how and what these profiles can be used for to improve the current standards for mass incarceration.
Sophia Robohn is supported by the Civil Liberties and Public Policy Program.
by Leah Sakala,
June 13, 2014
The Huffington Post just published my new article, The Father’s Day Profiteers That Put Hallmark to Shame. Here’s how it starts:
This Sunday, more than a million families will face a huge Father’s Day problem, and it’s not figuring out which tie pattern dad would like best. It’s the astronomical cost of wishing him a Happy Father’s Day over the phone if he happens to be one of the 1.2 million parents in prison or jail. That’s because the prison telephone industry wants to charge families as much as $1/minute just to tell incarcerated loved ones that they are loved and missed.
The article includes some heart-breaking first-hand testimonies from the tens of thousands of petition messages that we collected with SumOfUs calling for Federal Communication Commission (FCC) regulation:
- “…because I’m a single mom now, I can’t afford to indulge [my daughter] so she can talk to the only man she’s ever called Daddy. That is wrong.”
- “My little boy turned one today and it cost $12 for his dad to be able to sing him happy birthday. It’s not right that prison phone calls are so overpriced.”
- “While [my son’s] dad tries to write letters & cards, talking on the phone is a much more accessible way to connect with and develop a semblance of a relationship with a small child. My son rarely gets to talk to his dad anymore…”
- “My son’s father has been in prison for most of my son’s life. My son has only spoken to his father once in the last 10 years. My son is 14 now. If it were more affordable to speak to his father, perhaps my son would feel like he has some sort of connection with his father.”
- “My dad was in jail when I was a child and at this price there is no way my mom would have been able to afford to let me talk to him. Without my dad I would not be who I am today.”
Alongside these families that have been calling for prison phone justice for more than a decade, here at Prison Policy Initiative we’ll keep fighting to ensure that families can afford to stay connected on Father’s Day and every day.