Appendix: Discretionary Parole Grant Rates by state, 2019-2022
The Prison Policy Initiative collected these numbers from a mixture of publicly available information and open records requests for our briefing on parole grant rates. Where possible, we have linked the publicly available data. We calculated parole grant rates by looking at the total number of hearings where parole was a possible, but not a mandated, outcome, and then looking at the number of those hearings that resulted in approval. In many states, there are also various kinds of “nondecisions” which postpone someone’s consideration for parole. In effect, these nondecisions prolong someone’s time in custody, just like a denial would. In some states, the official published calculations of their “grant rate” look only at hearings that were “granted” or “denied,” ignoring the sometimes large number of hearings where release was possible, but the board did not make any decision, even though it had the power to. Where possible, we do include those nondecisions in our calculations. Because of this difference in definition, the grant rates reported here may be lower than the “grant rates” reported in some official state reports.
Note about California: Because California does not have a true discretionary parole system (i.e. it offers parole only to certain "exceptional" categories of people), we did not include it in this briefing. However, in December 2023, upon request, we published a briefing examining California's use of discretionary parole for certain people.
| Number of Parole Board Decisions | Decisions Where Parole was Granted | Parole Grant Rate | |||||||||||||||||
|---|---|---|---|---|---|---|---|---|---|---|---|---|---|---|---|---|---|---|---|
| State (with link to available data) | 2019 | 2020 | 2021 | 2022 | 2019 | 2020 | 2021 | 2022 | 2019 | 2020 | 2021 | 2022 | % change in approval rate, 2019-2022 | % change in people released, 2019-2022 | Notes | ||||
| Alabama | 4,446 | 2,708 | 4,232 | 4,002 | 1,368 | 548 | 648 | 409 | 31% | 20% | 15% | 10% | -67% | -70% | |||||
| Alaska | 753 | 369 | 204 | 185 | 215 | 60 | 37 | 46 | 29% | 16% | 18% | 25% | -13% | -79% | |||||
| Arkansas | 6,948 | 6,962 | 6,512 | 7,095 | N/A | N/A | N/A | N/A | N/A | N/A | N/A | N/A | N/A | N/A | Data for 2020-2022 not publicly available; Arkansas does not grant open records requests from out-of-state requestors. | ||||
| Colorado | 19,681 | 19,240 | 16,342 | 12,427 | 6,609 | 7,404 | 5,074 | 4,059 | 34% | 38% | 31% | 33% | -3% | -39% | |||||
| Connecticut | 1,703 | 1,426 | 1,051 | 827 | 848 | 861 | 672 | 531 | 50% | 60% | 64% | 64% | 29% | -37% | |||||
| Georgia | 24,738 | 21,790 | 16,255 | 13,967 | 9,455 | 10,429 | 8,634 | 6,245 | 38% | 48% | 53% | 45% | 17% | -34% | |||||
| Hawaii | 2,923 | 2,582 | 2,431 | 1,861 | 768 | 803 | 900 | 528 | 26% | 31% | 37% | 28% | 8% | -31% | Numbers are for fiscal, rather than calendar, years. | ||||
| Idaho | N/A | 2,868 | 3,252 | 2,976 | N/A | 1,797 | 1,742 | 1,740 | N/A | 63% | 54% | 58% | N/A | N/A | This encompasses both hearing officer reviews and parole board hearings. The Idaho Parole board had no record of data from 2019. | ||||
| Iowa | 13,385 | 14,500 | 11,254 | 11,228 | 4,527 | 4,725 | 2,646 | 2,658 | 34% | 33% | 24% | 24% | -30% | -41% | 2019 data can be found here. | ||||
| Kentucky | 20,781 | 13,287 | 11,667 | 12,951 | N/A | 5,192 | 4,536 | 4,454 | N/A | 39% | 39% | 34% | N/A | N/A | 2020-2022 data is publicly available; in response to a request for 2019 data, the Kentucky Parole Board claimed to have no records responsive to our request. | ||||
| Louisiana | 2,071 | 1,390 | 1,331 | 995 | 1,157 | 675 | 641 | 471 | 56% | 49% | 48% | 47% | -15% | -59% | |||||
| Maryland | 8,119 | 5,698 | 5,369 | 5,922 | 2,849 | 1,269 | 1,284 | 959 | 35% | 22% | 24% | 16% | -54% | -66% | Numbers are for fiscal, rather than calendar, years. | ||||
| Massachusetts | 4,294 | 3,625 | 2,578 | 2,279 | 2,764 | 2,007 | 1,585 | 1,583 | 64% | 55% | 61% | 69% | 8% | -43% | As mentioned in the methodology statement above, Massachusetts is a state that does not include nondecisions in the denominator of its grant rate calculation. However, Massachusetts’ reports also do not differentiate between nondecisions in discretionary parole hearings and nondecisions in revocation hearings, making it impossible for us to include nondecisions in our denominator (as we did for other states) without including many hearings that were not discretionary parole hearings at all. For this reason, we did not include nondecisions in these numbers. These grant rate numbers include only hearings where the result was “granted” or “denied” – likely inflating Massachusetts’ apparent parole grant rate in comparison to other states. | ||||
| Michigan | 18,023 | 16,899 | 13,316 | 14,131 | 8,999 | 8,642 | 5,826 | 5,994 | 50% | 51% | 44% | 42% | -15% | -33% | Data is recorded in 12-month periods beginning in Dec and ending in November, (Dec 18-Nov 19, Dec. 19- Nov. 20, Dec. 20-Nov. 21, and Dec. 21-Nov.22) | ||||
| Mississippi | N/A | N/A | N/A | N/A | N/A | N/A | N/A | N/A | 74% | 70% | 69% | 43% | -42% | N/A | In response to our records request, the Mississippi Parole Board wrote that “2019-2021 data not available. 2022 data exists only in rough draft in the form of hand written decisions on hearing agendas. Instead, we take grant rate percentages from the Corrections and Criminal Task Force Oversight Final Report and PEER Mississippi’s A Review of the Mississippi State Parole Board | ||||
| Missouri | N/A | N/A | N/A | N/A | N/A | N/A | N/A | N/A | N/A | N/A | N/A | N/A | N/A | N/A | The Missouri Parole board claimed to have no responsive records to our records request. | ||||
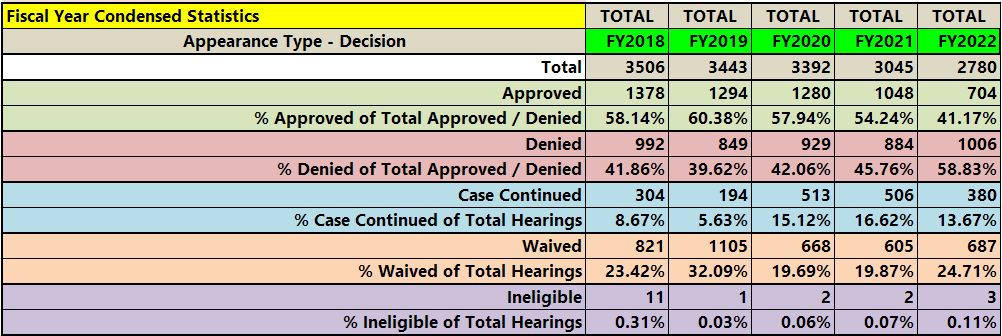
| Montana | 3,443 | 3,392 | 3,045 | 2,780 | 1,294 | 1,280 | 1,048 | 704 | 38% | 38% | 34% | 25% | -33% | -46% | |||||
| Nebraska | N/A | N/A | N/A | N/A | N/A | N/A | N/A | N/A | N/A | N/A | N/A | N/A | N/A | N/A | We have received a reply to our records request and are awaiting data. | ||||
| Nevada | 5,063 | 4,131 | 4,067 | 3,350 | 3,182 | 2,846 | 2,552 | 2,117 | 63% | 69% | 63% | 63% | 1% | -33% | Numbers are for fiscal, rather than calendar years. | ||||
| New Hampshire | N/A | N/A | N/A | N/A | N/A | N/A | N/A | N/A | N/A | N/A | N/A | N/A | N/A | N/A | In response to our records request, the New Hampshire Parole Board informed us that Parole Board records are exempt from disclosure under NH RSA 90-A:5. | ||||
| New Jersey | 5,403 | 5,274 | 3,401 | 2,373 | 2,565 | 2,897 | 1,719 | 1,121 | 47% | 55% | 51% | 47% | 0% | -56% | Includes parole board decisions made by two-person and full board. NJ implemented Administrative Parole Release (APR) a form of non-discretionary parole. In 2022 the year Earn Your Way Out Act was implemented, NJ granted APR to 747 people 2022, leaving the board to make decisions in 2373 discretionary cases, down from 3401 discretionary parole decisions the year before. | ||||
| New York | 9,050 | 6,841 | 5,772 | 5,755 | 3,419 | 2,588 | 1,934 | 1,833 | 38% | 38% | 34% | 32% | -16% | -46% | In counting hearings where parole was possible, we counted initial, shock, medical, and early release to deportation hearings. We did not include merit time, supplemental merit time, limited credit time allowance, or parole violation hearings. Data for 2019-2021 is available here. | ||||
| North Dakota | 1,368 | 1,259 | 878 | 1,059 | 1,100 | 1,011 | 681 | 822 | 80% | 80% | 78% | 78% | -3% | -25% | This data was in response to an open records request; partial data for 2022 and 2023 is available on the Parole Board’s website. For 2021-2022 data, search “Parole Board Results [Year]” | ||||
| Oklahoma | 3,314 | 4,125 | 4,488 | 4,463 | 1,407 | 1,008 | 1,254 | 1,033 | 42% | 24% | 28% | 23% | -45% | -27% | 2019 data can be found here. For 2020-2022, parole docket results are reported monthly on the Oklahoma government website. To find results for a certain month, go to Ok.gov and search "parole docket "[month year]"". | ||||
| Pennsylvania | 18,209 | 16,599 | 12,485 | 12,008 | 10,884 | 9,244 | 6,946 | 5,860 | 60% | 56% | 56% | 49% | -18% | -46% | |||||
| Rhode Island | 663 | 781 | 613 | 564 | 274 | 289 | 251 | 171 | 41% | 37% | 41% | 30% | -27% | -38% | |||||
| South Carolina | 3,051 | 2,831 | 3,318 | 2,608 | 1,089 | 961 | 832 | 343 | 36% | 34% | 25% | 13% | -63% | -69% | Data for 2022, 2021, 2020, and 2019. | ||||
| South Dakota | 1,653 | 1,631 | 1,275 | 1,678 | 769 | 849 | 612 | 831 | 47% | 52% | 48% | 50% | 6% | 8% | |||||
| Tennessee | 14,344 | 13,787 | 11,934 | 11,441 | 4,984 | 4,742 | 3,872 | 3,150 | 35% | 34% | 32% | 28% | -21% | -37% | |||||
| Texas | 78,346 | 77,530 | 65,488 | 62,579 | 27,855 | 29,919 | 25,190 | 24,604 | 36% | 39% | 38% | 39% | 11% | -12% | |||||
| Utah | 437 | 270 | 291 | 329 | 280 | 213 | 187 | 195 | 64% | 79% | 64% | 59% | -7% | -30% | In counting hearings where parole was possible, we included original hearings, rehearings, and reviews. It is important to note that the Utah parole board sometimes grants parole with years of delay between the hearing and the release. These long parole dates are recorded as grants, but in practice, still lead to substantially more incarceration after the hearing. | ||||
| Vermont | 656 | 553 | 428 | 351 | 424 | 384 | 286 | 217 | 65% | 69% | 67% | 62% | -4% | -49% | |||||
| West Virginia | N/A | N/A | N/A | N/A | N/A | N/A | N/A | N/A | N/A | N/A | N/A | N/A | N/A | N/A | West Virginia requested a 30-day extension on September 6th, 2023 in order to fulfill our records request. We are awaiting data. | ||||
| Wyoming | 1,033 | 1,004 | 765 | 829 | 812 | 829 | 563 | 649 | 79% | 83% | 74% | 78% | 0% | -20% | 2022 data publicly available; 2019-2021 data obtained via records request. | ||||
Recommended Reading:

The unmet health needs of people in prison
States fall far short of their duty to meet the health needs of incarcerated people.

All profit, no risk
The bail industry exploits cracks and loopholes in the legal system to avoid accountability, while growing its profits.

Compare your state's use of the prison to the world at large
Criminal justice policy in every region of the United States is out of step with the rest of the world.

Prison Gerrymandering Project
We are leading the movement to protect our democracy from the Census Bureau's prison miscount.