HELP US END MASS INCARCERATION
The Prison Policy Initiative uses research, advocacy, and organizing to dismantle mass incarceration. We’ve been in this movement for 23 years, thanks to individual donors like you.
Can you help us sustain this work?
Thank you,
Peter Wagner, Executive Director Donate
Can you help us sustain this work?
Thank you,
Peter Wagner, Executive Director Donate

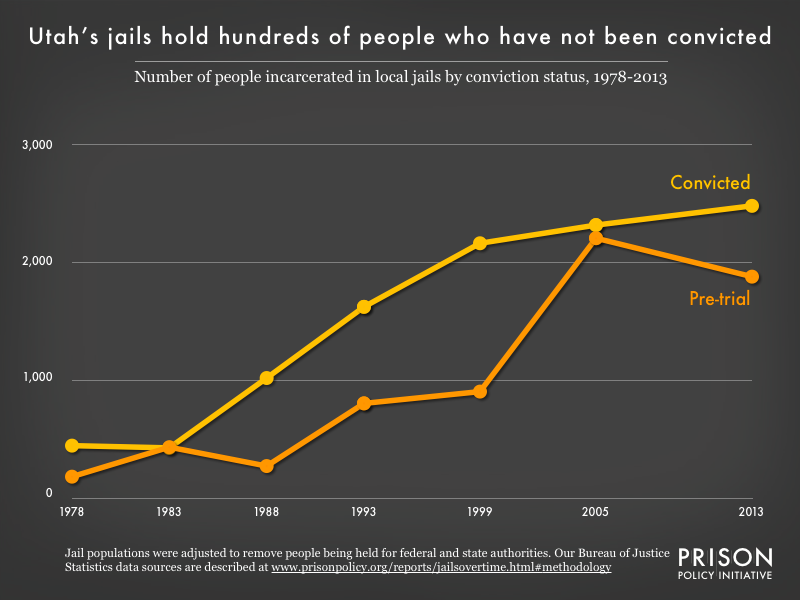
(Graph: Joshua Aiken, May 2017)
This graph excludes people held for state or federal authorities from the total count of people held in Utah jails. Because a significant proportion (30%) of the population in Utah's jails is held for the other authorities, this graph likely overstates the convicted population and understates the pre-trial population. (See our methodology.)
 This graph is a part of the Prison Policy Initiative report, Era of Mass Expansion: Why State Officials Should Fight Jail Growth.


