On Sunday, Last Week Tonight’s John Oliver tackled another pressing criminal justice issue: the troubling practice of mandatory minimums. Oliver’s 15-minute segment reveals that incarcerated people and their families aren’t alone in their fight against mandatory minimums. Even the policymakers who first created these sentences and the judges who have to hand them down think that such harsh penalties are ineffective.
Occasional pardons may bring relief to some, but without a system-wide, retroactive change to sentencing laws, mandatory minimums will continue to do “way more harm than good.”
Massachusetts might be poised to join the ranks of states that have struck down one of the most puzzling collateral consequences of a prior drug conviction: an automatic driver’s license suspension.
Let me explain. For more than two decades Massachusetts law has required the automatic suspension of the driver’s licenses of everyone convicted of a drug offense — regardless of whether or not that offense involved driving or road safety. Then, if that wasn’t enough, this policy makes them wait at least six months and then charges them $500 to get their driving privileges back, a fee that many cannot afford.
As our research found, this license suspension policy makes our roads less safe, wastes taxpayer resources, and further destabilizes the lives of individuals with prior involvement in the criminal justice system.
Fortunately, the Massachusetts Legislature is currently considering a bill sponsored by Senator Harriette Chandler and Representative Liz Malia to end the automatic license suspension policy. We presented on the issue at a legislative briefing session earlier this year, and most recently submitted supportive written testimony when H.3039/S.1812 was up for a hearing before the Joint Committee on Transportation last week.
New report answers the question: to what degree do the people in prison in a given county resemble the people who live in the surrounding county?
July 15, 2015
Our newest report asks and answers the question for every county and state in the nation: to what degree do the people in prison in a given county resemble the people who live in the surrounding county?
In partnership with Daniel Kopf of our Young Professionals Network, we analyzed U.S. Census data on the race and ethnicity of people incarcerated in given counties with the corresponding data for the surrounding county.
The racial disparities underlying the United States’ record growth in imprisonment are well documented, as is the fact that the prison construction boom was disproportionately a rural prison construction boom. While these two characteristics have been studied separately, there has been, until now, no national effort to analyze each state’s decision to engage in mass incarceration through a racial geography lens.
This report fills a critical gap in understanding the mass incarceration phenomenon: it offers a way to quantify the degree to which, in each state, mass incarceration is about sending Blacks and Latinos to communities with very different racial/ethnic make-ups than their own.
Our findings include:
Entirely separate from the more commonly discussed problem of racial disparities in who goes to prison, this data addresses a distressing racial and ethnic disparity in where prisons have been built.
Stark racial and ethnic disparities exist between incarcerated people and the people in the county outside the prison’s walls.
The transfer of Black and Latino incarcerated people to communities very different than their own is a national problem not confined to select states.
Hundreds of counties have a 10-to-1 “ratio of over-representation” between incarcerated Blacks and Blacks in the surrounding county — meaning that the portion of the prison that is Black is at least 10 times larger than the portion of the surrounding county that is Black.
We anticipate this analysis will be most useful to address two questions:
To what degree does prison gerrymandering — the practice of using U.S. Census counts of incarcerated people as residents of the prison location for legislative districting purposes — have a racial character in particular states?
The reports contains:
Graphs and maps showing the frequency of racial/ethnic overrepresentation.
Interactive tables and graphics to allow further data exploration and use of the data in new ways.
Summaries of how the racial and geographic disparities stack up by state.
The Attica prison rebellion resulted from a racial/ethnic disparity between the incarcerated and the staff. Decades later, that disparity still hasn't changed.
A driving force behind what New York State called “the bloodiest one-day encounter between Americans since the Civil War” was a shocking racial and ethnic disparity between the incarcerated and the staff at Attica Correctional Facility. But 44 years later, that disparity doesn’t look much different. Not only is this problem not unique to 1971–it’s not unique to Attica or to New York State. Stark racial and ethnic differences between incarcerated people and staff members continue to persist in Attica, New York State, and across the national prison landscape.
The Attica prison rebellion of 1971
On September 9, 1971, a four-day prison rebellion began at the Attica Correctional Facility in New York State. Upset with their difficult living conditions, a group of incarcerated men took control of the prison. Their demands included some common sense changes, like a healthier diet, less mail censorship, and better educational and rehabilitative opportunities. When negotiations failed, Governor Rockefeller ordered the state police to take the facility back while the media watched on. In the assault, 38 people — 29 incarcerated men and 9 hostages — were killed instantly.
In the following years, New York improved the food, mail policies, and rehabilitative programs, but one grievance proved more difficult to fix — the racial and ethnic disparities between the incarcerated and the staff at Attica.
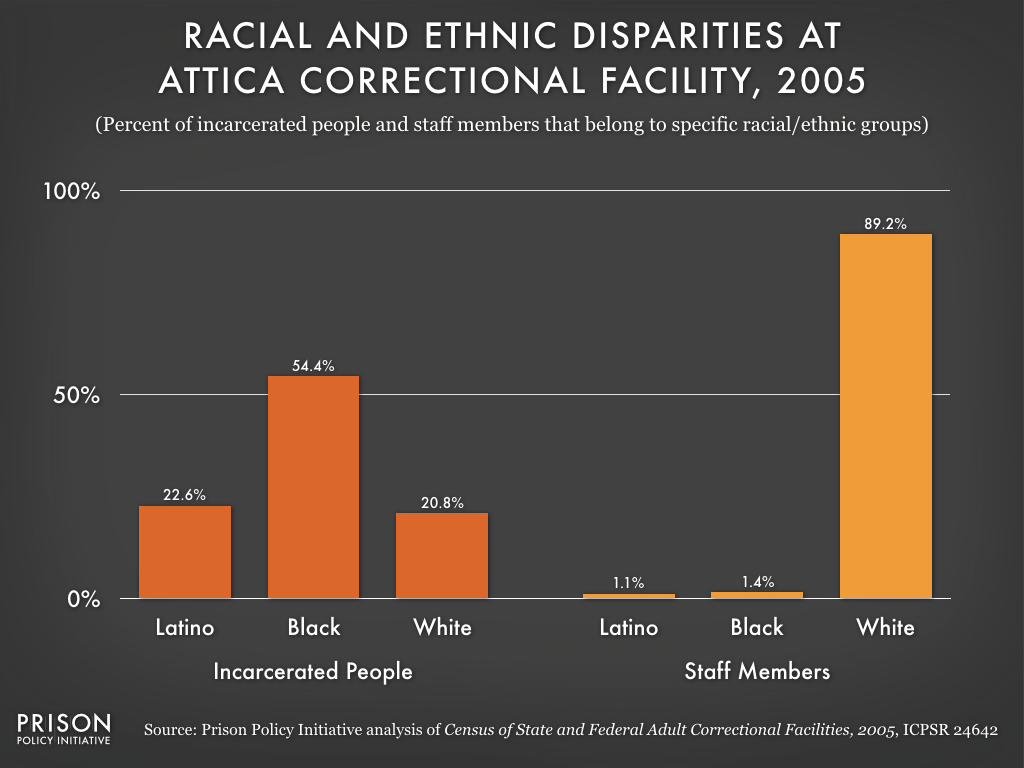
Disparities at Attica
In 1971, 63% of the incarcerated population at Attica was either Black or Latino, but zero Blacks and only one Latino served as prison guards. The graph below shows that little changed in the years that followed:
Decades after the rebellion and massacre at Attica, the numbers of Latino and Black staff members were still very small relative to the numbers of incarcerated Latinos and Blacks. By 2005 (the latest year with complete comparable data), the number of Latinos working at Attica had increased to only 9 employees, or 1% of the facility’s workforce, despite Latinos making up almost 23% the incarcerated population. Similarly, Blacks held only 1.4% of Attica’s staff positions but represented over half (54%) of the incarcerated population.
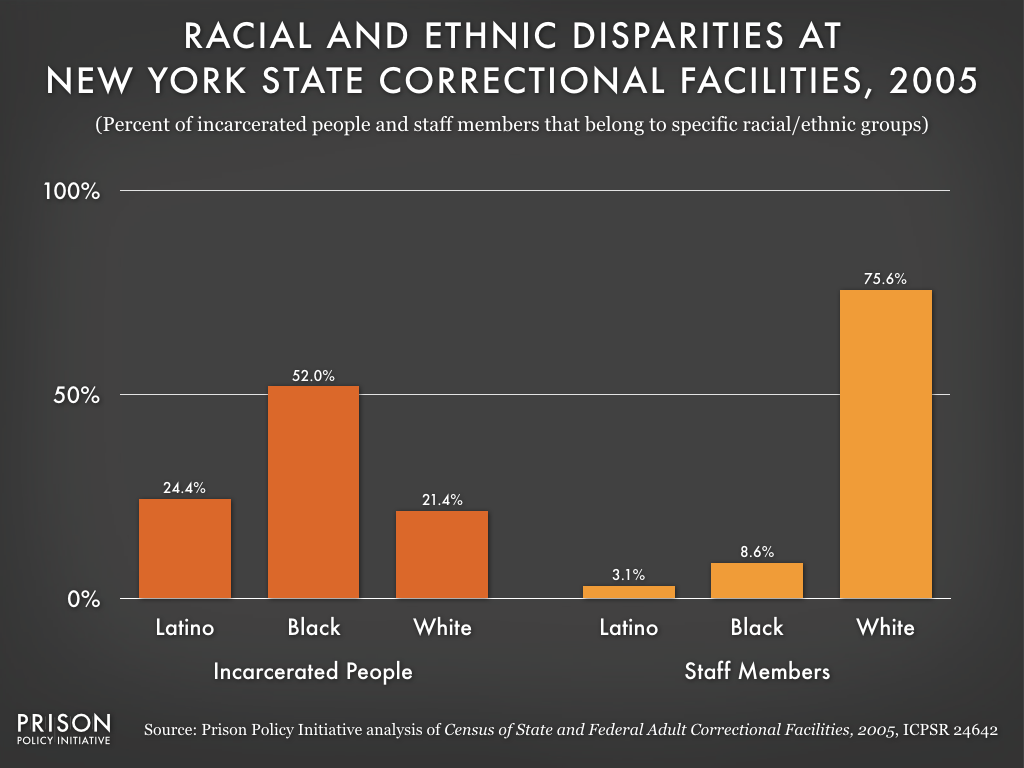
Disparities in New York
The pattern at Attica is echoed at facilities across New York State and illustrated in the graph below:
In 2005, Latinos held 3% of staff positions but represented about 24% of New York State’s incarcerated population. The difference was even more pronounced for Blacks, who held less than 9% of staff positions but represented almost 52% of the incarcerated population. Together, Latinos and Blacks held less than 12% of staff positions but made up over 76% of the incarcerated population.
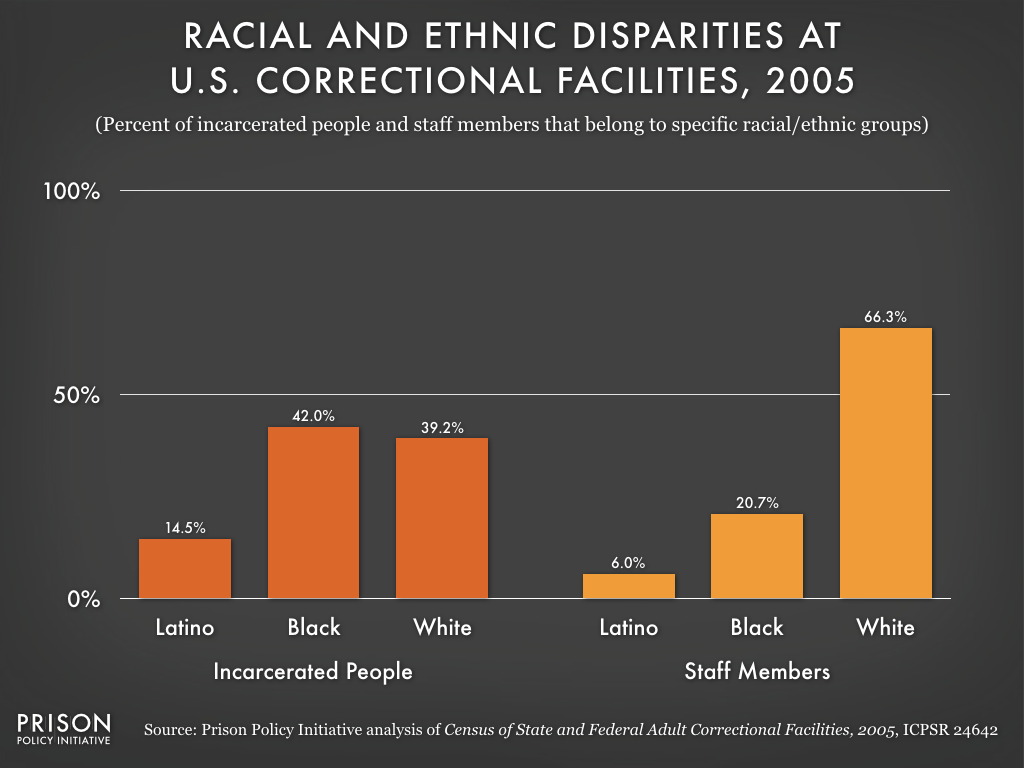
Disparities across the U.S.
New York is not unique in having large racial and ethnic disparities between its incarcerated population and its prison staff members. The graph below shows that this is a national problem:
In 2005, Latinos and Blacks made up over half of the total incarcerated population, but they only held about a quarter of the correctional staff positions. Nationwide, incarcerated Blacks and Latinos are disproportionately overseen by white correctional employees.
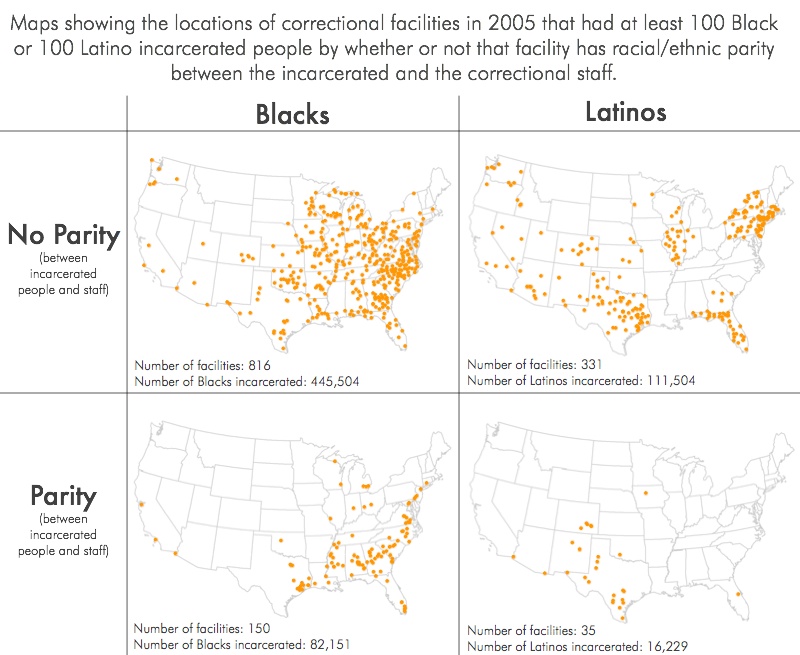
Attica is an extreme case in what is clearly a national problem. Some facilities, however, do have racial or ethnic parity between incarcerated people and correctional staff, and there is a distinct pattern in where such facilities are located. We mapped the facilities that do and do not have racial or ethnic parity (ignoring any facilities that had less than 100 incarcerated Blacks or Latinos):
The maps show that most correctional facilities with more than 100 incarcerated Blacks or Latinos are located in places where hiring Black and Latino staff in proportional numbers to the incarcerated population is extremely difficult. The small number of facilities that have such parity are, unsurprisingly, located in parts of the country with large populations of Black or Latino residents.
(Not shown are 670 facilities that incarcerated less than 100 Blacks and 1,089 facilities that incarcerated less than 100 Latinos. Also excluded from our analysis were 141 facilities that did not report how many Blacks were incarcerated and 324 facilities that did not report how many Latinos were incarcerated.)
Why hasn’t this problem been fixed already?
The lack of progress at Attica since the 1971 rebellion isn’t hard to understand. Incarcerated men there wanted the racial and ethnic makeup of prison staff to change, but the location of the prison could not. Attica remained in a rural, overwhelmingly white part of New York State, while the Latinos and Blacks whom administrators needed to recruit lived in other parts of the state.
Researchers and government officials have known about this problem for more than 40 years. In 1971, the Department of Justice formed a Task Force on Corrections to outline the government’s national criminal justice standards and goals for the first time. After two years of researching and visiting correctional facilities, task force members found that:
“Location has a strong influence on an institution’s total operation. Most locations are chosen for reasons bearing no relationship to rationality or planning. Results of poor site selection include inaccessibility, staffing difficulty, and lack of community orientation.”
In its report, the task force went on to explicitly describe the disadvantages of building new prisons in rural areas. The authors found that rural facilities lead to
“…the consignment of corrections to the status of a divided house dominated by rural white guards and administrators unable to understand or communicate with black, Chicano, Puerto Rican, and other urban minority inmates.”
One member of the task force, leading scholar William Nagel, wrote his own book about the discoveries he made while working on the Department of Justice report. He noted that, by the late 1960s, government leaders were aware that isolating incarcerated people from the rest of society failed to prepare them for life after prison. For example, in 1967, President Lyndon B. Johnson tasked the Commission on Law Enforcement and the Administration of Justice with developing practices that would better reintegrate incarcerated people into their communities.
Nagel therefore expected that he would find evidence that the government was already addressing these problems by building new prisons in populous cities, not isolated rural towns. But he quickly realized that this was not the case. Nagel and his research team found that all new correctional facilities, except for jails in county seats and small special purpose facilities, were being built in rural areas.
And, sadly, things were about to get much worse. After Nagel and his task force published their findings, the prison boom — which was largely a rural prison boom — began in earnest. As researcher Tracy Huling and U.S. Department of Agriculture demographer Calvin Beale noted, a prison opened in a rural town every 15 days throughout the 1990s.
Decades after the Attica rebellion, this country is beginning to grapple with the questions of how, what kind — and how many — prisons it should have. Underlying this discussion should be one basic fact: location matters.
Methodology note:
By “white” this article relies on the Bureau of Justice Statistics numbers for “White, not of Hispanic origin”, and for Blacks, the figure for “Black or African-American, not of Hispanic origin”.
Footnotes
1. United States Department of Justice. Office of Justice Programs. Bureau of Justice Statistics. Census of State and Federal Adult Correctional Facilities, 2005. ICPSR24642-v2.
2. For this article, we define “employees” as full-time and part-time correctional employees.
3. U.S. Department of Justice, Task Force on Corrections of the National Advisory Commission on Criminal Justice Standards and Goals of the Law Enforcement Assistance Administration, Report on Corrections (Washington, D.C.: United States Government Printing Office, 1973), 354.
4. Ibid.
5. William Nagel, The New Red Barn: A Critical Look at the Modern American Prison (New York: The American Foundation, Inc., 1973), 46.
6. Tracy Huling, “Building a Prison Economy in Rural America,” in Invisible Punishment: The Collateral Consequences of Mass Imprisonment, ed. Marc Mauer and Meda Chesney-Lind (New York: The New Press, 2002).
Incarcerated people are disproportionately shut out of the economy even before they are locked up
July 9, 2015
FOR IMMEDIATE RELEASE: July 9, 2015
Contact:
Bernadette Rabuy
(413) 527-0845
Easthampton, MA — Incarcerated people are disproportionately shut out of the economy even before they are locked up, demonstrates a new report by the non-profit Prison Policy Initiative.
“I was shocked to discover late last year that the most commonly cited source for the fact that incarcerated people are poor was decades old,” said Bernadette Rabuy, who recently published a report about the exploitative video visitation industry that works to supplant traditional in-person family visits in jails with expensive $1/minute video chats.
“All too often in criminal justice, the data we need doesn’t exist, but here the data was hiding in plain sight. The federal government collects the pre-incarceration incomes of incarcerated people in a periodic survey, but this data wasn’t being used,” said Rabuy who partnered with data scientist Daniel Kopf to decode the data and put it into context.
The report includes the pre-incarceration incomes of incarcerated people by race, ethnicity, and gender and provides comparisons to the incomes of similarly aged non-incarcerated people. The report updates the most commonly used numbers for the incomes of incarcerated people and for the first time provides national data on the pre-incarceration incomes of incarcerated women.
On Monday, the U.S. Supreme Court narrowly upheld the constitutionality of a drug used to carry out executions, but one of the dissenting judges raised a more fundamental question: Is the death penalty itself constitutional? In his dissent to the Glossip v. Gross decision, Justice Stephen Breyer fiercely argued that, by today’s societal standards, capital punishment is both cruel and unusual.
To prove the cruelty of capital punishment, Justice Breyer reviewed three key points. First, death sentences lack reliability because they are frequently (and erroneously) given to two types of people: those who are innocent and those whose convictions must be thrown out due to constitutional errors in their trials. Shockingly, courts and state governors are 130 times more likely to exonerate a defendant when a death sentence is imposed than when one is not. Second, capital punishments are arbitrary. Judge Breyer summarized the evidence showing that race, gender, and geography are often more influential than the severity of a crime in determining if people will be sentenced to death. Third, the long delays necessitated by due process both harm defendants and undermine any deterrent or retributive effects of the death sentence.
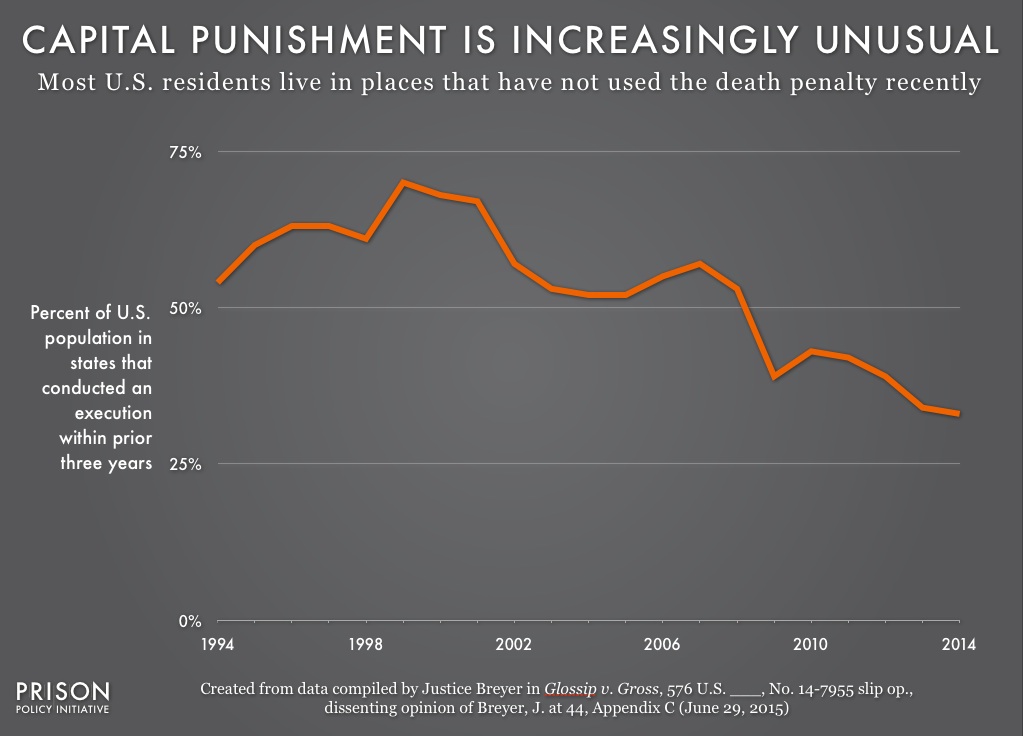
To me, the most intriguing part of Justice Breyer’s dissent was his argument that capital punishment is unusual. He presented data to show that the death penalty has fallen out of favor nationwide. For example, the number of death sentences imposed and the number executions conducted have sharply declined in the last 15 years. (See Appendices A and B in the dissent for the graphs that correspond with these facts). Justice Breyer then makes a powerful point about how rare the death penalty has become by calculating the percent of U.S. residents who live in states that have recently conducted an execution. His findings are striking, so we used the data he provided to illustrate his argument with this graph:
The death penalty is on its way out. The portion of the country that lives in a state where the death penalty was recently used has been in consistent decline for 15 years. In 1999, 70% of the U.S. population lived in a state that used the death penalty within the last three years, but by 2014, only 33% of the U.S. population lived in such a state.
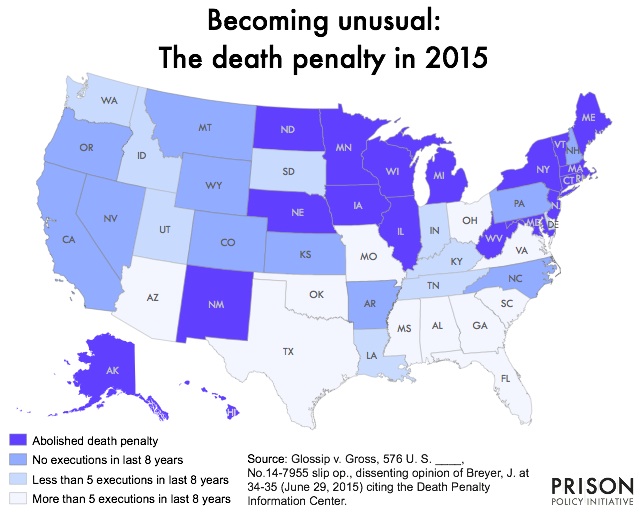
To be sure, public opinion polls show consistent theoretical support for the death penalty, but the reality is that capital punishment is rarely used. Today, 19 states (and the District of Columbia) have formally abolished the death penalty, but the map below shows that a death sentence can hardly be considered “usual” punishment in the remaining 31 states:
In the 31 states that do not legally forbid the death penalty, more than a third have not actually conducted an execution since 2007. (Therefore, in total, 30 states have eliminated the death penalty either through legislative action or by common practice.) Another nine states have conducted fewer than five executions since 2007. That leaves only 11 states where the death penalty cannot be deemed “unusual.”
Even in the 11 states where the death penalty isn’t “unusual,” three states conduct an overwhelming majority of the total executions. In 2014, 80% of all U.S. executions took place in Texas, Missouri, and Florida, where less than 17% of the U.S. population lived. That leaves 83% of the U.S. population living in places where the death penalty is unusual either by law or by practice.
The Supreme Court’s decision shines a spotlight on a decades-old debate that tends to focus primarily on the cruelty of capital punishment. Justice Breyer, however, used his dissent to shift the conversation. He unequivocally showed that the Eighth Amendment’s other requirement is being violated—the death penalty is increasingly unusual, and it’s time to rethink its constitutionality.
Correction: The map originally published with this post incorrectly switched the colors for Vermont and Utah. This was corrected at noon on July 3, 2015.
Last week, Gallup released an annual survey that revealed an alarming fact: American confidence in police has reached a 22-year low. In 2015, only 52% of Americans expressed “a great deal” or “quite a lot” of confidence in the police, tying with confidence levels reported in 1993 shortly after LA police officers brutally beat Rodney King. The most troubling part of the national average, however, isn’t evident until that statistic is broken down by race. Not only are Americans in general losing confidence in the police, but Black and White Americans have shown starkly different confidence levels for decades.
The differences between Black and White Americans in police confidence can be seen in the graph below:
Each year, Gallup asks a random sample of U.S. adults the following question: “I am going to read you a list of institutions in American society. Please tell me how much confidence you, yourself, have in each one–a great deal, quite a lot, some, or very little: the police?” This graph shows the percentage of people by race who answered that they had “a great deal” or “quite a lot” of confidence in the police. Whites consistently report higher levels of confidence in the police than the average American, while Blacks report markedly lower confidence levels than the average American.
White Americans have consistently expressed more positive attitudes about police than the average resident since Gallup began this particular poll. But while Whites consistently exceed the average police confidence level, Blacks consistently fall below it. In 2015, 57% of Whites reported “a great deal” or “quite a lot” of confidence in police, but only 30% of Blacks felt the same way. The difference between the two racial groups was greatest in 2007, when 60% of Whites and only 22% of Blacks expressed high levels of confidence in police.
The steady drop in police confidence since 2012 isn’t due to an increase in criminal behavior around the country. In fact, crime has been decreasing since its peak rate in 1991, so that today, crime rates are at historic lows. The decline in confidence in police isn’t a result of feeling unsafe around potential criminals; it’s a result of feeling unsafe around the police. Many communities today are protesting against police officers’ treatment of people of color, just like residents did after the 1991 Rodney King beating. Now, new names like Eric Garner, Michael Brown, Tamir Rice, and Freddie Gray are giving rise to national debates about what constitutes best police practices.
Police departments, however, are capable of changing these attitudes. For example, the Oakland Police Department, once called “the worst department in the country,” received 40% fewer complaints against officers in 2014 than it did the year prior. The reason for this decrease may be that, upon accepting his post in 2014, OPD’s chief Sean Whent decided to prioritize building trust in the community. Chief Whent told Politico, “In a democratic society, people have a say in how they are policed, and people are saying that they are not satisfied with how things are going.” Under Chief Whent’s leadership, the officers are experimenting with body cameras and new fieldwork practices in the hope that they will build the community’s confidence in the police department.
The lesson for other police departments is clear–you can change attitudes, but it will require a major shift in both priorities and practices first.
Note: One challenge with making the graph in this article was that, starting in 2013, Gallup began reporting their annual results as two-year averages (e.g., 2012-2013 and 2014-2015). We were able to calculate the 2013 single-year data point from the known 2012 single-year data and the reported 2012-2013 average. However, because as the 2013-2014 figure could not be located, we could not duplicate this technique for later years or show that particular two-year average. Therefore, our graph jumps from 2013 to the 2014-2015 average that we placed on the midpoint between 2014 and 2015.
 The maps show that most correctional facilities with more than 100 incarcerated Blacks or Latinos are located in places where hiring Black and Latino staff in proportional numbers to the incarcerated population is extremely difficult. The small number of facilities that have such parity are, unsurprisingly, located in parts of the country with large populations of Black or Latino residents.