We are looking for our next Creator-in-Residence to produce engaging and informative social video content about the problems in the American criminal legal system.
Support us
Can you make a tax-deductible gift to support our work?
We’re excited to introduce Prison Policy Initiative Research Analyst, Leah Wang! Leah holds a M.S in Sustainability Science from the University of Massachusetts Amherst, and a B.A in Economics and Environmental Studies from Bowdoin College. Prior to joining the Prison Policy Initiative, Leah was an analyst at the Massachusetts Department of Correction, and has worked in agriculture, local food systems, and outdoor education. Leah has spent several years teaching and working with prison and jail education programs, like Petey Greene and The New Garden Society.
Most states did not prioritize incarcerated people in their vaccination plans. As a result, seven months since the first vaccines were distributed, just 55% of people in prison have been vaccinated, leaving them vulnerable to infection.
Throughout the pandemic, prisons have been a hotspot for COVID-19, with case rates in prisons betweenfour to five times higher than in the general population. Despite being disproportionately impacted by the pandemic, however, most states did not prioritize incarcerated people in their vaccination plans. As a result, seven months since the first vaccines were distributed, just 55% of people in prison have been vaccinated,1 leaving them vulnerable to infection.
Using data from the UCLA Law COVID-19 Behind Bars Data Project, The Marshall Project/AP, and other state-specific sources,2 we calculated the current rate of vaccinations among incarcerated people in 48 state prison systems and the federal Bureau of Prisons.3 For our measure of vaccination, we counted anyone who had received at least one dose of a vaccine as of May 14, 2021.4 Our findings are disheartening:
In 17 state prison systems and the Bureau of Prisons, less than half of incarcerated people have received a vaccine.
Vaccination rates are the worst in Utah, South Carolina, and Alabama where 20% or less of the prison population has received the first dose of a vaccine.
And two states – Florida and Wyoming – have not released any vaccination information at all. Their lack of transparency makes it impossible to hold these Departments of Corrections accountable and ensure they are doing all they can to limit the spread of the virus.
As we recently reported, many states prioritized correctional staff for early vaccine access, under the misguided assumption that a fully-vaccinated staff would act as a preventative “barrier” between incarcerated people and the communities surrounding prisons. With many correctional staff refusing to be vaccinated, the median staff vaccination rate across the country was still just 48% at last count. To meaningfully protect people in prison, incarcerated people need to be vaccinated at much higher rates than we’re seeing thus far.
Figure 1. Data compiled from the UCLA Law COVID-19 Behind Bars Data Project, The Marshall Project, and several state-specific data sources (see footnote 1). See the appendix to this article for a table with details about all 48 prison systems for which we gathered data.
Only ten states have vaccinated more than 70% of people incarcerated in their prison systems. Some of these states – Massachusetts, Oregon, and California – included incarcerated people in the early phases of their vaccination schedules. Had more states prioritized vaccinating people in prisons, vaccination rates would be higher across the board.
Vaccinating incarcerated people may be one of the only fast and effective mitigation strategies available to prevent the spread of the virus and save lives: The inability to socially distance in prisons combined with the higher rates of chronic health issues among incarcerated people has led to prison mortality rates two to three times higher than that of the general population.
Since vaccinations started in the U.S., there have been too many avoidable deaths. In Nevada, for example, one-third of COVID deaths in prisons occurred this year(after vaccines became available). Similarly, New Hampshire’s first COVID prison death didn’t occur until December 30, 2020, and there have since been two more deaths in 2021. In Oklahoma, incarcerated people became eligible to receive the vaccine late last year, but vaccinations did not start until March; and since January, at least 11 people may have died from COVID-19. Although the number of new cases each day has gone down in the United States since January, incarcerated people are still unprotected and dying, even when we have effective vaccines available.
The dark history of the prison medical system could be a huge barrier to vaccine uptake in prisons. Many incarcerated people are wary of the prison medical system, and for good reason: prison medical systems have long been notorious for unethical experimentation and inadequate medical care. According to the results of a survey published by The Marshall Projectin February, more than half of incarcerated respondents did not believe the prison was acting in their best interest by making the vaccine available, and very few respondents believed medical staff would provide accurate information about the vaccine.
To address these concerns, public health experts have been clear: education is crucial to vaccine acceptance behind bars. There are educational resources designed specifically for COVID-19 vaccine education for people in prisons that can be used to address common questions and concerns. The reality is that vaccine education needs to be more than just handing out flyers and hanging up posters: to combat distrust in the prison system, prisons should bring in outside experts and trusted community members to discuss the vaccines with incarcerated people. Correctional staff – who have shown widespread reluctance to take the vaccine themselves – should not be relied up on to deliver accurate information about vaccines.
Nearly 397,000 people in prisons have tested positive for COVID-19 since March 2020, and the virus will only continue to spread without widespread vaccinations behind bars. For more than a year, incarcerated people have dealt with devastating consequences of the virus, ranging from the inability to see their loved ones, to the unnecessary use of solitary confinement, to death. Lack of visitation and the use of solitary confinement, as well as discontinued programming and limited access to health care are all incredibly dangerous, in addition to the dangers of COVID-19. States need to start investing in and accelerating vaccine education and administration for people in prisons.
Appendix
Prison System
Number of incarcerated people who have received at least one dose
Total prison population
Percentage of incarcerated people who have received at least one dose
We’ve opted to use the vaccination numbers reported by the Associated Press on 5/9/21 because the Arkansas Department of Corrections hasn’t provided The Marshall Project with updated data since 4/20/21. The article provides the number of doses and the percentage of people who have recieved the vaccine, but not the total population.
The Marshall Project/AP does not include the number of people who have received the one dose Johnson & Johnson vaccine; we’ve added these vaccinations, however, for accuracy and consistency with the UCLA data.
Vaccine data was last updated on 5/12/21. The Marshall Project/AP doesn’t include the number of people who have received the one dose Johnson & Johnson vaccine; we’ve added these vaccinations, however, for accuracy and consistency with the UCLA data.
This article from 4/12/21 reports the number of vaccines distributed and the percentage of people who have recevied the vaccine, but not the total number of incarcerated people.
The Marshall Project/AP doesn’t include the number of people who have received the one dose Johnson & Johnson vaccine; we’ve added these vaccinations, however, for accuracy and consistency with the UCLA data.
Vaccine data was last updated on 4/16/21. The Marshall Project/AP doesn’t include the number of people who have received the one dose Johnson & Johnson vaccine; we’ve added these vaccinations, however, for accuracy and consistency with the UCLA data.
It’s important to note that states do not report vaccination data consistently, so we made every effort to avoid double-counting people and overestimating vaccination rates. Specifically, we typically defined people receiving “at least one dose” of a vaccine as those who were reported as “partially” vaccinated, or having “initiated” vaccination or “received first dose.” This is because many states record vaccinated people twice – once when a two-dose vaccine schedule is started and once when it’s completed; those receiving the one-shot Johnson & Johnson vaccine may be included in both categories as well (as a “first dose” and as “completed”). In states where the available data suggested a different definition, we have noted those differences in “notes/clarifications” in the appendix table. ↩
Source notes: In addition to the data from UCLA and The Marshall Project/AP, we sought vaccination data for people in prison from state Department of Corrections websites and news articles. Our vaccination rates are calculated based on prison populations reported in The Marshall Project/AP dataset. Data from UCLA, The Marshall Project/AP, and state Department of Corrections websites were accessed on May 17, 2021. ↩
Readers who want to conduct their own analysis can access data from previous weeks and months from both UCLA and The Marshall Project/AP. ↩
For Texas and the states with vaccinations counts from UCLA’s dataset, the data are as of May 14. For most states with vaccination counts from The Marshall Project/AP dataset, the data are as of May 11. In the appendix table, we noted the date of the data for states that have vaccination counts for only earlier than May 11. ↩
The carceral environment can be inherently damaging to mental health by removing people from society and eliminating meaning and purpose from their lives. On top of that, the appalling conditions common in prisons and jails — such as overcrowding, solitary confinement, and routine exposure to violence — can have further negative effects. Researchers have even theorized that incarceration can lead to “Post-Incarceration Syndrome,” a syndrome similar to PTSD, meaning that even after serving their official sentences, many people continue to suffer the mental effects.
Incarceration itself is inherently harmful to people’s health
Many of the defining features of incarceration are linked to negative mental health outcomes, including disconnection from family, loss of autonomy, boredom and lack of purpose, and unpredictability of surroundings. Prof. Craig Haney, an expert on the psychological effects of imprisonment and prison isolation, explains, “At the very least, prison is painful, and incarcerated persons often suffer long-term consequences from having been subjected to pain, deprivation, and extremely atypical patterns and norms of living and interacting with others.” And as Dr. Seymour L. Halleck has observed, “The prison environment is almost diabolically conceived to force the offender to experience the pangs of what many psychiatrists would describe as mental illness.”
Family disconnection
By its very nature, incarceration separates people from their social networks and loved ones. In 2018, when researchers at the University of Georgia analyzed the relationship between prison conditions and mental health in 214 state prisons, they found that people incarcerated more than 50 miles from home were more likely to experience depression. This isn’t surprising: Psychologists have long known that people with social support and positive family relationships tend to have better psychological wellbeing.
Similarly, in a 2015 review of the research on the impact of prisons on mental health, separation from family and friends emerged as a major stressor for incarcerated people; it was also associated with psychological distress. In fact, many people described this separation as the most challenging aspect of their incarceration. Goomany and Dickinson, who authored the review, found that even when incarcerated people receive visits from family members, the prison environment makes it harder for them to connect. Correctional facilities are built and operate around the goal of security, and these “regulations and security measures inevitably impact on the relationships between prisoners, their families, and children.”
Separation from children can be especially distressing for incarcerated women. As one 1998 article in Behavioral Sciences & the Law noted, “Separation from children is one of the most stressful conditions of incarceration for women and is associated with feelings of guilt, anxiety, and fear of losing mother-child attachment.” A 2005 study found that “most mothers described an intense focus on feelings of distress, depression, or guilt.” One mother in that study explained her feelings: “All I’d do was cry. It is horrible being away from your kids, especially when they the only people who care for you.” Another said, “I was very hurt, depressed, crying constantly, and worried.” The study noted that 6 percent of the mothers interviewed described themselves as suicidal early in their incarceration; as their separation from their children continued, 22% “continued to focus intensely on their distress.”
Loss of autonomy & lack of purpose
Incarcerated people have virtually no control over their day-to-day lives, including when they wake up, what they eat, what their jobs are, and when they have access to recreation. This can lead to feelings of dependence and helplessness. The three main studies included in Goomany and Dickinson’s review all concluded that this loss of autonomy harms mental health. Once again, this makes sense; we know people feel better and have better mental health outcomes when they have control over their surroundings.
Similarly, incarceration is often characterized by boredom, monotony, and lack of stimulation. Many incarcerated people have limited access to education, job training, and other programming that can fill their time and become a meaningful part of their lives. In a 2003 study of incarcerated people in England, participantsreported that lack of activity and mental stimulation leads to extreme stress, anger, and frustration. Some reported using unhealthy coping mechanisms to manage boredom, including substance abuse. The 2018 University of Georgia study mentioned earlier also found that people in prisons with limited access to work assignments experienced higher levels of depression. Once again, this fits with psychological research that shows meaninglessness and a lack of purpose can lead to symptoms of anxiety, depression, and hopelessness.
Unpredictability
These feelings of anxiety and depression can be exacerbated by the unpredictable nature of the carceral environment. As the Behavioral Sciences & the Law article mentioned above explains, there are numerous rules in prisons and jails that do not exist in the free world — many of which are ambiguous and only enforced erratically. The authors note that “institutional rules are enforced selectively, depending on factors such as inmate-staff relationships, staff member’s mood, the severity of the rule violation, and the convenience of rule enforcement.” This lack of clarity and predictability can contribute to feelings of uncertainty and stress.
Cruel conditions make a negative environment worse
Even a relatively “humane” prison or jail can contribute to negative mental health outcomes for the reasons outlined above. But the reality is that poor conditions in prisons and jails cause significant additional suffering and trauma. As the World Health Organization explains, “There are factors in many prisons that have negative effects on mental health, including: overcrowding, various forms of violence, enforced solitude or conversely, lack of privacy, lack of meaningful activity, isolation from social networks, insecurity about future prospects (work, relationships, etc.), and inadequate health services, especially mental health services.” This list of mentally damaging conditions accurately describes most U.S. jails and prisons.
Overcrowding & punitiveness
Many jails and prisons throughout the country are overcrowded, which makes the inherently negative carceral environment even worse. Overcrowding often means more time in cell, less privacy, less access to mental and physical healthcare, and fewer opportunities to participate in programming and work assignments. Correctional administrators may respond to overcrowding by forgoing screening and monitoring of vulnerable people. A 2005 study found that overcrowding is highly correlated with prison suicide.
The 2018 study from the University of Georgia similarly found that overcrowding and punitiveness are correlated with depression and hostility. The researchers noted that punitive environments “likely set inmates on edge, making them overly hostile or even depressed.”
Solitary confinement
Being put in solitary confinement, which is a common practice in many prisons and jails, is especially harmful to mental health. As we discussed in a briefing last year, the stress caused by spending time in solitary confinement can lead to permanent changes to people’s brains and personalities. Depriving humans — who are naturally social beings — of the ability to interact with others can cause ‘social pain,’ which affects the brain in the same way as physical pain. A 2000 study found that people were significantly more likely to develop psychiatric disorders while in solitary confinement than while housed in non-solitary units.
Trauma from experiencing and witnessing violence
Prisons and jails are extremely violent places. People often experience traumatic verbal or physical assaults and dehumanization at the hands of correctional officers. And the various stressors in a carceral environment also increase the chances of violence between incarcerated people. Researchers in a 2009 study found that experiencing violence during incarceration was significantly related to “aggressive and antisocial behavioral tendencies as well as emotional distress.”
In fact, even witnessing violence behind bars can be traumatizing, as we have discussed previously. Exposure to violence in prisons and jails can exacerbate existing mental health disorders or even lead to the development of post-traumatic stress symptoms like anxiety, depression, avoidance, hypersensitivity, hypervigilance, suicidality, flashbacks, and difficulty with emotional regulation.
Lasting effects
Some researchers suggest that the trauma people experience behind bars can lead to Post-Incarceration Syndrome, a syndrome that shares characteristics with PTSD. A 2013 study of 25 released lifers found that participants experienced a specific cluster of mental health symptoms, including institutionalized personality traits (like distrusting others, difficulty maintaining relationships, and problems making decisions), social-sensory disorientation (issues with spatial reasoning and difficulty with social interactions), and social and temporal alienation (the feeling of not belonging in social settings).
Similarly, a 2019 literature review found that incarcerated people experience high rates of Potentially Traumatic Events, often shortened to PTEs. The review further revealed that experiencing PTEs behind bars was strongly correlated with rates of PTSD upon release.
We often think of incarceration as something people live through and from which they can ultimately be released. But the reality is that time spent in prisons and jails can create a host of collateral consequences that haunt individuals even after release. As the research shows, incarceration can trigger and worsen symptoms of mental illness — and those effects can last long after someone leaves the prison gates.
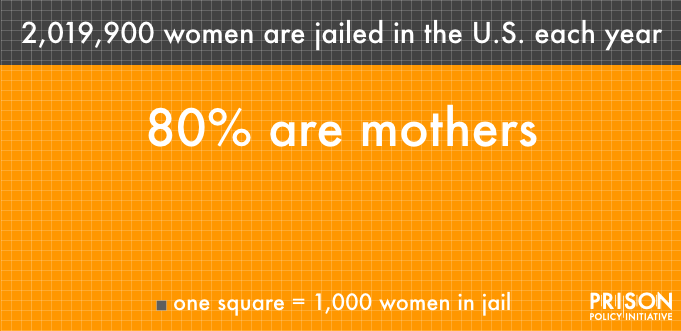
This Mother’s Day — as the COVID-19 pandemic continues to put people behind bars at serious risk — nearly 150,000 incarcerated mothers will spend the day apart from their children.1Over half (58%) of all women in U.S. prisons are mothers, as are 80% of women in jails, including many who are incarcerated awaiting trial simply because they can’t afford bail.
Most of these women are incarcerated for non-violent offenses. Most are also the primary caretakers of their children, meaning that punishing them with incarceration tears their children away from a vital source of support. And these numbers don’t cover the many women who will become mothers while locked up this year: An estimated 58,000 people every year are pregnant when they enter local jails or prisons.2
Most incarcerated mothers are locked up in local jails
Women incarcerated in the U.S. are disproportionately in jails rather than prisons. As we’ve written before, even a short jail stay can be devastating, especially when it separates a mother from children who depend on her.
80% of the women who will go to jail this year are mothers — including 55,000 women who are pregnant when they are admitted. Beyond having to leave their children in someone else’s care, these women will be impacted by the brutal side effects of going to jail: Aggravation of mental health problems, a greater risk of suicide, and a much higher likelihood of ending up homeless or deprived of essential financial benefits.
How incarceration — and life after incarceration — hurts mothers and their children
Women who are pregnant when they are locked up have to contend with a healthcare system that frequently neglects and abuses patients. In a 50-state survey of state prison systems’ healthcare policies, we found that many states fail to meet even basic standards of care for expectant mothers, like providing screening and treatment for high-risk pregnancies. In local jails, where tens of thousands of pregnant women will spend time this year, healthcare is often even worse (across the board) than in state or federal prisons.
More challenges await incarcerated mothers and pregnant women when they are released from jail or prison. Formerly incarcerated women experience extremely high rates of food insecurity, according to a 2019 study. And as we previously reported, the 1.9 million women released from prisons and jails every year have high rates of poverty, unemployment, and homelessness, confirming what many advocates already knew: that there is a shortage of agencies and organizations able and willing to help formerly incarcerated women restart their lives.
It’s time we recognized that when we put women in jail, we inflict potentially irreparable damage to their families. Most women who are incarcerated would be better served though alternatives in their communities.
So would their kids. Keeping parents out of jail and prison is critical to protect children from the known harms of parental incarceration, including:
Traumatic loss marked with feelings of social stigma and shame and trauma-related stress
More mental and physical health problems later in life
Incarceration punishes more than just individuals; entire families suffer the effects long after a sentence ends. Mother’s Day reminds us again that people behind bars are not nameless “offenders,” but beloved family members and friends whose presence — and absence — matters.
Footnotes
Based on the most recent (2016) Survey of Prison Inmates, the Bureau of Justice Statistics (BJS) estimates 57,700 women in state and federal prisons are parents of minor children. We calculated approximately 88,400 pregnant women in local jails based on the Vera Institute of Justice report’s estimate that 80% of women in jail are mothers, and the BJS reports 110,500 women in local jails at mid-year 2019 (80% of 110,500 is 88,400). While jail populations dropped quite dramatically in the early months of the COVID-19 pandemic, we opted to use the more typical 2019 jail population for our estimate because other data sources show that jail populations have largely rebounded since mid-year 2020. ↩
These estimates are based on the following percentages, reported in the linked sources: 4% of women admitted to state and federal prisons annually, and 3% of women admitted to local jails, are pregnant at the time of admission. The estimated 55,000 women admitted to jails while pregnant each year is based on the number of women over age 18 arrested in 2017 (over 1.7 million women), as reported in the original source. The estimated number of pregnant women admitted to state and federal prisons in a year is based on the total number of female admissions in 2019 (73,586) as reported by the Bureau of Justice Statistics CSAT — Prisoners tool. The one-day prevalence of pregnancy at year-end 2016 (as opposed to the share of annual admissions) was 0.6% in prisons and 3.5% in local jails. ↩
Why do some places incarcerate people at much higher rates than others? We considered this question in 2019, when we compared prison incarceration rates across U.S. counties, finding a wide range that loosely correlated to the respective state imprisonment rates. Now, we can do the same for jail incarceration rates. While it’s difficult to find jail incarceration data at the city level, this data is available by county in the Vera Institute of Justice’s Incarceration Trends Database. Using this database, we considered 63 highly populated cities,1 and calculated the overall jail incarceration rate and pretrial detention rate of each city’s surrounding county.2 We found that, like prison incarceration rates, jail detention rates vary significantly. But unlike our study of prison incarceration rates, we could find no obvious explanation: neither violent crime rates, local police budgets, nor local jail budgets explained the large differences from city to city. These variations mean that your chances of being put in jail can depend on something as arbitrary as the city you live in.
Jail and pretrial detention rates are important for showing just how deeply mass incarceration is affecting your local community. Jails are the “front door” of the criminal justice system. In 2019 alone, there were more than 10.3 million admissions into U.S. jails. Black and low-income people are disproportionately affected by repeat arrests, and are more likely to be held pretrial simply because they cannot afford bail, perpetuating the cycle of poverty and incarceration. Even short stays in jail can have a major impact on people’s livelihoods, threatening their ability to keep their jobs and housing, and straining familial relationships. This harm is unnecessary, though; as our research has shown, reforms that allow more people to return home pretrial were not associated with rising crime rates in the states, cities, and counties we analyzed.
Rates are per 100,000 county residents. In its database, the Vera Institute of Justice presents rates for counties per 100,000 residents aged 15-64. For our analysis, we recalculated the rates using the counties’ total populations, using population counts from the Vera Institute of Justice’s downloadable dataset, to make the figures comparable to other criminal justice data. The data exclude people held in jails on behalf of federal authorities, such as U.S. Immigration and Customs Enforcement and U.S. Marshals Service.
City
State
County
Jail detention rate (per 100,000 county residents)
Pretrial detention rate (per 100,000 county residents)
Memphis
Tenn.
Shelby County
491
245
New Orleans
La.
Orleans Parish
397
301
St. Louis
Mo.
None
393
395
Philadelphia
Pa.
Philadelphia County
389
257
Nashville
Tenn.
Davidson County
361
191
Baltimore
Md.
None
331
330
Virginia Beach
Va.
None
328
148
Louisville
Ky.
Jefferson County
308
171
Fresno
Calif.
Fresno County
305
221
Jacksonville
Fla.
Duval County
297
119
Denver
Colo.
Denver County
295
205
Washington, D.C.
D.C.
None
294
158
Charleston
S.C.
Charleston County
286
229
Atlanta
Ga.
Fulton County
279
198
Colorado Springs
Colo.
El Paso County
279
111
El Paso
Texas
El Paso County
277
177
Little Rock
Ark.
Pulaski County
272
203
Newark
N.J.
Essex County
262
242
Jackson
Miss.
Hinds County
259
252
Charleston
W. Va.
Kanawha County
254
193
Las Vegas
Nev.
Clark County
251
132
Indianapolis
Ind.
Marion County
249
189
Birmingham
Ala.
Jefferson County
249
179
Tulsa
Okla.
Tulsa County
248
172
Billings
Mont.
Yellowstone County
246
224
Oklahoma City
Okla.
Oklahoma County
243
173
Milwaukee
Wis.
Milwaukee County
240
126
Sacramento
Calif.
Sacramento County
235
116
Boise
Idaho
Ada County
232
205
Wichita
Kan.
Sedgwick County
230
171
Omaha
Neb.
Douglas County
225
204
Cheyenne
Wyo.
Laramie County
223
201
Tampa
Fla.
Hillsborough County
211
145
Salt Lake City
Utah
Salt Lake County
208
191
Des Moines
Iowa
Polk County
206
174
Boston
Mass.
Suffolk County
201
118
Dallas
Texas
Dallas County
198
152
Austin
Texas
Travis County
195
143
San Antonio
Texas
Bexar County
195
184
Houston
Texas
Harris County
185
141
Albuquerque
N.M.
Bernalillo County
179
187
Tucson
Ariz.
Pima County
178
147
San Diego
Calif.
San Diego County
176
82
Sioux Falls
S.D.
Minnehaha County
174
174
San Jose
Calif.
Santa Clara County
172
127
Phoenix
Ariz.
Maricopa County
171
131
Los Angeles
Calif.
Los Angeles County
170
105
Columbus
Ohio
Franklin County
169
133
Fort Worth
Texas
Tarrant County
168
121
Fargo
N.D.
Cass County
154
155
Portland
Maine
Cumberland County
154
90
Miami
Fla.
Miami-Dade County
149
112
Charlotte
N.C.
Mecklenburg County
143
125
San Francisco
Calif.
San Francisco County
143
118
Kansas City
Mo.
Jackson County
140
120
Seattle
Wash.
King County
137
107
Portland
Ore.
Multnomah County
134
106
Chicago
Ill.
Cook County
126
113
Raleigh
N.C.
Wake County
111
101
Detroit
Mich.
Wayne County
107
64
Manchester
N.H.
Hillsborough County
100
53
Minneapolis
Minn.
Hennepin County
99
62
New York
N.Y.
5 NYC Counties
98
71
Varying detention rates defy any logical explanation
We found that jail incarceration and pretrial detention rates vary greatly from city to city. There are some high outliers; Memphis, Tenn., for example, has a total jail detention rate of 491 per 100,000 residents, far above the average jail detention rate across the 63 cities of 225 per 100,000. On the other end of the spectrum, cities like New York and Minneapolis jail fewer than 100 residents per 100,000. Similarly, the pretrial detention rates in St. Louis and Baltimore (395 and 330 per 100,000, respectively) are more than double the average pretrial detention rate for the cities we studied, which was 163 per 100,000. We considered various possible explanations for the drastic differences from city to city, but didn’t find many consistent trends.
Local crime rates don’t consistently explain jail detention rates
First, we used the FBI’s Universal Crime Reporting program data to analyze the cities’ violent crime and total crime rates, to see if high rates of crime correlated with high rates of detention.3 Memphis, St. Louis, and Baltimore — all of which have notably high detention or pretrial detention rates — do in fact have the three highest violent and total crime rates of the cities for which we were able to obtain data.4 This pattern isn’t consistent across other cities, though. For example, Charleston, S.C., has some of the highest jail detention and pretrial detention rates, yet its violent crime and total crime rates rank among the lowest of these cities. On the other end of the spectrum, Detroit boasts very low detention rates, but has a relatively high violent crime rate.
It’s also difficult to know how directly violent crime is actually impacting detention rates because other factors likely influence both crime and incarceration. Poverty, addiction, and a lack of social services, for example, could contribute separately to high rates of both crime and jail detention. In fact, detention itself has been shown to increase the odds of future offending, which is counterproductive from a crime rate-defined public safety standpoint.
Local police and jail budgets don’t explain jail rates, either
Next, we explored whether police budgets were correlated with jail and pretrial detention rates. Using the Vera Institute of Justice’s police budget data, we examined the percent of city funds spent on policing and the number of city dollars per resident allocated to the police. Our analysis did not reveal any noteworthy connections between these measures and local jail rates, however.
The Vera Institute of Justice also provides data on the jail budgets in major cities and the number of county dollars spent per resident specifically on jails. Again, we found no strong correlations between jail budgets and jail incarceration rates. The only notable finding is a correlation between changes in jail population and changes in jail budgets since 2011: Cities that reduced their jail budgets (or avoided large increases) also reduced their jail populations more dramatically. While this may not be particularly surprising, it does suggest that cutting jail budgets could help communities reduce the number of people cycling through jails, while freeing up money to be used elsewhere, like schools.
In many places, the effects of bail reform remain to be seen
A number of cities and states included in this analysis, such as Philadelphia and Dallas, have enacted bail reforms in the past few years. However, since most of these changes occurred after 2018 — the most recent year for which the Vera Institute of Justice’s jail detention data are available — the data we used for this analysis do not yet show the effects of those reforms. Ultimately, these reforms should result in reduced pretrial detention rates. Current data show bail reforms have an impact on overall jail detention as well, since the pretrial population makes up about two-thirds of jail populations nationwide.
In New Jersey, for example, pretrial detention populations decreased by 50 percent from 2015 to 2018 – which was just one year after reforms were implemented. Additionally, New Jersey and San Francisco both saw at least 45 percent decreases in their overall jail populations after instituting bail reforms. We hope and expect these reforms (and others implemented more recently) will continue to lower rates of pretrial incarceration in cities and counties across the country.
While there isn’t a clear explanation for why jail incarceration and pretrial detention rates vary so much from city to city, it is clear that too many people cycle through jails each year, and reforms are long overdue. City leaders need to start investing in their communities instead of jails by expanding access to health care and social services, and implementing alternatives to incarceration.
Appendix
City
State
County
Jail detention rate (per 100,000 county residents)
Pretrial detention rate (per 100,000 county residents)
Violent crime rate (per 100,000 county residents)
Total crime rate (per 100,000 county residents)
Policing budget
Jail budget
Jail population change since 2011
Jail budget change since 2011
Albuquerque
N.M.
Bernalillo County
179
187
no data
no data
$211,084,000
$77,707,756
-52%
-13%
Atlanta
Ga.
Fulton County
279
198
no data
no data
$248,508,775
$90,484,158
8%
13%
Austin
Texas
Travis County
195
143
380
3,569
$491,265,529
$99,791,862
-31%
17%
Baltimore
Md.
None
331
330
1,843
6,116
$549,046,349
no data
no data
no data
Billings
Mont.
Yellowstone County
246
224
no data
no data
$27,017,423
$13,708,860
26%
69%
Birmingham
Ala.
Jefferson County
249
179
no data
no data
$92,775,797
no data
no data
no data
Boise
Idaho
Ada County
232
205
193
1,097
$70,561,456
$28,435,821
-8%
20%
Boston
Mass.
Suffolk County
201
118
no data
no data
$431,731,291
no data
no data
no data
Charleston
S.C.
Charleston County
286
229
196
1,384
$53,445,152
$40,081,245
-53%
9%
Charleston
W. Va.
Kanawha County
254
193
no data
no data
$22,489,588
$4,775,000
29%
-4%
Charlotte
N.C.
Mecklenburg County
143
125
no data
no data
$285,877,585
$90,941,557
-31%
-5%
Cheyenne
Wyo.
Laramie County
223
201
no data
no data
$14,493,787
$12,834,792
47%
35%
Chicago
Ill.
Cook County
126
113
497
2,076
$1,776,930,437
$437,932,791
-44%
40%
Colorado Springs
Colo.
El Paso County
279
111
461
3,254
$140,388,709
no data
no data
no data
Columbus
Ohio
Franklin County
169
133
no data
no data
$347,780,657
$82,811,353
-21%
19%
Dallas
Texas
Dallas County
198
152
406
2,275
$545,974,490
$143,920,841
-19%
20%
Denver
Colo.
Denver County
295
205
no data
no data
$277,927,093
$118,219,314
-29%
22%
Des Moines
Iowa
Polk County
206
174
342
2,344
$71,546,587
$38,268,987
-22%
10%
Detroit
Mich.
Wayne County
107
64
745
2,372
$318,193,356
$132,556,915
-43%
14%
El Paso
Texas
El Paso County
277
177
319
1,629
$157,607,718
$73,784,469
8%
1%
Fargo
N.D.
Cass County
154
155
326
2,595
$22,832,341
$14,171,961
2%
42%
Fort Worth
Texas
Tarrant County
168
121
201
1,417
$352,893,268
no data
no data
no data
Fresno
Calif.
Fresno County
305
221
no data
no data
$201,764,000
no data
no data
no data
Houston
Texas
Harris County
185
141
694
3,764
$899,879,053
no data
no data
no data
Indianapolis
Ind.
Marion County
249
189
no data
no data
$283,571,003
no data
no data
no data
Jackson
Miss.
Hinds County
259
252
no data
no data
$37,523,140
no data
no data
no data
Jacksonville
Fla.
Duval County
297
119
no data
no data
$481,594,597
$124,301,200
-18%
17%
Kansas City
Mo.
Jackson County
140
120
no data
no data
$262,247,405
$29,623,840
-15%
31%
Las Vegas
Nev.
Clark County
251
132
no data
no data
$173,702,925
$286,998,563
-12%
36%
Little Rock
Ark.
Pulaski County
272
203
875
4,385
$80,209,890
no data
no data
no data
Los Angeles
Calif.
Los Angeles County
170
105
346
1,442
$1,735,493,169
$1,347,462,000
-5%
44%
Louisville
Ky.
Jefferson County
308
171
602
4,014
$191,988,200
$56,639,000
-38%
-1%
Manchester
N.H.
Hillsborough County
100
53
no data
no data
$25,285,675
no data
no data
no data
Memphis
Tenn.
Shelby County
491
245
1,382
5,906
$274,511,008
$138,591,511
-29%
-8%
Miami
Fla.
Miami-Dade County
149
112
297
2,088
$281,251,000
$383,686,000
-35%
12%
Milwaukee
Wis.
Milwaukee County
240
126
842
2,444
$321,470,403
no data
no data
no data
Minneapolis
Minn.
Hennepin County
99
62
318
1,868
$193,360,000
$74,904,183
-44%
22%
Nashville
Tenn.
Davidson County
361
191
no data
no data
$216,790,900
$56,703,800
-33%
-12%
New Orleans
La.
Orleans Parish
397
301
no data
no data
$206,887,632
$73,312,897
-73%
-7%
New York
N.Y.
5 NYC Counties
98
71
no data
no data
$11,036,298,140
$2,307,064,976
-58%
-1%
Newark
N.J.
Essex County
262
242
no data
no data
$207,955,896
no data
no data
no data
Oklahoma City
Okla.
Oklahoma County
243
173
604
4,029
$226,626,456
no data
no data
no data
Omaha
Neb.
Douglas County
225
204
521
3,652
$159,838,743
$54,353,577
-4%
55%
Philadelphia
Pa.
Philadelphia County
389
257
no data
no data
$956,632,151
$220,169,920
-45%
-18%
Phoenix
Ariz.
Maricopa County
171
131
no data
no data
$909,129,491
no data
no data
no data
Portland
Maine
Cumberland County
154
90
65
746
$17,757,540
$20,579,182
-28%
16%
Portland
Ore.
Multnomah County
134
106
464
4,917
$238,190,326
$109,598,622
-35%
18%
Raleigh
N.C.
Wake County
111
101
132
1,038
$109,694,902
$50,109,750
-7%
55%
Sacramento
Calif.
Sacramento County
235
116
365
1,950
$184,342,524
no data
no data
no data
Salt Lake City
Utah
Salt Lake County
208
191
189
1,876
$82,235,729
$105,080,518
-36%
32%
San Antonio
Texas
Bexar County
195
184
591
4,253
$479,091,284
$72,653,612
-3%
7%
San Diego
Calif.
San Diego County
176
82
201
1,141
$542,087,473
$387,184,895
-10%
63%
San Francisco
Calif.
San Francisco County
143
118
no data
no data
$706,182,301
no data
no data
no data
San Jose
Calif.
Santa Clara County
172
127
254
1,631
$473,208,901
$243,451,168
-38%
15%
Seattle
Wash.
King County
137
107
227
1,927
$440,240,547
$208,640,119
-39%
20%
Sioux Falls
S.D.
Minnehaha County
174
174
493
3,589
$41,028,140
$17,020,439
-6%
53%
St. Louis
Mo.
None
393
395
1,913
8,049
$154,870,227
$35,382,770
-46%
-8%
Tampa
Fla.
Hillsborough County
211
145
235
1,479
$176,982,462
$192,045,470
-27%
4%
Tucson
Ariz.
Pima County
178
147
no data
no data
$193,274,430
$52,554,404
-2%
0%
Tulsa
Okla.
Tulsa County
248
172
647
4,080
$121,682,000
no data
no data
no data
Virginia Beach
Va.
None
328
148
129
1,885
$102,960,533
$40,694,736
-14%
21%
Washington, D.C.
D.C.
None
294
158
982
5,247
$655,379,632
$203,529,000
-51%
21%
Wichita
Kan.
Sedgwick County
230
171
885
4,967
$89,245,584
$33,793,490
-2%
6%
Footnotes
These cities represent some of the 50 largest cities across the country, as well as the largest cities in each state. ↩
Four cities – Baltimore, St. Louis, Virginia Beach, Va., and Washington, D.C. – are independent cities not part of a county. In these cases, the Vera Institute of Justice reported the detention rate for the cities themselves. ↩
We calculated violent crime and total crime rates for the 38 cities and counties for which the FBI had complete data. We did this by adding the reported crime counts from the city police and corresponding county sheriff’s offices together. (For independent cities, we only used the crime counts from city police.) Then, to calculate the rates, we used the populations for each county as reported in the Vera Institute of Justice’s Trends dataset, which was the same population used to calculate the jail and pretrial detention rates in this briefing. ↩
It’s difficult to compare cities because there are a multitude of factors that could explain differing crime rates. However, the FBI’s UCR data is the closest we can get to having somewhat standardized data across multiple cities and counties. ↩


 Estimates have been rounded for this graphic. Sources: Federal Bureau of Investigation,


