Mass Incarceration: The Whole Pie 2020
By Wendy Sawyer and Peter Wagner
March 24, 2020
Press release
This report is old. See our new version.
Can it really be true that most people in jail are being held before trial? And how much of mass incarceration is a result of the war on drugs? These questions are harder to answer than you might think, because our country’s systems of confinement are so fragmented. The various government agencies involved in the justice system collect a lot of critical data, but it is not designed to help policymakers or the public understand what’s going on. As public support for criminal justice reform continues to build, however, it’s more important than ever that we get the facts straight and understand the big picture.
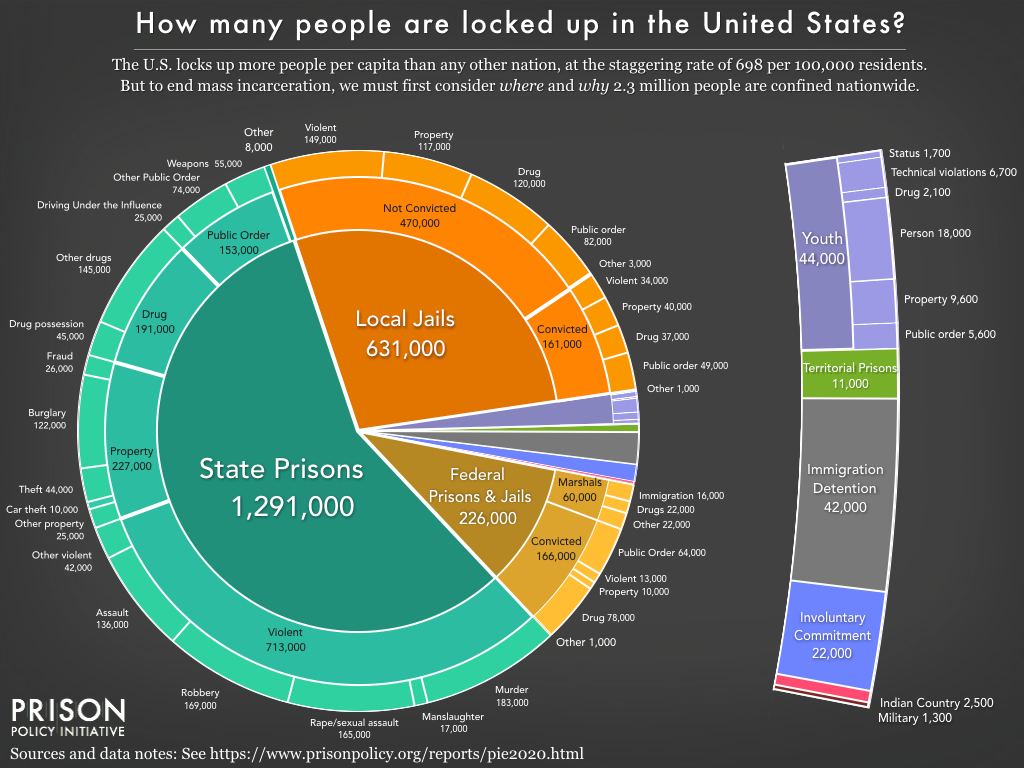
This report offers some much needed clarity by piecing together this country’s disparate systems of confinement. The American criminal justice system holds almost 2.3 million people in 1,833 state prisons, 110 federal prisons, 1,772 juvenile correctional facilities, 3,134 local jails, 218 immigration detention facilities, and 80 Indian Country jails as well as in military prisons, civil commitment centers, state psychiatric hospitals, and prisons in the U.S. territories.1 This report provides a detailed look at where and why people are locked up in the U.S., and dispels some modern myths to focus attention on the real drivers of mass incarceration, including exceedingly punitive responses to even the most minor offenses.

Slideshow 1. Swipe for more detailed views.
This big-picture view allows us to focus on the most important drivers of mass incarceration and identify important, but often ignored, systems of confinement. The detailed views bring these overlooked systems to light, from immigration detention to civil commitment and youth confinement. In particular, local jails often receive short shrift in larger discussions about criminal justice, but they play a critical role as “incarceration’s front door” and have a far greater impact than the daily population suggests.
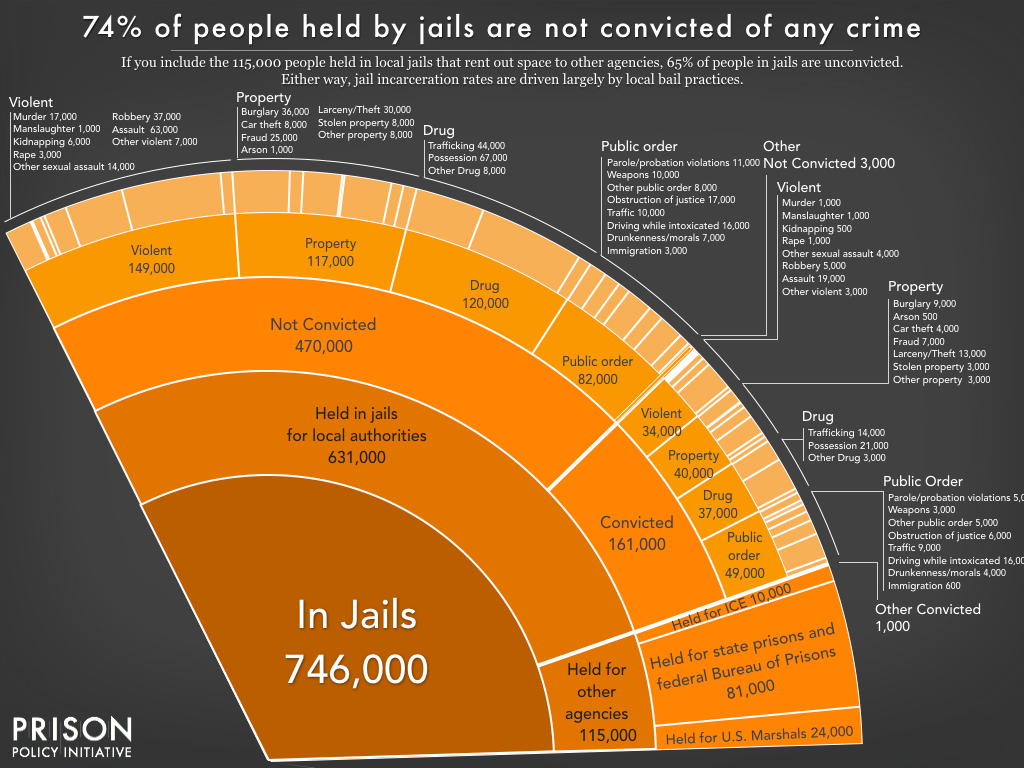
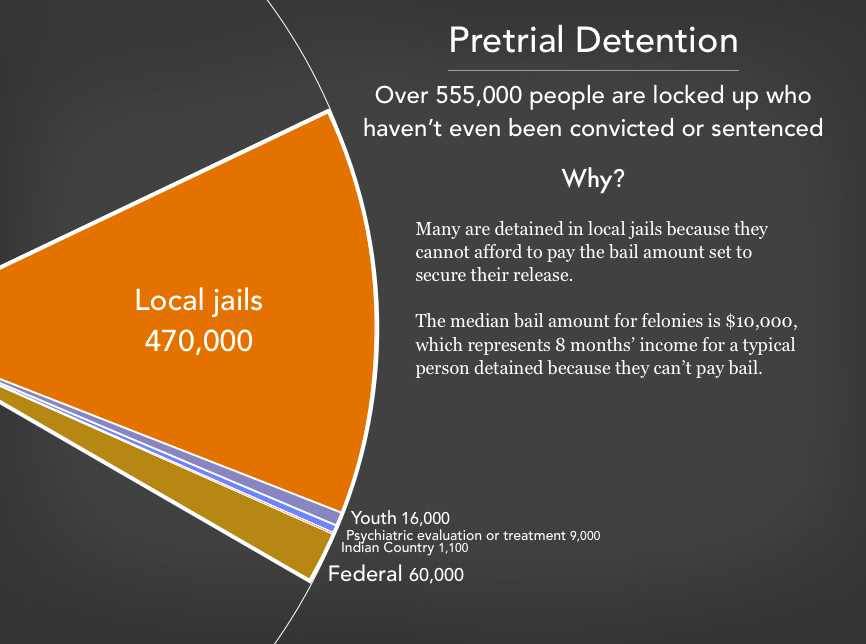
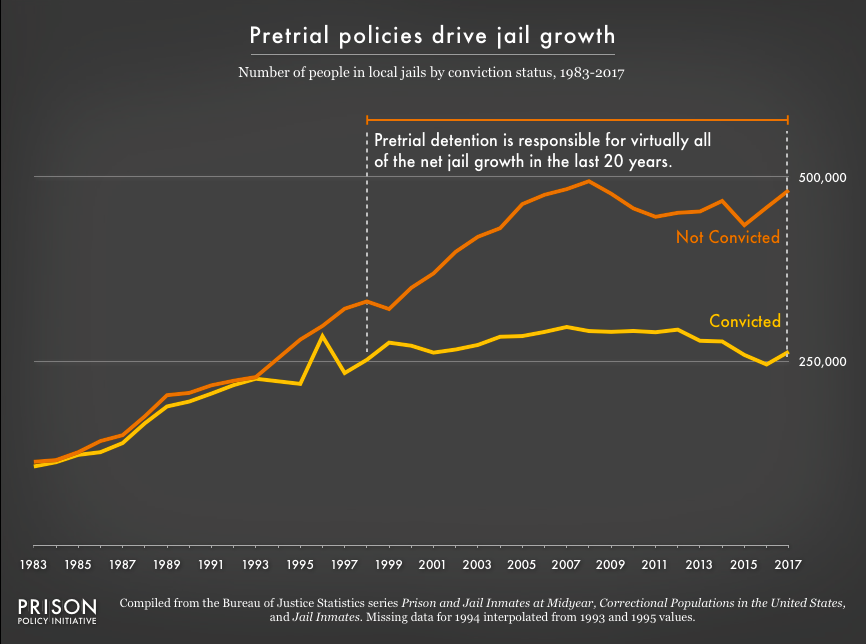
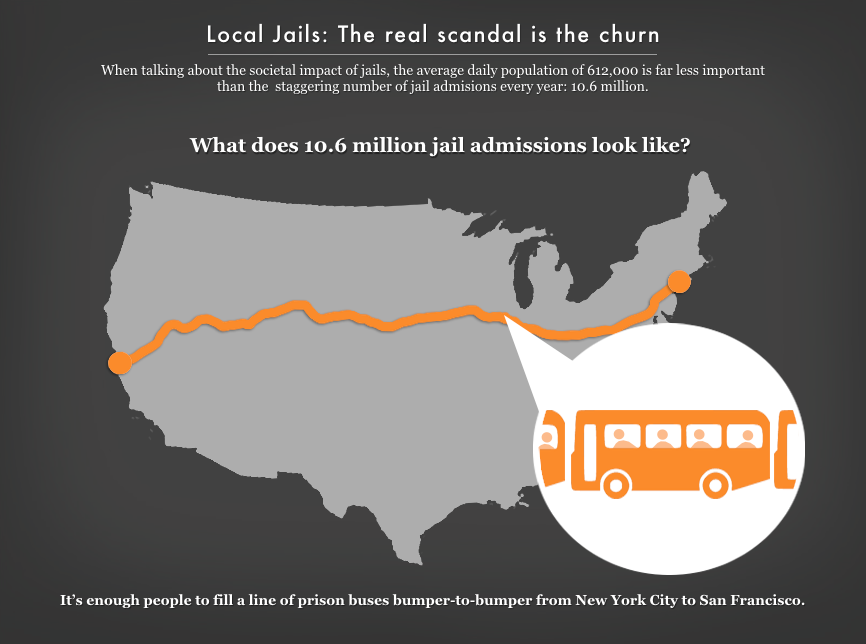
While this pie chart provides a comprehensive snapshot of our correctional system, the graphic does not capture the enormous churn in and out of our correctional facilities, nor the far larger universe of people whose lives are affected by the criminal justice system. Every year, over 600,000 people enter prison gates, but people go to jail 10.6 million times each year.2 Jail churn is particularly high because most people in jails have not been convicted.3 Some have just been arrested and will make bail within hours or days, while many others are too poor to make bail and remain behind bars until their trial. Only a small number (about 160,000 on any given day) have been convicted, and are generally serving misdemeanors sentences under a year. At least 1 in 4 people who go to jail will be arrested again within the same year — often those dealing with poverty, mental illness, and substance use disorders, whose problems only worsen with incarceration.
Slideshow 2. Swipe for more detail on pre-trial detention.
With a sense of the big picture, the next question is: why are so many people locked up? How many are incarcerated for drug offenses? Are the profit motives of private companies driving incarceration? Or is it really about public safety and keeping dangerous people off the streets? There are a plethora of modern myths about incarceration. Most have a kernel of truth, but these myths distract us from focusing on the most important drivers of incarceration.
Five myths about mass incarceration
The overcriminalization of drug use, the use of private prisons, and low-paid or unpaid prison labor are among the most contentious issues in criminal justice today because they inspire moral outrage. But they do not answer the question of why most people are incarcerated, or how we can dramatically — and safely — reduce our use of confinement. Likewise, emotional responses to sexual and violent offenses often derail important conversations about the social, economic, and moral costs of incarceration and lifelong punishment. Finally, simplistic solutions to reducing incarceration, such as moving people from jails and prisons to community supervision, ignore the fact that “alternatives” to incarceration often lead to incarceration anyway. Focusing on the policy changes that can end mass incarceration, and not just put a dent in it, requires the public to put these issues into perspective.
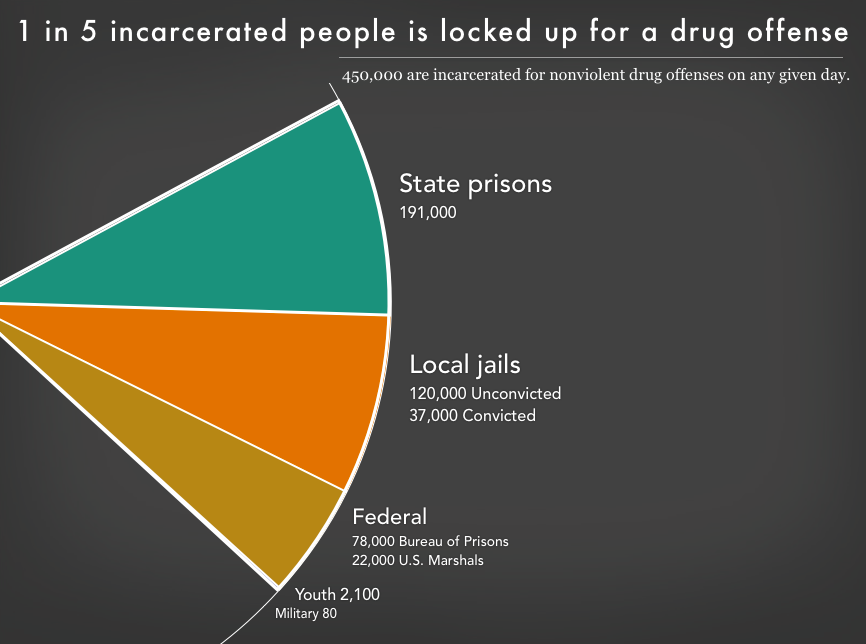
The first myth: Releasing “nonviolent drug offenders” would end mass incarceration
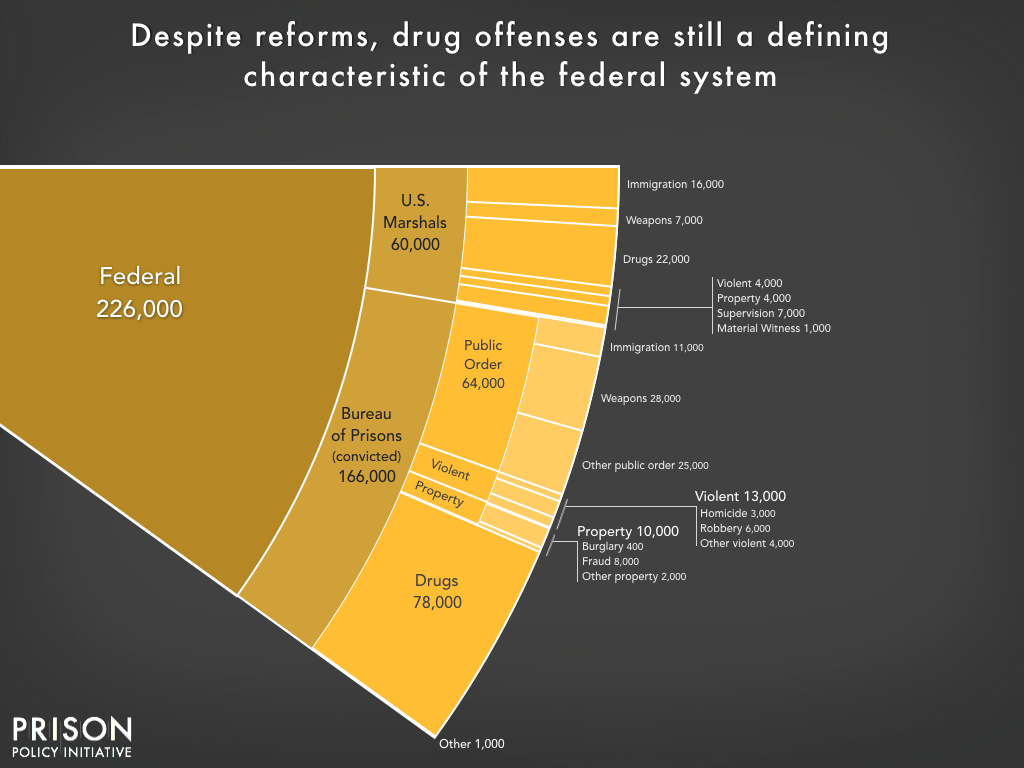
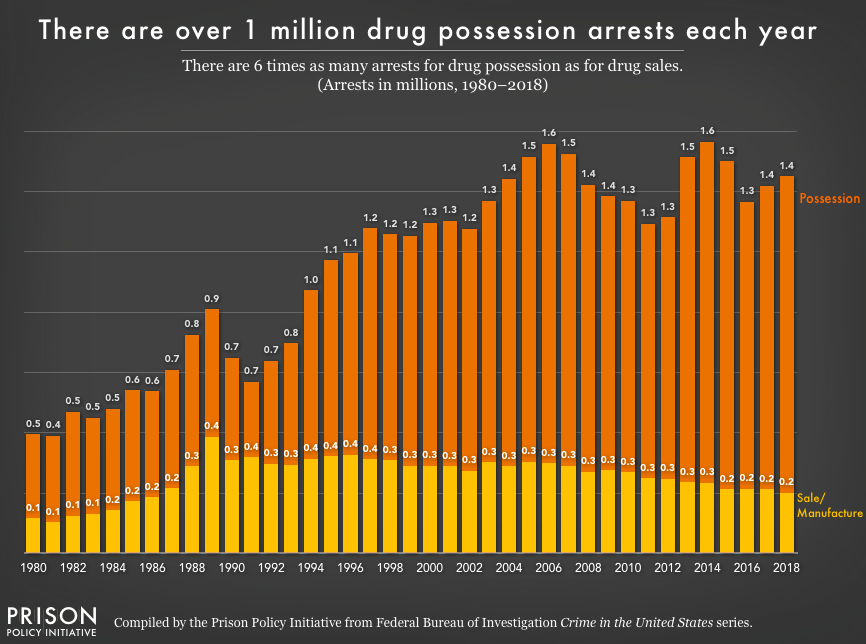
It’s true that police, prosecutors, and judges continue to punish people harshly for nothing more than drug possession. Drug offenses still account for the incarceration of almost half a million people,4 and nonviolent drug convictions remain a defining feature of the federal prison system. Police still make over 1 million drug possession arrests each year,5 many of which lead to prison sentences. Drug arrests continue to give residents of over-policed communities criminal records, hurting their employment prospects and increasing the likelihood of longer sentences for any future offenses.
Nevertheless, 4 out of 5 people in prison or jail are locked up for something other than a drug offense — either a more serious offense or an even less serious one. To end mass incarceration, we will have to change how our society and our justice system responds to crimes more serious than drug possession. We must also stop incarcerating people for behaviors that are even more benign.
Slideshow 3. Swipe for more detail on the War on Drugs.
The second myth: Private prisons are the corrupt heart of mass incarceration
In fact, less than 9% of all incarcerated people are held in private prisons; the vast majority are in publicly-owned prisons and jails.6 Some states have more people in private prisons than others, of course, and the industry has lobbied to maintain high levels of incarceration, but private prisons are essentially a parasite on the massive publicly-owned system — not the root of it.
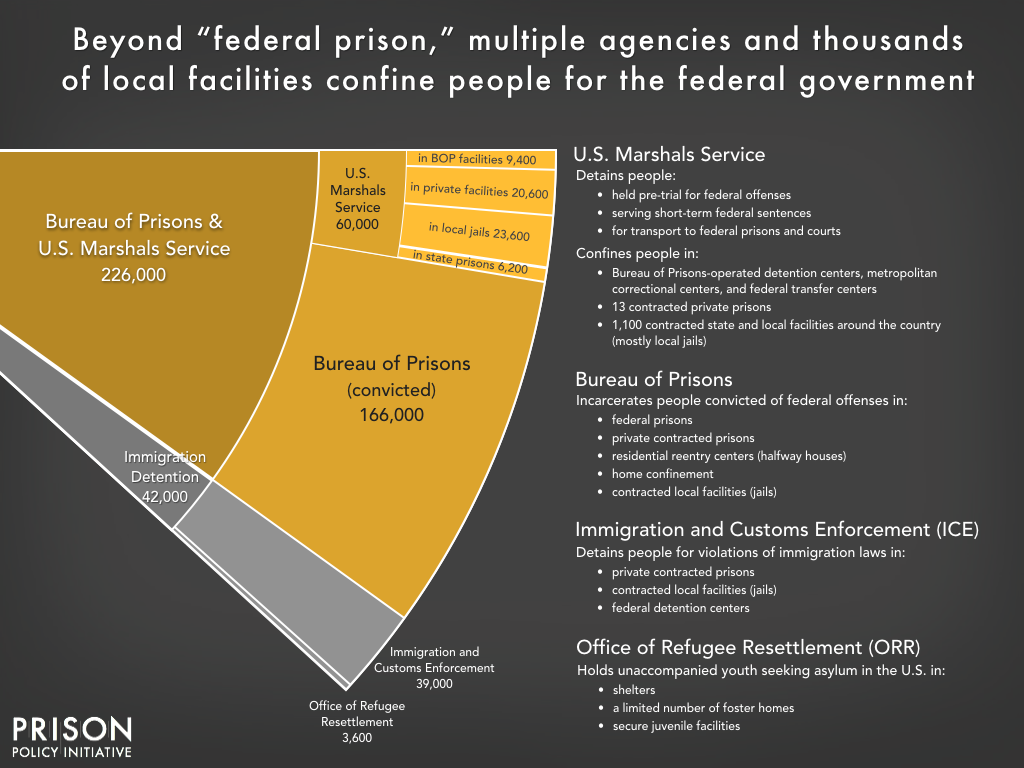
Nevertheless, a range of private industries and even some public agencies continue to profit from mass incarceration. Many city and county jails rent space to other agencies, including state prison systems,7 the U.S. Marshals Service, and Immigration and Customs Enforcement (ICE). Private companies are frequently granted contracts to operate prison food and health services (often so bad they result in major lawsuits), and prison and jail telecom and commissary functions have spawned multi-billion dollar private industries. By privatizing services like phone calls, medical care and commissary, prisons and jails are unloading the costs of incarceration onto incarcerated people and their families, trimming their budgets at an unconscionable social cost.

The third myth: Prisons are “factories behind fences” that exist to provide companies with a huge slave labor force
Simply put, private companies using prison labor are not what stands in the way of ending mass incarceration, nor are they the source of most prison jobs. Only about 5,000 people in prison — less than 1% — are employed by private companies through the federal PIECP program, which requires them to pay at least minimum wage before deductions. (A larger portion work for state-owned “correctional industries,” which pay much less, but this still only represents about 6% of people incarcerated in state prisons.)8
But prisons do rely on the labor of incarcerated people for food service, laundry and other operations, and they pay incarcerated workers unconscionably low wages: our 2017 study found that on average, incarcerated people earn between 86 cents and $3.45 per day for the most common prison jobs. In at least five states, those jobs pay nothing at all. Moreover, work in prison is compulsory, with little regulation or oversight, and incarcerated workers have few rights and protections. Forcing people to work for low or no pay and no benefits allows prisons to shift the costs of incarceration to incarcerated people — hiding the true cost of running prisons from most Americans.
The fourth myth: People in prison for violent or sexual crimes are too dangerous to be released
Particularly harmful is the myth that people who commit violent or sexual crimes are incapable of rehabilitation and thus warrant many decades or even a lifetime of punishment. As lawmakers and the public increasingly agree that past policies have led to unnecessary incarceration, it’s time to consider policy changes that go beyond the low-hanging fruit of “non-non-nons” — people convicted of non-violent, non-serious, non-sexual offenses. If we are serious about ending mass incarceration, we will have to change our responses to more serious and violent crime.
Recidivism: A slippery statistic
How much do different measures of recidivism reflect actual failure or success upon reentry?
As long as we are considering recidivism rates as a measure of public safety risk, we should also consider how recidivism is defined and measured. While this may sound esoteric, this is an issue that affects an important policy question: at what point — and with what measure — do we consider someone’s re-entry a success or failure?
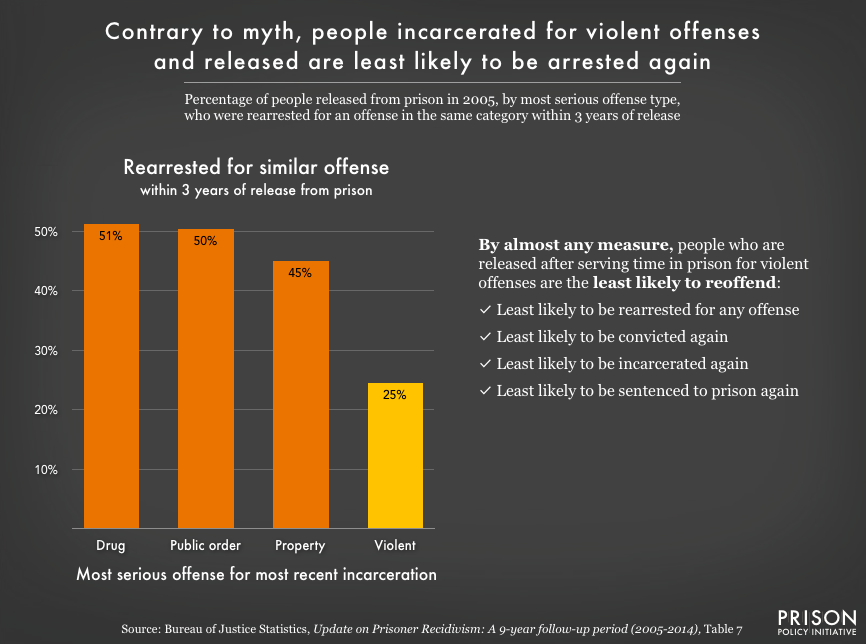
The term “recidivism” suggests a relapse in behavior, a return to criminal offending. But what is a valid sign of criminal offending: self-reported behavior, arrest, conviction, or incarceration? Defining recidivism as rearrest casts the widest net and results in the highest rates, but arrest does not suggest conviction, nor actual guilt. More useful measures than rearrest include conviction for a new crime, re-incarceration, or a new sentence of imprisonment; the latter may be most relevant, since it measures offenses serious enough to warrant a prison sentence. Importantly, people convicted of violent offenses have the lowest recidivism rates by each of these measures. However, the recidivism rate for violent offenses is a whopping 48 percentage points higher when rearrest, rather than imprisonment, is used to define recidivism.
The cutoff point at which recidivism is measured also matters: If someone is arrested for the first time 5, 10, or 20 years after they leave prison, that’s very different from someone arrested within months of release. The most recent government study of recidivism reported that 83% of state prisoners were arrested at some point in the 9 years following their release, but the vast majority of those were arrested within the first 3 years, and more than half within the first year. The longer the time period, the higher the reported recidivism rate — but the lower the actual threat to public safety.
A related question is whether it matters what the post-release offense is. For example, 71% of people imprisoned for a violent offense are rearrested within 5 years of release, but only 33% are rearrested for another violent offense; they are much more likely to be rearrested for a public order offense. If someone convicted of robbery is arrested years later for a liquor law violation, it makes no sense to view this very different, much less serious, offense the same way we would another arrest for robbery.
A final note about recidivism: While policymakers frequently cite reducing recidivism as a priority, few states collect the data that would allow them to monitor and improve their own performance in real time. For example, the Council of State Governments asked correctional systems what kind of recidivism data they collect and publish for people leaving prison and people starting probation. What they found is that states typically track just one measure of post-release recidivism, and few states track recidivism while on probation at all:
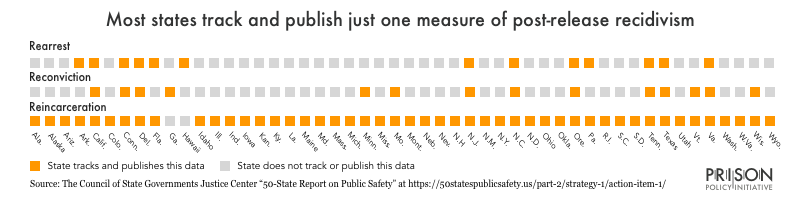
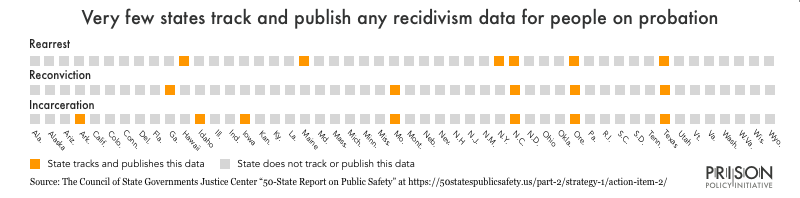
If state-level advocates and political leaders want to know if their state is even trying to reduce recidivism, we suggest one easy litmus test: Do they collect and publish basic data about the number and causes of people’s interactions with the justice system while on probation, or after release from prison?
Recidivism data do not support the belief that people who commit violent crimes ought to be locked away for decades for the sake of public safety. People convicted of violent and sexual offenses are actually among the least likely to be rearrested, and those convicted of rape or sexual assault have rearrest rates 20% lower than all other offense categories combined. More broadly, people convicted of any violent offense are less likely to be rearrested in the years after release than those convicted of property, drug, or public order offenses. One reason: age is one of the main predictors of violence. The risk for violence peaks in adolescence or early adulthood and then declines with age, yet we incarcerate people long after their risk has declined.
Despite this evidence, people convicted of violent offenses often face decades of incarceration, and those convicted of sexual offenses can be committed to indefinite confinement or stigmatized by sex offender registries long after completing their sentences. And while some of the justice system’s response has more to do with retribution than public safety, more incarceration is not what most victims of crime want. National survey data show that most victims want violence prevention, social investment, and alternatives to incarceration that address the root causes of crime, not more investment in carceral systems that cause more harm.
The fifth myth: Expanding community supervision is the best way to reduce incarceration
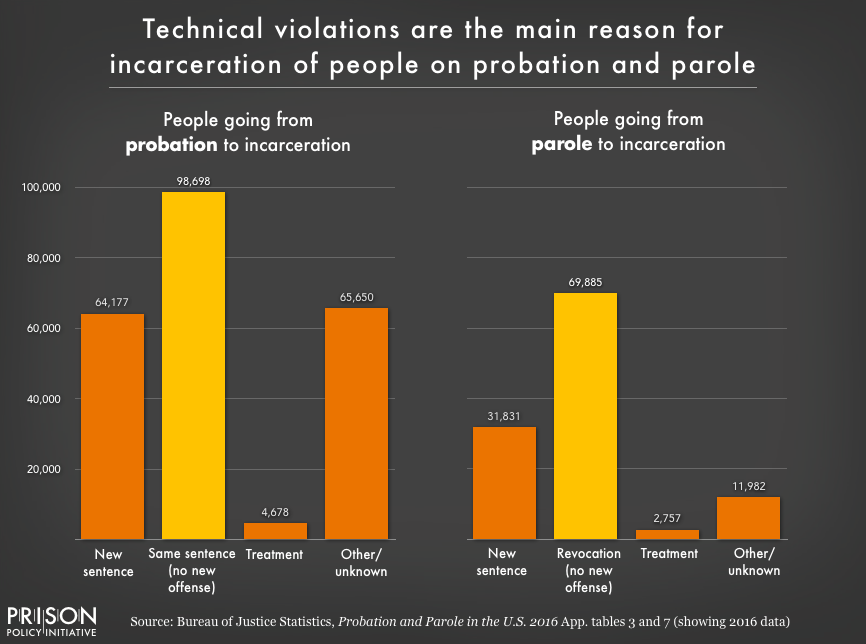
Community supervision, which includes probation, parole, and pretrial supervision, is often seen as a “lenient” punishment, or as an ideal “alternative” to incarceration. But while remaining in the community is certainly preferable to being locked up, the conditions imposed on those under supervision are often so restrictive that they set people up to fail. The long supervision terms, numerous and burdensome requirements, and constant surveillance (especially with electronic monitoring) result in frequent “failures,” often for minor infractions like breaking curfew or failing to pay unaffordable supervision fees.
In 2016, at least 168,000 people were incarcerated for such “technical violations” of probation or parole — that is, not for any new crime.9 Probation, in particular, leads to unnecessary incarceration; until it is reformed to support and reward success rather than detect mistakes, it is not a reliable “alternative.”
Slideshow 4. Swipe for more detail about what the data on recividism really shows.
The high costs of low-level offenses
Most justice-involved people in the U.S. are not accused of serious crimes; more often, they are charged with misdemeanors or non-criminal violations. Yet even low-level offenses, like technical violations of probation and parole, can lead to incarceration and other serious consequences. Rather than investing in community-driven safety initiatives, cities and counties are still pouring vast amounts of public resources into the processing and punishment of these minor offenses.
Probation & parole violations and “holds” lead to unnecessary incarceration
Often overlooked in discussions about mass incarceration are the various “holds” that keep people behind bars for administrative reasons. A common example is when people on probation or parole are jailed for violating their supervision, either for a new crime or a “technical violation.” If a parole or probation officer suspects that someone has violated supervision conditions, they can file a “detainer” (or “hold”), rendering that person ineligible for release on bail. For people struggling to rebuild their lives after conviction or incarceration, returning to jail for a minor infraction can be profoundly destabilizing. The national data do not exist to say exactly how many people are in jail because of probation or parole violations or detainers, but initial evidence shows that these account for over one-third of some jail populations. This problem is not limited to local jails, either; in 2019, the Council of State Governments found that 1 in 4 people in state prisons are incarcerated as a result of supervision violations.
Misdemeanors: Minor offenses with major consequences
The “massive misdemeanor system” in the U.S. is another important but overlooked contributor to overcriminalization and mass incarceration. For behaviors as benign as jaywalking or sitting on a sidewalk, an estimated 13 million misdemeanor charges sweep droves of Americans into the criminal justice system each year (and that’s excluding civil violations and speeding). These low-level offenses account for over 25% of the daily jail population nationally, and much more in some states and counties.
Misdemeanor charges may sound like small potatoes, but they carry serious financial, personal, and social costs, especially for defendants but also for broader society, which finances the processing of these court cases and all of the unnecessary incarceration that comes with them. And then there are the moral costs: People charged with misdemeanors are often not appointed counsel and are pressured to plead guilty and accept a probation sentence to avoid jail time. This means that innocent people routinely plead guilty, and are then burdened with the many collateral consequences that come with a criminal record, as well as the heightened risk of future incarceration for probation violations. A misdemeanor system that pressures innocent defendants to plead guilty seriously undermines American principles of justice.
“Low-level fugitives” live in fear of incarceration for missed court dates and unpaid fines
Defendants can end up in jail even if their offense is not punishable with jail time. Why? Because if a defendant fails to appear in court or to pay fines and fees, the judge can issue a “bench warrant” for their arrest, directing law enforcement to jail them in order to bring them to court. While there is currently no national estimate of the number of active bench warrants, their use is widespread and in some places, incredibly common. In Monroe County, N.Y., for example, over 3,000 people have an active bench warrant at any time, more than 3 times the number of people in the county jails.
But bench warrants are often unnecessary. Most people who miss court are not trying to avoid the law; more often, they forget, are confused by the court process, or have a schedule conflict. Once a bench warrant is issued, however, defendants frequently end up living as “low-level fugitives,” quitting their jobs, becoming transient, and/or avoiding public life (even hospitals) to avoid having to go to jail.
Offense categories might not mean what you think
To understand the main drivers of incarceration, the public needs to see how many people are incarcerated for different offense types. But the reported offense data oversimplifies how people interact with the criminal justice system in two important ways: it reports only one offense category per person, and it reflects the outcome of the legal process, obscuring important details of actual events.

First, when a person is in prison for multiple offenses, only the most serious offense is reported.10 So, for example, there are people in prison for violent offenses who were also convicted of drug offenses, but they are included only in the “violent” category in the data. This makes it hard to grasp the complexity of criminal events, such as the role drugs may have played in violent or property offenses. We must also consider that almost all convictions are the result of plea bargains, where defendants plead guilty to a lesser offense, possibly in a different category, or one that they did not actually commit.
Secondly, many of these categories group together people convicted of a wide range of offenses. For violent offenses especially, these labels can distort perceptions of individual “violent offenders” and exaggerate the scale of dangerous violent crime. For example, “murder” is an extremely serious offense, but that category groups together the small number of serial killers with people who committed acts that are unlikely, for reasons of circumstance or advanced age, to ever happen again. It also includes offenses that the average person may not consider to be murder at all. In particular, the felony murder rule says that if someone dies during the commission of a felony, everyone involved can be as guilty of murder as the person who pulled the trigger. Acting as lookout during a break-in where someone was accidentally killed is indeed a serious offense, but many may be surprised that this can be considered murder in the U.S.11
Lessons from the smaller “slices”: Youth, immigration, and involuntary commitment
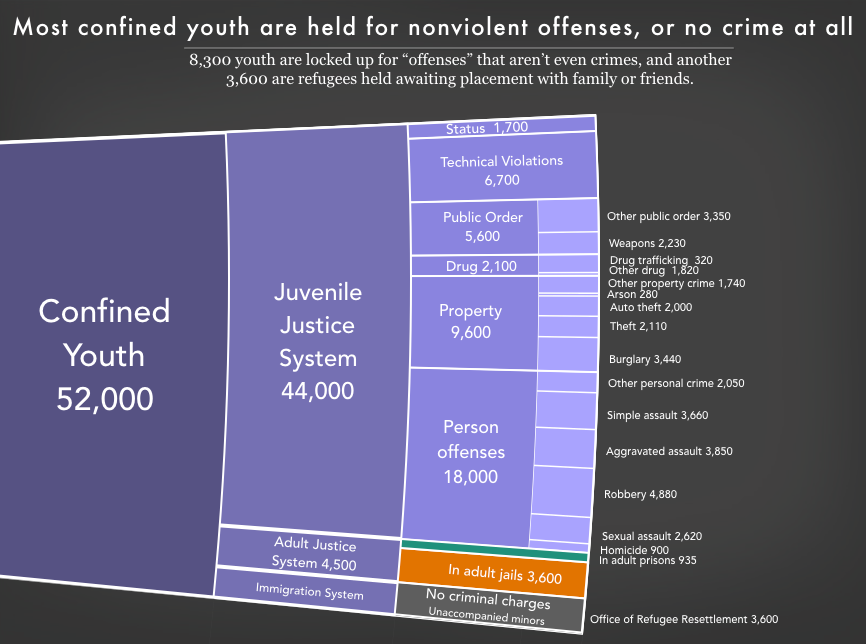
Looking more closely at incarceration by offense type also exposes some disturbing facts about the 52,000 youth in confinement in the United States: too many are there for a “most serious offense” that is not even a crime. For example, there are over 6,600 youth behind bars for technical violations of their probation, rather than for a new offense. An additional 1,700 youth are locked up for “status” offenses, which are “behaviors that are not law violations for adults, such as running away, truancy, and incorrigibility.”12 Nearly 1 in 10 youth held for a criminal or delinquent offense is locked in an adult jail or prison, and most of the others are held in juvenile facilities that look and operate a lot like prisons and jails.
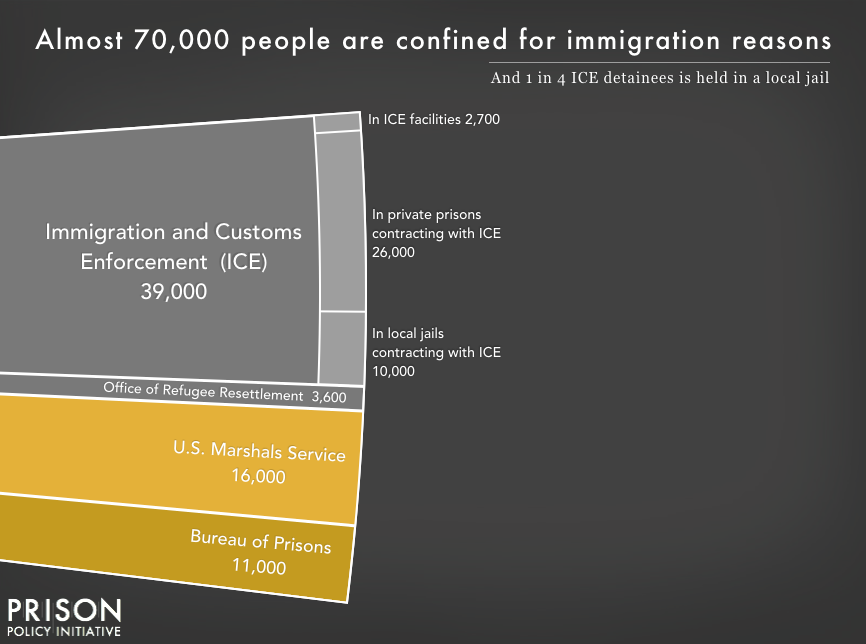
Turning to the people who are locked up criminally and civilly for immigration-related reasons, we find that 11,100 people are in federal prisons for criminal convictions of immigration offenses, and 13,600 more are held pretrial by the U.S. Marshals. The vast majority of people incarcerated for criminal immigration offenses are accused of illegal entry or illegal re-entry — in other words, for no more serious offense than crossing the border without permission.13
Slideshow 5. Swipe for more detail about youth confinement, immigrant confinement and psychiatric confinement.
Another 39,000 people are civilly detained by U.S. Immigration and Customs Enforcement (ICE) not for any crime, but simply for their undocumented immigrant status. ICE detainees are physically confined in federally-run or privately-run immigration detention facilities, or in local jails under contract with ICE. An additional 3,600 unaccompanied children are held in the custody of the Office of Refugee Resettlement (ORR), awaiting placement with parents, family members, or friends. While these children are not held for any criminal or delinquent offense, most are held in shelters or even juvenile placement facilities under detention-like conditions.14
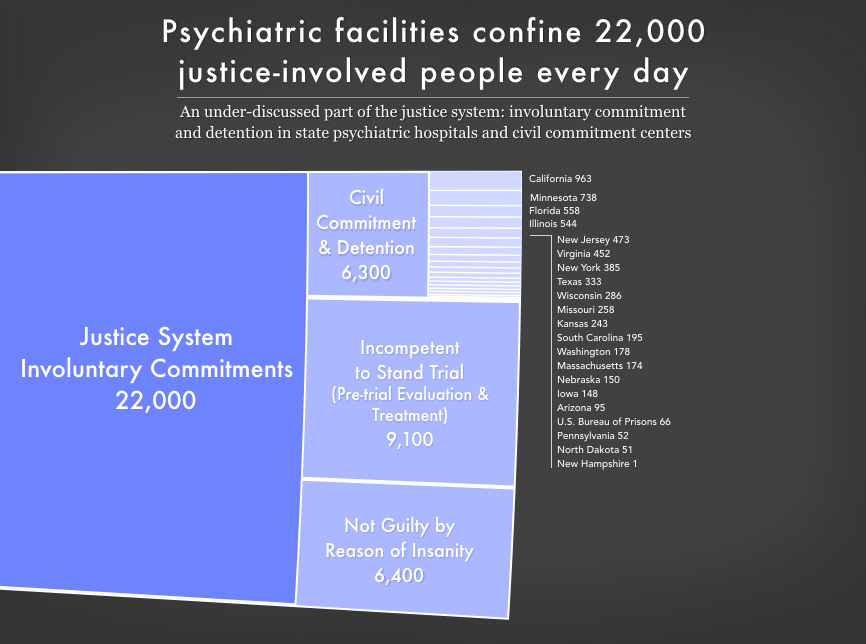
Adding to the universe of people who are confined because of justice system involvement, 22,000 people are involuntarily detained or committed to state psychiatric hospitals and civil commitment centers. Many of these people are not even convicted, and some are held indefinitely. 9,000 are being evaluated pre-trial or treated for incompetency to stand trial; 6,000 have been found not guilty by reason of insanity or guilty but mentally ill; another 6,000 are people convicted of sexual crimes who are involuntarily committed or detained after their prison sentences are complete. While these facilities aren’t typically run by departments of correction, they are in reality much like prisons.
Beyond the “Whole Pie”: Community supervision, poverty, and race and gender disparities
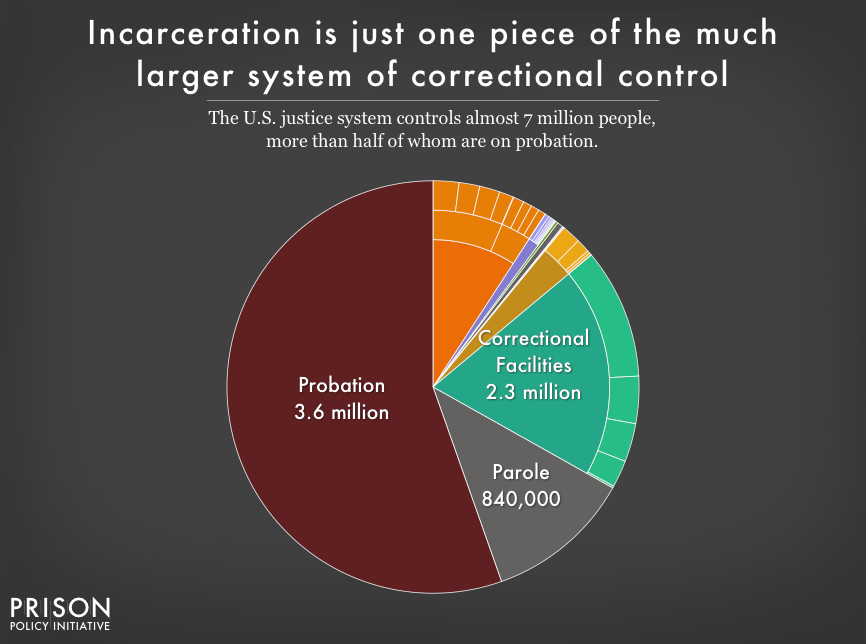
Once we have wrapped our minds around the “whole pie” of mass incarceration, we should zoom out and note that people who are incarcerated are only a fraction of those impacted by the criminal justice system. There are another 840,000 people on parole and a staggering 3.6 million people on probation. Many millions more have completed their sentences but are still living with a criminal record, a stigmatizing label that comes with collateral consequences such as barriers to employment and housing.

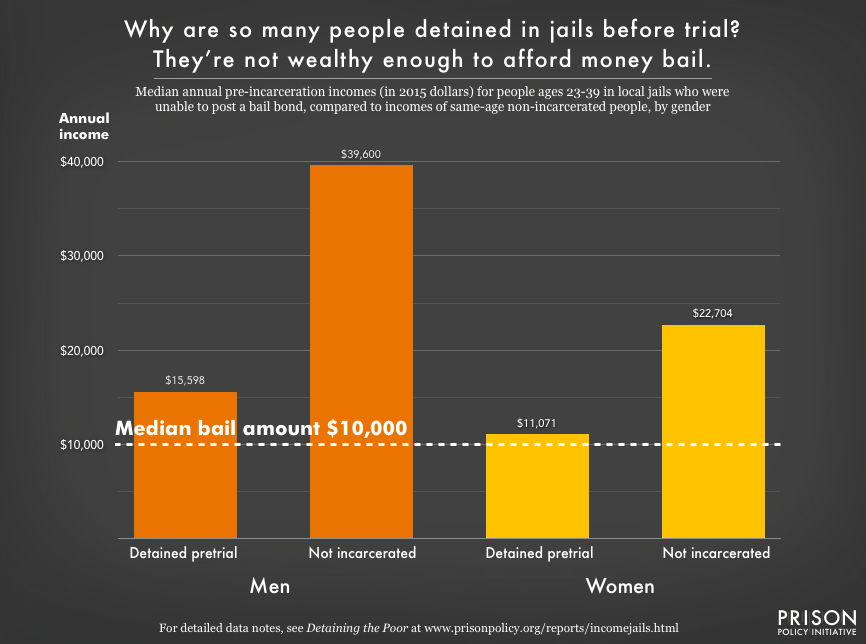
Beyond identifying how many people are impacted by the criminal justice system, we should also focus on who is most impacted and who is left behind by policy change. Poverty, for example, plays a central role in mass incarceration. People in prison and jail are disproportionately poor compared to the overall U.S. population.15 The criminal justice system punishes poverty, beginning with the high price of money bail: The median felony bail bond amount ($10,000) is the equivalent of 8 months’ income for the typical detained defendant. As a result, people with low incomes are more likely to face the harms of pretrial detention. Poverty is not only a predictor of incarceration; it is also frequently the outcome, as a criminal record and time spent in prison destroys wealth, creates debt, and decimates job opportunities.16
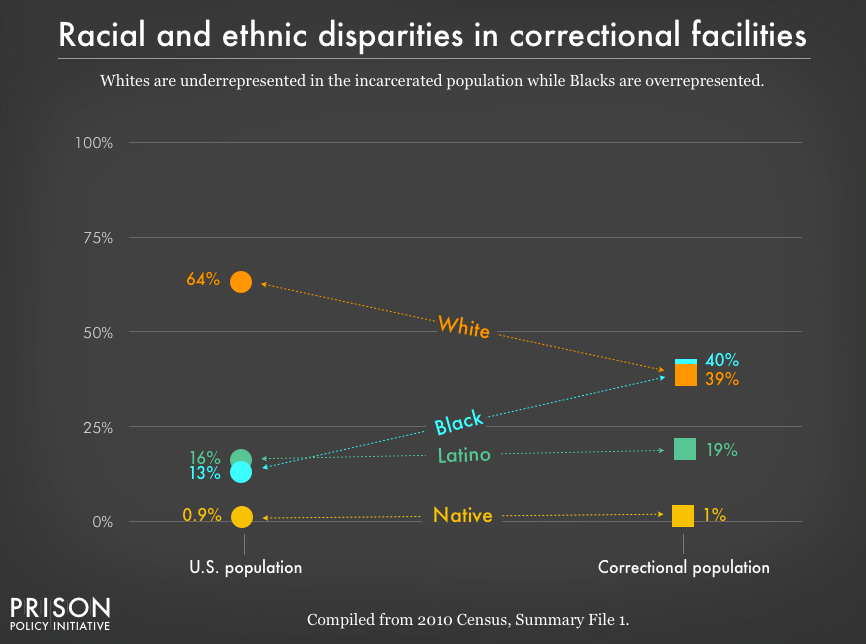
It’s no surprise that people of color — who face much greater rates of poverty — are dramatically overrepresented in the nation’s prisons and jails. These racial disparities are particularly stark for Black Americans, who make up 40% of the incarcerated population despite representing only 13% of U.S residents. The same is true for women, whose incarceration rates have for decades risen faster than men’s, and who are often behind bars because of financial obstacles such as an inability to pay bail. As policymakers continue to push for reforms that reduce incarceration, they should avoid changes that will widen disparities, as has happened with juvenile confinement and with women in state prisons.
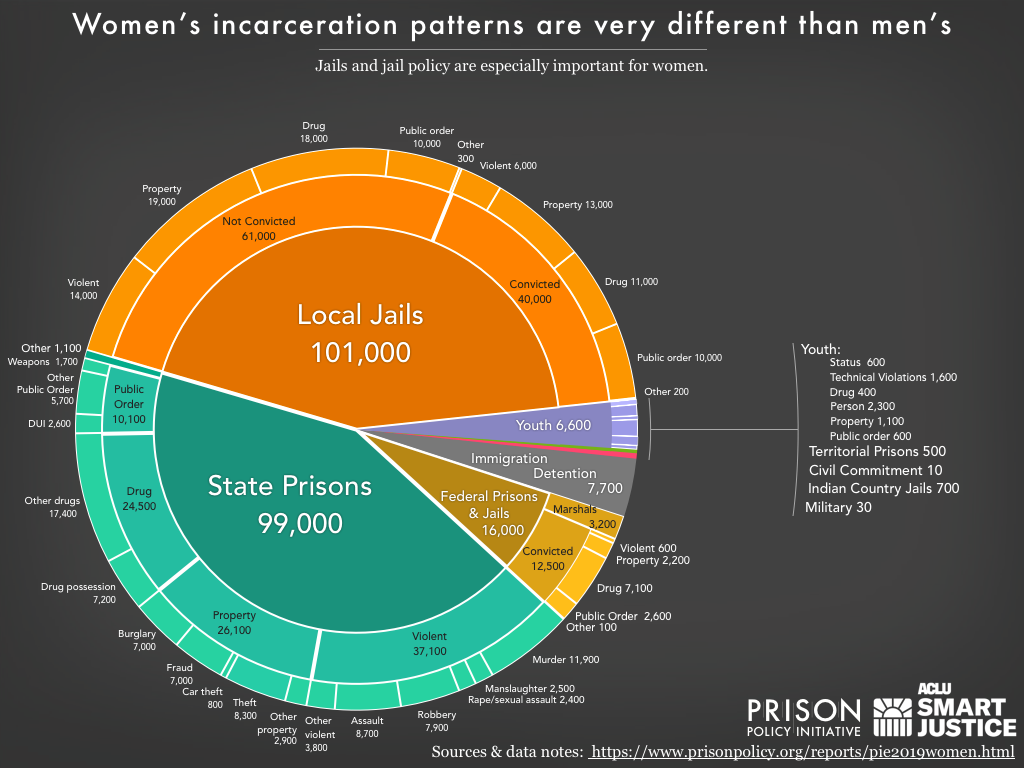
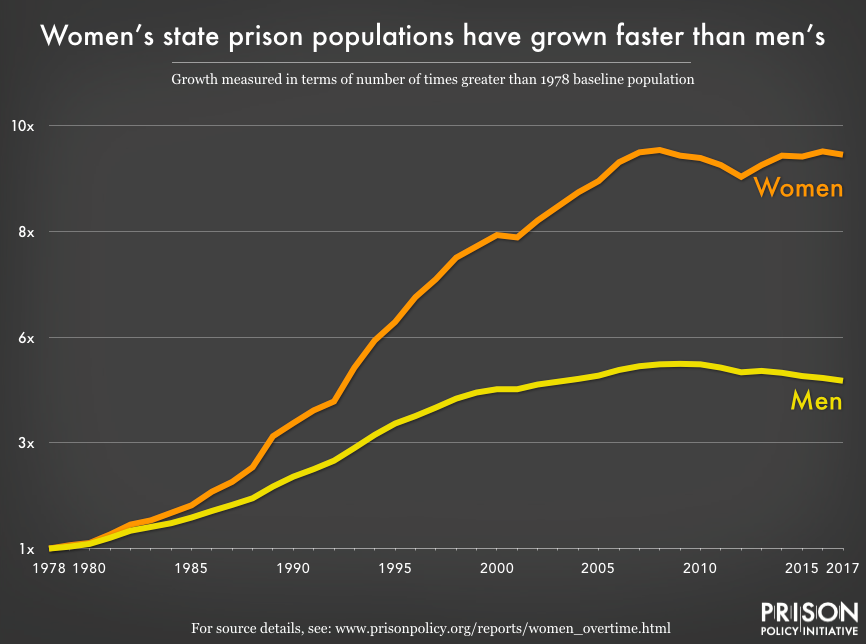
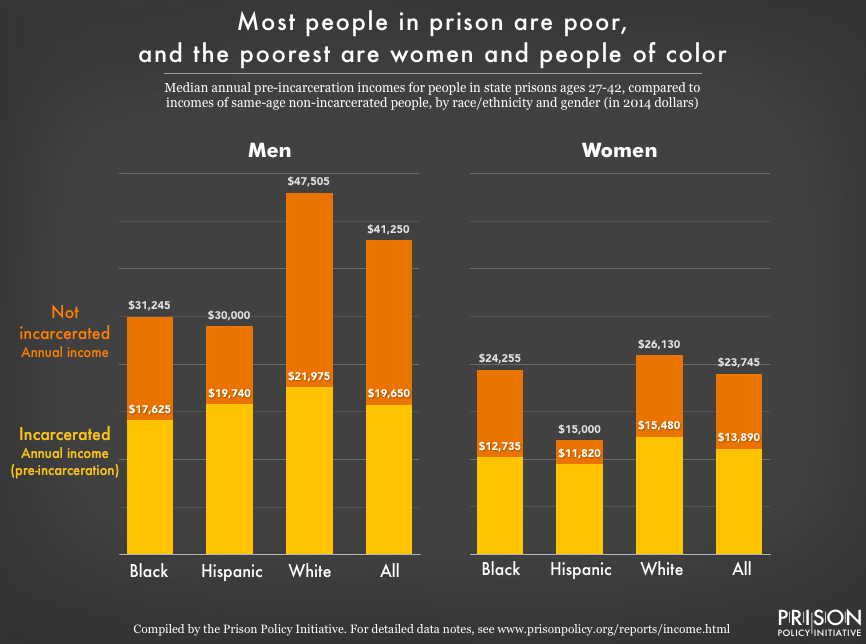
Slideshow 6. Swipe for more detail about race, gender and income disparities.
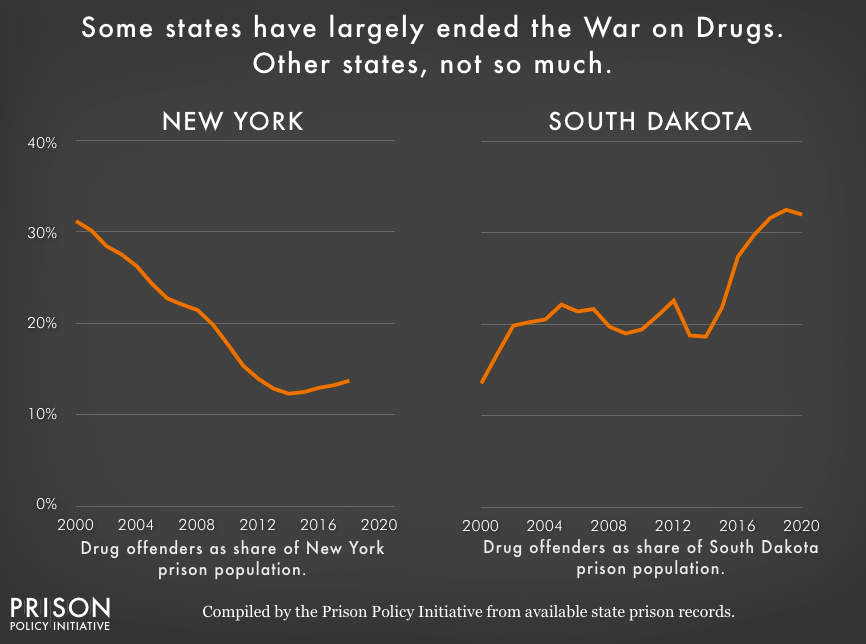
Equipped with the full picture of how many people are locked up in the United States, where, and why, our nation has a better foundation for the long overdue conversation about criminal justice reform. For example, the data makes it clear that ending the war on drugs will not alone end mass incarceration, though the federal government and some states have taken an important step by reducing the number of people incarcerated for drug offenses. Looking at the “whole pie” also opens up other conversations about where we should focus our energies:
- Are state officials and prosecutors willing to rethink not just long sentences for drug offenses, but the reflexive, simplistic policymaking that has served to increase incarceration for violent offenses as well?
- Do policymakers and the public have the stamina to confront the second largest slice of the pie: the thousands of locally administered jails? Will state, county, and city governments be brave enough to end money bail without imposing unnecessary conditions in order to bring down pretrial detention rates? Will local leaders be brave enough to redirect public spending to smarter investments like community-based drug treatment and job training?
- What is the role of the federal government in ending mass incarceration? The federal prison system is just a small slice of the total pie, but the federal government can certainly use its financial and ideological power to incentivize and illuminate better paths forward. At the same time, how can elected sheriffs, district attorneys, and judges — who all control larger shares of the correctional pie — slow the flow of people into the criminal justice system?
- Given that the companies with the greatest impact on incarcerated people are not private prison operators, but service providers that contract with public facilities, will states respond to public pressure to end contracts that squeeze money from people behind bars?
- Can we implement reforms that both reduce the number of people incarcerated in the U.S. and the well-known racial and ethnic disparities in the criminal justice system?
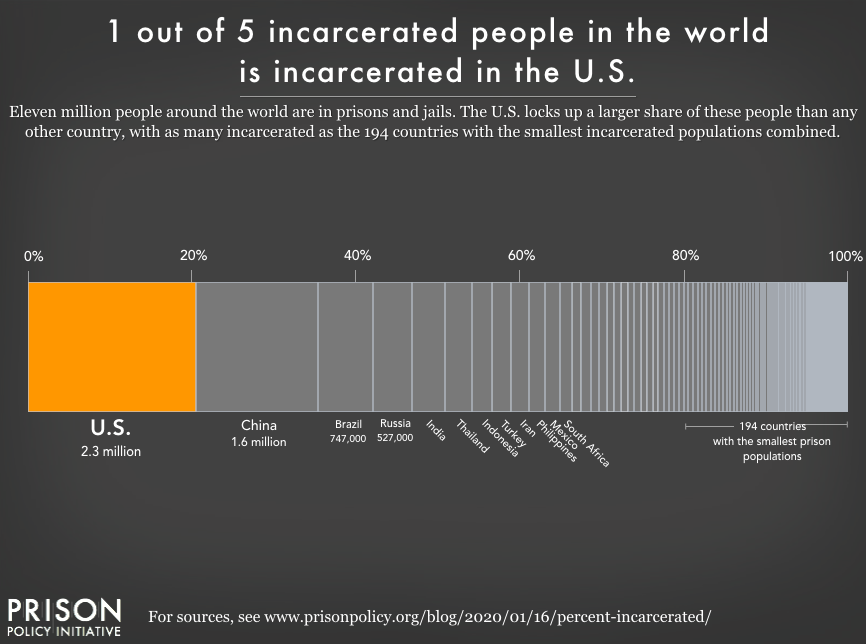
Now that we can see the big picture of how many people are locked up in the United States in the various types of facilities, we can see that something needs to change. Looking at the big picture requires us to ask if it really makes sense to lock up 2.3 million people on any given day, giving this nation the dubious distinction of having the highest incarceration rate in the world. Both policymakers and the public have the responsibility to carefully consider each individual slice in turn to ask whether legitimate social goals are served by putting each group behind bars, and whether any benefit really outweighs the social and fiscal costs.
Even narrow policy changes, like reforms to money bail, can meaningfully reduce our society’s use of incarceration. At the same time, we should be wary of proposed reforms that seem promising but will have only minimal effect, because they simply transfer people from one slice of the correctional “pie” to another. Keeping the big picture in mind is critical if we hope to develop strategies that actually shrink the “whole pie.”
Data sources & methodology
People new to criminal justice issues might reasonably expect that a big picture analysis like this would be produced not by reform advocates, but by the criminal justice system itself. The unfortunate reality is that there isn’t one centralized criminal justice system to do such an analysis. Instead, even thinking just about adult corrections, we have a federal system, 50 state systems, 3,000+ county systems and 25,000+ municipal systems, and so on. Each of these systems collects data for its own purposes that may or may not be compatible with data from other systems, and that might duplicate or omit people counted by other systems.
This isn’t to discount the work of the Bureau of Justice Statistics, which, despite limited resources, undertakes the Herculean task of organizing and standardizing the data on correctional facilities. And it’s not to say that the FBI doesn’t work hard to aggregate and standardize police arrest and crime report data. But the fact is that the local, state, and federal agencies that carry out the work of the criminal justice system - and are the sources of BJS and FBI data - weren’t set up to answer many of the simple-sounding questions about the “system.”
Similarly, there are systems involved in the confinement of justice-involved people that might not consider themselves part of the criminal justice system, but should be included in a holistic view of incarceration. Juvenile justice, civil detention and commitment, immigration detention, and commitment to psychiatric hospitals for criminal justice involvement are examples of this broader universe of confinement that is often ignored. The “whole pie” incorporates data from these systems to provide the most comprehensive view of incarceration possible.
To produce this report, we took the most recent data available for each part of these systems, and where necessary adjusted the data to ensure that each person was only counted once, only once, and in the right place.
Finally, readers who rely on this report year after year may notice that some of the data have not changed since the last version was published in 2019, including the number of people in jails in Indian country, on probation, and on parole. This is because, since 2017, government data releases have been delayed by many months - even years - compared to past publication schedules, and the data collected over two years ago have yet to be made public.

These delays are not limited to the regular data publications that this report relies on, but also special data collections that provide richly detailed, self-reported data about incarcerated people and their experiences in prison and jail, namely the Survey of Prison Inmates (conducted in 2016 for the first time since 2004) and the Survey of Inmates in Local Jails (last conducted in 2002 and now slated for 2021 — which would make a 2022 report about 15 years off-schedule).
While we eagerly await these future releases from the Bureau of Justice Statistics, we anticipate that without significant investments in funding, staffing, and leadership, its data releases will continue at their current pace. For this reason, the next updates to our “Whole Pie” reports will likely also follow a slower schedule.
Not directly comparable with past pie reports
Before explaining the data sources, we want to explain two methodology changes that make this report not directly comparable with past reports. Unlike past years, in this report:
- We included all youth in residential placement for justice system involvement that were “detained” (as opposed to “committed”) in our pretrial detention detail slide. Until last year (2019), we included only youth who were detained because they were awaiting a hearing or adjudication. Our current methodology also includes youth whose status was “detained” while they were awaiting disposition or placement, because the court had not yet committed them to the facility where they were held.
- We included children held in the custody of the Office of Refugee Resettlement (ORR) in our immigration detention count in the main graphic, and in several detail slides. While these children are not held by ORR because of any criminal or delinquent charges, they are typically held in detention-like conditions; therefore, they fit into our holistic view of confinement in the U.S.
Data sources
This briefing uses the most recent data available on the number of people in various types of facilities and the most significant charge or conviction. This year, as discussed above, several planned government reports were not published on their anticipated schedule, delayed in part by the government shutdown of December 2018 and January 2019. We sought out alternative data sources where possible, but some data simply has yet to be updated. Furthermore, because not all types of data are collected each year, we sometimes had to calculate estimates; for example, we applied the percentage distribution of offense types from the previous year to the current year’s total count data. For this reason, we chose to round most labels in the graphics to the nearest thousand, except where rounding to the nearest ten, nearest one hundred, or (in two cases in the jails detail slide) the nearest 500 was more informative in that context. This rounding process may also result in some parts not adding up precisely to the total.
Our data sources were:
- State prisons: Vera Institute of Justice, People in Prison 2018 Table 2 provides the total yearend 2018 population. This report does not include offense data, however, so we applied the ratio of offense types calculated from the most recent Bureau of Justice Statistics report on this population, Prisoners in 2017 Table 13 (as of December 31, 2016) to the 2018 total state prison population.
- Jails: Bureau of Justice Statistics, Jail Inmates in 2017 Table 1 and Table 3, reporting average daily population and convicted status for midyear 2017, and our analysis of the Survey of Inmates in Local Jails, 200217 for offense types. See below and Who is in jail? Deep dive for why we used our own analysis rather than the otherwise excellent Bureau of Justice Statistics analysis of the same dataset, Profile of Jail Inmates, 2002.
- Federal:
- Bureau of Prisons: Federal Bureau of Prisons (BOP) Population Statistics, reporting data as of February 20, 2020 (total population of 174,923), and Prisoners in 2017 Table 15, reporting data as of September 30, 2017 (we applied the percentage distribution of offense types from that table to the 2020 convicted population).
- U.S. Marshals Service provided a breakdown of its “Prisoner Operations” population as of October 2018 by facility type (state and local, private contracted, federal, and non-paid facilities) in a response to our public records request. The number held in local jails came from our analysis of the Annual Survey of Jails 2017 data set, which showed that 23,552 people were held for the Marshals Service. To estimate the number held in state facilities, we subtracted the 23,552 held in jails from the combined “state and local facilities” population reported in the FOIA response. Because the offense totals reported in the FOIA response do not add up to the reported population total, we created our own estimated offense breakdown, by applying the ratio of reported offense types (excluding the vague “other new offense” and “not reported” categories”) to the total October 2018 population. It is worth noting that the U.S. Marshals detainees held in federal facilities and private contracted facilities were not included in several previous editions of this report, as they are not included in most of the Bureau of Justice Statistics’ jails or prisons data sets.
- Youth: Office of Juvenile Justice and Delinquency Prevention, Easy Access to the Census of Juveniles in Residential Placement (EZACJRP), reporting total population and facility data for October 25, 2017. Our data on youth incarcerated in adult prisons comes from Prisoners in 2017 Table 11, reporting data for December 31, 2017, and youth in adult jails from Jail Inmates in 2017 Table 3, reporting data for the last weekday in June, 2017. The number of youth reported in Indian Country facilities comes from the Bureau of Justice Statistics report Jails in Indian Country, 2016 Appendix Table 4, reporting data for June 30, 2016. For more information on the geography of the juvenile system, see the Youth First Initiative.
- Immigration detention: The February 22, 2020 count of 39,000 in Immigration and Customs Enforcement (ICE) detention comes from ICE’s Currently Detained Population spreadsheet.18 The count of 3,600 youth in Office of Refugee Resettlement (ORR) custody comes from the Unaccompanied Alien Children (UAC) Program Fact Sheet, reporting the population as of January 30, 2020. Our estimates of how many ICE detainees are held in federal, private, and local facilities come from our analysis of a comprehensive ICE detention facility list from November 2017, obtained by the National Immigrant Justice Center. 7% were in federal Service Processing Centers, 66% in private contract facilities, and 27% in city and county operated jails.
- Justice-related involuntary commitment:
- State psychiatric hospitals (people committed to state psychiatric hospitals by courts after being found “not guilty by reason of insanity” (NGRI) or, in some states, “guilty but mentally ill” (GBMI) and others held for pre-trial evaluation or for treatment as “incompetent to stand trial” (IST)): These counts are from pages 92, 99, and 104 of the August 2017 NRI report, Forensic Patients in State Psychiatric Hospitals: 1999-2016, reporting data from 37 states for 2014. The categories NGRI and GBMI are combined in this data set, and for pre-trial, we chose to combine pre-trial evaluation and those receiving services to restore competency for trial, because in most cases, these indicate people who have not yet been convicted or sentenced. This is not a complete view of all justice-related involuntary commitments, but we believe these categories and these facilities capture the largest share.
- Civil detention and commitment: (At least 20 states and the federal government operate facilities for the purposes of detaining people convicted of sexual crimes after their sentences are complete. These facilities and the confinement there are technically civil, but in reality are quite like prisons. People under civil commitment are held in custody continuously from the time they start serving their sentence at a correctional facility through their confinement in the civil facility.) The civil commitment counts come from an annual survey conducted by the Sex Offender Civil Commitment Programs Network shared by SOCCPN President Shan Jumper. Counts for most states are from the 2019 survey, but for states that did not participate in 2019, we included the most recent figures available: Nebraska, South Carolina, and Pennsylvania’s counts are from 2018, the BOP’s count is from 2017, and North Dakota’s is from 2016. .
- Territorial prisons (correctional facilities in the U.S. Territories of American Samoa, Guam, and the U.S. Virgin Islands, and U.S. Commonwealths of Northern Mariana Islands and Puerto Rico): Prisoners in 2017 Table 20, reporting data for December 31, 2017.
- Indian Country (correctional facilities operated by tribal authorities or the U.S. Department of the Interior’s Bureau of Indian Affairs): Jails in Indian Country, 2016 Table 1, reporting data for June 30, 2016.
- Military: Prisoners in 2017 Tables 18 (for total population) and 19 (for offense types) reporting data as of December 31, 2017.
- Probation and parole: Our counts of the number of people on probation and parole are from the Bureau of Justice Statistics report Correctional Populations in the United States, 2016 Table 1, Table 5 and Appendix Table 1, reporting data for December 31, 2016, and were adjusted to ensure that people with multiple statuses were counted only once in their most restrictive category. (At the time of publication, newer data collected in 2016 was expected but not yet available.) For readers interested in knowing the total number of people on parole and probation, ignoring any double-counting with other forms of correctional control, there are 874,800 people on parole and 3,673,100 people on probation.
- Private facilities: Except for local jails (which we will explain in the “Adjustments to avoid double counting” section below) our identification of the number of people held in private facilities was straightforward:
- For both state prisons and the federal Bureau of Prisons, we relied on the counts of the number of people in “privately operated facilities” and “community corrections centers” in Appendix Table 3 in Correctional Populations in the United States, 2016 .
- For the U.S. Marshals Service we used the FOIA response reporting the one-day October 2018 population.
- For youth, we used the 2017 Census of Juveniles in Residential Placement, which provides a breakdown of the number of youth held in publicly and privately operated facilities
- For immigration detention, we relied on the work of the Tara Tidwell Cullen of the National Immigrant Justice Center
Adjustments to avoid double counting
To avoid counting anyone twice, we performed the following adjustments:
- To avoid anyone in immigration detention being counted twice, we removed the 27% (10,439) of the Immigration and Custom Enforcement (ICE) detained population that is held under contract in local jails from the total jail population. We removed 34.1% of these ICE detainees from the jail convicted population and the balance from the unconvicted population. (We based these percentages of the population held for ICE on our analysis of the Profile of Jail Inmates, 2002, as detailed in our report, Era of Mass Expansion: Why State Officials Should Fight Jail Growth.)
- To avoid anyone in local jails on behalf of state or federal prison authorities from being counted twice, we removed the 80,917 people — cited in Table 17 of Prisoners in 2017 — confined in local jails on behalf of federal or state prison systems from the total jail population and from the numbers we calculated for those in local jails that are convicted. To avoid those being held by the U.S. Marshals Service from being counted twice, we removed 23,552 Marshals detainees from the jail total that we found through our own analysis of the 2017 Annual Survey of Jails dataset. We removed 75.9% of these people held in jails for the Marshals from the jail convicted population, and the balance from the jail unconvicted population. (Again, we based these percentages on our analysis of the Profile of Jail Inmates, 2002.)
- Because we removed ICE detainees and people under the jurisdiction of federal and state authorities from the jail population, we had to recalculate the offense distribution reported in Profile of Jail Inmates, 2002 who were “convicted” or “not convicted” without the people who reported that they were being held on behalf of state authorities, the Federal Bureau of Prisons, the U.S. Marshals Service, or U.S. Immigration and Naturalization Service/U.S. Immigration and Customs Enforcement (ICE).19 Our definition of “convicted” was those who reported that they were “To serve a sentence in this jail,” “To await sentencing for an offense,” or “To await transfer to serve a sentence somewhere else.” Our definition of not convicted was “To stand trial for an offense,” “To await arraignment,” or “To await a hearing for revocation of probation/parole or community release.”
- For our analysis of people held in private jails for local authorities, we needed to use a measure that avoided double counting people who were held in private jails for other agencies (described in “private facilities,” above). This is a problem because of many private facilities that hold people for local jails also hold people for other agencies. (In fact, the majority of people confined in private jails are held for federal and state authorities.) We therefore used the Census of Jails 2013 (private facilities have “8” as the third digit of the FACID variable) and we removed the number of people held for the Marshals Service, Immigration and Customs Enforcement, Bureau of Indian Affairs, other federal authorities, state prison systems, and those under tribal hold. After these adjustments, we determined that there were 6,048 people held by private facilities for local authorities.
How to link to specific images and sections
To help readers link to specific images in this report, we created these special urls:
- How many people are locked up in the United States?
- https://www.prisonpolicy.org/reports/pie2020.html#slideshows/slideshow1/1
- 76% of people held by jails are not convicted of any crime
- https://www.prisonpolicy.org/reports/pie2020.html#slideshows/slideshow1/2
- Despite reforms, drug offenses are still a defining characteristic of the federal system
- https://www.prisonpolicy.org/reports/pie2020.html#slideshows/slideshow1/3
- Beyond “federal prison,” multiple agencies and thousands of local facilities confine people for the federal government
- https://www.prisonpolicy.org/reports/pie2020.html#slideshows/slideshow1/4
- Pretrial Detention
- https://www.prisonpolicy.org/reports/pie2020.html#slideshows/slideshow2/1
- Pretrial policies drive jail growth
- https://www.prisonpolicy.org/reports/pie2020.html#slideshows/slideshow2/2
- Local Jails: The real scandal is the churn
- https://www.prisonpolicy.org/reports/pie2020.html#slideshows/slideshow2/3
- Why are so many people detained in jails before trial? They’re not wealthy enough to afford money bail.
- https://www.prisonpolicy.org/reports/pie2020.html#slideshows/slideshow2/4
- 76% of people held by jails are not convicted of any crime
- https://www.prisonpolicy.org/reports/pie2020.html#slideshows/slideshow2/5
- 1 in 5 incarcerated people is locked up for a drug offense
- https://www.prisonpolicy.org/reports/pie2020.html#slideshows/slideshow3/1
- There are over 1 million drug possession arrests each year
- https://www.prisonpolicy.org/reports/pie2020.html#slideshows/slideshow3/2
- Some states have largely ended the War on Drugs. Other states, no so much.
- https://www.prisonpolicy.org/reports/pie2020.html#slideshows/slideshow3/3
- Private prisons are a small slice of the pie
- https://www.prisonpolicy.org/reports/pie2020.html#privateimage
- Technical violations are the main reason for incarceration of people on probation and parole
- https://www.prisonpolicy.org/reports/pie2020.html#slideshows/slideshow4/1
- Contrary to myth, people incarcerated for violent offenses and released are least likely to be arrested again
- https://www.prisonpolicy.org/reports/pie2020.html#slideshows/slideshow4/2
- Most states track and publish just one measure of post-release recidivism
- https://www.prisonpolicy.org/reports/pie2020.html#recidivism_measures
- Very few states track and publish any recidivism data for people on probation
- https://www.prisonpolicy.org/reports/pie2020.html#recidivism_measures
- Most confined youth are held for nonviolent offenses, or no crime at all.
- https://www.prisonpolicy.org/reports/pie2020.html#slideshows/slideshow5/1
- Almost 70,000 people are confined for immigration reasons
- https://www.prisonpolicy.org/reports/pie2020.html#slideshows/slideshow5/2
- Psychiatric facilities confine 22,000 justice-involved people every day
- https://www.prisonpolicy.org/reports/pie2020.html#slideshows/slideshow5/3
- Mass incarceration directly impacts millions of people
- https://www.prisonpolicy.org/reports/pie2020.html#directlyimpacted
- Incarceration is just one piece of the much larger system of correctional control
- https://www.prisonpolicy.org/reports/pie2020.html#slideshows/slideshow6/1
- Racial and ethnic disparities in correctional facilities
- https://www.prisonpolicy.org/reports/pie2020.html#slideshows/slideshow6/2
- Women’s incarceration patterns are very different than men’s
- https://www.prisonpolicy.org/reports/pie2020.html#slideshows/slideshow6/3
- Women’s state prison populations have grown faster than men’s
- https://www.prisonpolicy.org/reports/pie2020.html#slideshows/slideshow6/4
- Most people in prisons are poor, and the poorest are women and people of color
- https://www.prisonpolicy.org/reports/pie2020.html#slideshows/slideshow6/5
- 1 out of 5 incarcerated people in the world is incarcerated in the U.S.
- https://www.prisonpolicy.org/reports/pie2020.html#slideshows/slideshow6/6
To help readers link to specific report sections or paragraphs, we created these special urls:
- Offense categories might not mean what you think
- https://www.prisonpolicy.org/reports/pie2020.html#offensecategories
- Lessons from the smaller “slices”: Youth, immigration, and involuntary commitment
- https://www.prisonpolicy.org/reports/pie2020.html#smallerslices
- Five myths about mass incarceration
- https://www.prisonpolicy.org/reports/pie2020.html#myths
- The first myth: Releasing “nonviolent drug offenders” would end mass incarceration
- https://www.prisonpolicy.org/reports/pie2020.html#firstmyth
- The second myth: Private prisons are the corrupt heart of mass incarceration
- https://www.prisonpolicy.org/reports/pie2020.html#secondmyth
- The third myth: Prisons are “factories behind fences” that exist to provide companies with a huge slave labor force
- https://www.prisonpolicy.org/reports/pie2020.html#thirdmyth
- The fourth myth: People in prison for violent or sexual crimes are too dangerous to be released
- https://www.prisonpolicy.org/reports/pie2020.html#fourthmyth
- The fifth myth: Expanding community supervision is the best way to reduce incarceration
- https://www.prisonpolicy.org/reports/pie2020.html#fifthmyth
- The high costs of low-level offenses
- https://www.prisonpolicy.org/reports/pie2020.html#lowlevel
- Probation & parole violations and “holds” lead to unnecessary incarceration
- https://www.prisonpolicy.org/reports/pie2020.html#holds
- Misdemeanors: Minor offenses with major consequences
- https://www.prisonpolicy.org/reports/pie2020.html#misdemeanors
- “Low-level fugitives” live in fear of incarceration for missed court dates and unpaid fines
- https://www.prisonpolicy.org/reports/pie2020.html#benchwarrants
- Offense categories might not mean what you think
- https://www.prisonpolicy.org/reports/pie2020.html#offensecategories
- Beyond the “Whole Pie”: Community supervision, poverty, and race and gender disparities
- https://www.prisonpolicy.org/reports/pie2020.html#community
- Recidivism: A slippery statistic
- https://www.prisonpolicy.org/reports/pie2020.html#recidivism_measures
- Each paragraph is also numbered, so you can use urls in this format:
- https://www.prisonpolicy.org/reports/pie2020.html#paragraph1
https://www.prisonpolicy.org/reports/pie2020.html#paragraph2
https://www.prisonpolicy.org/reports/pie2020.html#paragraph3
etc…
Acknowledgments
All Prison Policy Initiative reports are collaborative endeavors, but this report builds on the successful collaborations of the 2014, 2015, 2016 and 2017, 2018, and 2019 versions. For this year’s report, the authors are particularly indebted to Heidi Altman of the National Immigrant Justice Center for feedback and research pointers on immigration detention, Emily Widra and Roxanne Daniel for research support, Wanda Bertram and Alexi Jones for their helpful edits, and Shan Jumper for sharing updated civil detention and commitment data. Any errors or omissions, and final responsibility for all of the many value judgements required to produce a data visualization like this, however, are the sole responsibility of the authors.
We thank the John D. and Catherine T. MacArthur Foundation Safety and Justice Challenge for their support of our research into the use and misuse of jails in this country. We also thank Public Welfare Foundation and each of our individual donors who give us the resources and the flexibility to quickly turn our insights into new movement resources.
About the authors
Wendy Sawyer is the Research Director at the Prison Policy Initiative. She is the author of Youth Confinement: The Whole Pie, The Gender Divide: Tracking women’s state prison growth, and the 2016 report Punishing Poverty: The high cost of probation fees in Massachusetts. She recently co-authored Arrest, Release, Repeat: How police and jails are misused to respond to social problems with Alexi Jones. In addition to these reports, Wendy frequently contributes briefings on recent data releases, academic research, women’s incarceration, pretrial detention, probation, and more.
Peter Wagner is an attorney and the Executive Director of the Prison Policy Initiative. He co-founded the Prison Policy Initiative in 2001 in order to spark a national discussion about the negative side effects of mass incarceration. He is a co-author of a landmark report on the dysfunction in the prison and jail phone market, Please Deposit All of Your Money. Some of his most recent work includes Following the Money of Mass Incarceration and putting each state’s overuse of incarceration into the international context in States of Incarceration: The Global Context 2018.
He is @PWPolicy on Twitter.
About the Prison Policy Initiative
The non-profit, non-partisan Prison Policy Initiative was founded in 2001 to expose the broader harm of mass criminalization and spark advocacy campaigns to create a more just society. Alongside reports like this that help the public more fully engage in criminal justice reform, the organization leads the nation’s fight to keep the prison system from exerting undue influence on the political process (a.k.a. prison gerrymandering) and plays a leading role in protecting the families of incarcerated people from the predatory prison and jail telephone industry and the video visitation industry.
Footnotes
The number of state facilities is from Census of State and Federal Correctional Facilities, 2012, the number of federal facilities is from the list of prison locations on the Bureau of Prisons website (as of February 24, 2020), the number of youth facilities is from the Juvenile Residential Facility Census Databook (2016), the number of jails from Mortality in Local Jails, 2000-2016, the number of immigration detention facilities from Immigration and Customs Enforcement’s Dedicated and Non Dedicated Facility List (as of February 2020), and the number of Indian Country jails from Jails in Indian Country, 2016. We aren’t currently aware of a good source of data on the number of the facilities of the other types. ↩
10.6 million jail admissions includes multiple admissions of some individuals; it does not mean 10.6 million unique individuals cycling through jails in a year. According to a presentation, The Importance of Successful Reentry to Jail Population Growth [Powerpoint] given at The Jail Reentry Roundtable, Bureau of Justice Statistics statistician Allen Beck estimates that of the 12-12.6 million jail admissions in 2004-2005, 9 million were unique individuals. More recently, we analyzed the 2017 National Survey on Drug Use and Health, which includes questions about whether respondents have been booked into jail; from this source, we estimate that at least 4.9 million unique individuals were arrested and booked into jails in 2017. ↩
The local jail population in the main pie chart (630,692) reflects only the population under local jurisdiction; it excludes the people being held in jails for other state and federal agencies. The population under local jurisdiction is smaller than the population (745,600) physically located in jails on an average day in 2017, often called the custody population. (For this distinction, see the second image in the first slideshow above.) The “not convicted” population is driving jail growth. ↩
The data doesn’t show how many people are convicted of drug law violations and are held in territorial prisons or Indian Country jails. ↩
In 2018, there were 1,654,282 drug arrests in the U.S., the vast majority of which (86%) were for drug possession or use rather than for sale or manufacturing. See Crime in the United States 2018 Table 29 and the Arrests for Drug Abuse Violations table. ↩
For an explanation of how we calculated this, see “private facilities” in the methodology. ↩
At yearend 2017, six states held at least 20% of those incarcerated under the state prison system’s jurisdiction in local jail facilities: Kentucky (29%), Louisiana (55%), Mississippi (27%), Utah (22%), Tennessee (24%), and Virginia (20%). For more on how renting jail space to other agencies skews priorities and fuels jail expansion, see the second part of our report Era of Mass Expansion. ↩
According to the most recent National Correctional Industries Association survey that is publicly available, an average of 6% of all people incarcerated in state prisons work in state-owned prison industries. However, the portion of incarcerated people working in these jobs ranges from 1% (in Connecticut) to 18% (in Minnesota). For a description of other kinds of prison work assignments, see our 2017 analysis. ↩
According to the Bureau of Justice Statistics report Probation and Parole in the United States, 2016, Appendix Table 3, 98,698 adults exited probation to incarceration under their current sentence; Appendix Table 7 shows 69,855 adults were returned to incarceration from parole with a revocation. The number of people incarcerated for technical violations may be much higher, however, since nearly 78,000 people exiting probation and parole to incarceration did so for “other/unknown” reasons, and some states did not report data. ↩
The federal government defines the hierarchy of offenses with felonies higher than misdemeanors. And “[w]ithin these levels, … the hierarchy from most to least serious is as follows: homicide, rape/other sexual assault, robbery, aggravated assault, burglary, larceny/motor vehicle theft, fraud, drug trafficking, drug possession, weapons offense, driving under the influence, other public-order, and other.” See page 13 of Recidivism of Prisoners Released in 1994. ↩
The felony murder rule has also been applied when the person who died was a participant in the crime. For example, in some jurisdictions, if one of the bank robbers is killed by the police during a chase, the surviving bank robbers can be convicted of felony murder of their colleague. For example see People v. Hudson, 222 Ill. 2d 392 (Ill. 2006) and People v. Klebanowski, 221 Ill. 2d 538 (Ill. 2006). According to a recent New York Times article, the U.S. is currently the only country still using the felony murder rule; other British common law countries abolished it years ago. A small but growing number of states have abolished it at the state level. ↩
In 2017, more than half (61%) of juvenile status offense cases were for truancy. 9% were for being “ungovernable” and 9% were for running away. ↩
As of 2016, nearly 9 out of 10 people incarcerated for immigration offenses by the federal Bureau of Prisons were there for illegal entry and reentry. ↩
Most children in ORR custody are held in shelters. A small number are in secure juvenile facilities or in short-term or long-term foster care. With the exception of those in foster homes, these children are not free to come and go, and they do not participate in community life (e.g. they do not attend community schools). Their behaviors and interactions are monitored and recorded; any information gathered about them in ORR custody can be used against them later in immigration proceedings. And while the majority of these children came to the U.S. without a parent or legal guardian, those who were separated from parents at the border are, like ICE detainees, confined only because the U.S. has criminalized unauthorized immigration, even by persons lawfully seeking asylum. ↩
Our report on the pre-incarceration incomes of those imprisoned in state prisons, Prisons of Poverty: Uncovering the pre-incarceration incomes of the imprisoned, found that, in 2014 dollars, incarcerated people had a median annual income that is 41% less than non-incarcerated people of similar ages. Our analysis of similar jail data in Detaining the Poor: How money bail perpetuates an endless cycle of poverty and jail time found that people in jail have even lower incomes, with a median annual income that is 54% less than non-incarcerated people of similar ages. ↩
Even outside of prisons and jails, the elaborate system of criminal justice system fines and fees feeds a cycle of poverty and punishment for many poor Americans. ↩
This is the most recent data available until the Bureau of Justice Statistics begins administering the next Survey of Inmates in Local Jails. ↩
Notably, the number of people admitted to immigration detention in a year is much higher than the population detained on a particular day. The immigration detention system took in 510,854 people during the course of fiscal year 2019. Also, readers of our past “whole pie” reports may notice that the ICE detention population has declined dramatically over the past year. This is not because ICE is moving away from detaining people, but rather because the policies turning asylum seekers away at the southern border (the MPP program, the expedited deportation programs, and the “safe third country” programs) mean that far fewer people are making it into the country to be detained in the first place. ↩
Responses to whether someone reported being held for an authority besides a local jail can be found in V113, or V115-V118 in the Survey of Inmates in Local Jails, 2002 Codebook. ↩


