Families with loved ones incarcerated in New York State prisons pay some of the lowest phone fees in the entire country. Meanwhile, those with loved ones in the state’s county jails have some of the highest phone costs. How can this be?
These high commissions translate to high costs for families. We found that in 2019, a 15-minute phone call from the average jail in New York was more expensive than the average jail phone call in 43 states. But it doesn’t have to be this way. If individual New York counties pledged to waive the income they earn off the backs of their poorest residents, the cost of a 15-minute phone call would instantly drop significantly. And if the state stepped in with legislation requiring jail phone contracts to be negotiated on the basis of the lowest cost to the consumer (like it already requires of prisons), the rates would go down even further.
In fact, there are several solutions that would reduce phone costs for families of jailed New Yorkers:
This analysis was made possible thanks to detailed public record requests made by George Dahlbender. This collection was supplemented by Andrea Fenster; Worth Rises also generously shared three additional contracts. Finally, although Schenectady and Sullivan counties did not respond to public record requests, we were able to find recent copies of their contracts on Muckrock.com, a nonprofit that helps people and organizations file and share record requests.
In the following four appendix tables, we have highlighted key information from the contracts and other documents that counties provided. We are also providing links to the contracts themselves so that journalists and other advocates can hold the counties accountable:
This appendix table includes the commissions each county receives for phone calls and other services. Here, we have also provided access to the actual county contracts (and commission reports, where available) to other researchers and advocates. As you can see, the commission rate in a given county is often much higher for phones than for tablets and video services; as we’ve discussed in this article, providers often win contracts by paying huge phone commissions to the counties, while ensuring their own profits via low commissions on bundled services.
|
Phone |
|
Tablet |
|
Video |
Notes |
| County |
Provider |
Phone Commission Percent |
Additional Payments |
Guaranteed Minimum Payments |
Cite in
Document |
|
Provider |
Commission |
Cite in
Document |
Is commission contingent on 80% of the population having “reasonable access” to tablets? |
|
Provider |
Commission |
Cite in
Document |
| Albany |
Securus |
86% |
One-time $115,000 signing bonus |
Pre-paid commissions of $1,200,000 in the first year, and $600,000 in each of the second and third year |
Agreement between the County of Albany and Securus Technologies, Inc. For Inmate Phone and Communication System at the Albany County Correctional Facility para. 3.1 – 3.2 |
|
Securus |
10% for entertainment, 20% for E-Messaging |
Agreement between the County of Albany and Securus Technologies, Inc. For Inmate Phone and Communication System at the Albany County Correctional Facility para. 3.4 – 3.5 |
No |
|
Securus |
20% |
Agreement between the County of Albany and Securus Technologies, Inc. For Inmate Phone and Communication System at the Albany County Correctional Facility para. 3.3 |
|
| Allegany |
GTL |
Unknown (did not provide contract) |
Unknown (did not provide contract) |
Unknown (did not provide contract) |
Did not provide contract |
|
Unknown (did not provide contract) |
Unknown (did not provide contract) |
Did not provide contract |
Unknown (did not provide contract) |
|
Unknown (did not provide contract) |
Unknown (did not provide contract) |
Did not provide contract |
|
| Broome |
GTL |
44% |
Contract does not outline additional payments |
Contract does not guarantee minimum payment |
GTL Inmate Telephone Service Agreement p. 2, para. 4 |
|
GTL |
20% of per-minute rate |
Amendment Exhibit A p. 4, para. 8 |
Yes |
|
GTL |
20% |
Amendment Exhibit A p. 4, para. 8 |
|
| Cattaraugus |
GTL |
55% |
Contract does not outline additional payments |
Contract does not guarantee minimum payment |
GTL Inmate Telephone Service Agreement p. 1-2 para. 4 |
|
GTL |
20% of per-minute rate |
Amendment Exhibit A p. 4, para. 8 |
Yes |
|
GTL |
20% |
Amendment Exhibit A p. 4, para. 8 |
|
| Cayuga |
GTL |
55% |
$1.60 for each Collect2Card call and $0.30 for each Connect2Phone call |
Contract does not guarantee minimum payment |
GTL Inmate Telephone Service Agreement p. 1-2 para. 4 |
|
Unknown (did not provide contract) |
Unknown (did not provide contract) |
Did not provide contract |
Unknown (did not provide contract) |
|
Unknown (did not provide contract) |
Unknown (did not provide contract) |
Did not provide contract |
|
| Chautauqua |
GTL |
48% |
Contract does not outline additional payments |
Contract does not guarantee minimum payment |
GTL Inmate Telephone Service Agreement p. 2 para. 4 |
|
Unknown (did not provide contract) |
Unknown (did not provide contract) |
Did not provide contract |
Unknown (did not provide contract) |
|
GTL |
48% |
GTL Inmate Telephone Service Agreement p. 2 para. 4 |
|
| Chemung |
GTL |
55% |
“…four equal installments of $11,250 at the beginning of each contract year…” |
Contract does not guarantee minimum payment |
GTL Inmate Telephone Service Amendment p. 1 para. 2 |
|
Unknown (did not provide contract) |
Unknown (did not provide contract) |
Did not provide contract |
Unknown (did not provide contract) |
|
Unknown (did not provide contract) |
Unknown (did not provide contract) |
Did not provide contract |
|
| Chenango |
GTL |
Unknown (did not provide contract) |
Unknown (did not provide contract) |
Unknown (did not provide contract) |
Did not provide contract |
|
Unknown (did not provide contract) |
Unknown (did not provide contract) |
Did not provide contract |
Unknown (did not provide contract) |
|
Unknown (did not provide contract) |
Unknown (did not provide contract) |
Did not provide contract |
|
| Clinton |
GTL |
44% |
Contract does not outline additional payments |
Contract does not guarantee minimum payment |
GTL Inmate Telephone Service Agreement p. 2 para. 4 |
|
GTL |
25% of per-minute rate |
Amendment Exhibit A Service Schedule p. 4, para. 8 |
Yes |
|
GTL |
25% |
Amendment Exhibit A Service Schedule p. 4, para. 8 |
|
| Columbia |
GTL |
Contract mentions these services, but does not specify any commission amount |
Contract mentions phone services, but does not specify any commission amount |
Contract mentions these services, but does not specify any commission amount |
GTL Master Services Agreement p. 1 para. 1 Columbia Dahlbender Archive p. 4 |
|
Unknown (did not provide contract) |
Unknown (did not provide contract) |
Did not provide contract |
Unknown (did not provide contract) |
|
Unknown (did not provide contract) |
Unknown (did not provide contract) |
Did not provide contract |
The service schedule that is referenced in the contract was not included in the county’s response to a FOIL request. |
| Cortland |
GTL |
55% |
“… Premise Provider is compensated on a per call basis, depending on the program implemented, either at a flat amount per call, or on a percentage of the call charge.” |
Contract does not guarantee minimum payment |
GTL Inmate Telephone Service Agreement p. 1-2 para. 4 |
|
GTL |
15% of per-minute rate |
Amendment Exhibit A p. 4, para. 8 |
Yes |
|
Unknown (did not provide contract) |
Unknown (did not provide contract) |
Did not provide contract |
|
| Delaware |
GTL |
80% |
Contract does not outline additional payments |
Contract does not guarantee minimum payment |
Amendment p. 1 |
|
GTL |
0% |
Amendment Exhbibit A p. 1-2 para. 6 |
Not applicable (indicates there is no commission on service) |
|
GTL |
– |
Amendment Exhbibit A p. 1-2 para. 6 |
|
| Dutchess |
GTL |
55% |
Contract does not outline additional payments |
Contract does not guarantee minimum payment |
GTL Services Agreement p. 2 para. 4 |
|
GTL |
“Company will pay Premise Provider a commission every month based on average monthly revenue per tablet for that month from purchased content (“Content Revenue”)…Furthermore, Company will not owe or pay any commission on the first Eighty Nine Thousand Seven Hundred Dollars ($89,700), in Content Revenue collected.” Commissions range from 0% to 70%. |
Agreement Exhibit B p. 12-13 para. V.a. |
No |
|
Unknown (did not provide contract) |
Unknown (did not provide contract) |
Did not provide contract |
|
| Erie |
ICSolutions |
63.50% |
$70,000 annual Technology Fund, funded on a monthly basis |
Contract does not guarantee minimum payment |
Amendment No. 2 to the Agreement for Inmate Telephone System p. 2 para. 5 |
|
None |
Not available at facility |
FOIA Response p. 1 |
Not applicable (service not available at facility) |
|
ICSolutions |
50% on all service fees |
Amendment No. 2 p. 2 para. 5 |
|
| Essex |
GTL |
80% |
Contract does not outline additional payments |
Contract does not guarantee minimum payment |
GTL Master Services Agreement p. 8 |
|
GTL |
20% of per-minute rate |
GTL Master Services Agreement p. 11 |
Yes |
|
GTL |
20% |
GTL Master Services Agreement p. 11 |
|
| Franklin |
GTL |
80% |
Contract does not outline additional payments |
Contract does not guarantee minimum payment |
Amendment p. 1 para. 1 |
|
GTL |
20% of per-minute rate |
Exhibit A p. 3 para. 8 |
Yes |
|
GTL |
20% |
Exhibit A p. 3 para. 8 |
|
| Fulton |
GTL |
80% |
$1.60 for each Collect2Card call and $0.30 for each Connect2Phone call |
Contract does not guarantee minimum payment |
Amendment p. 1 para. 2 |
|
Trinity Services Group |
Contract mentions these services, but does not specify any commission amount |
Trinity Tablet Agreement p. 1-2 |
Unknown (Contract does not specify any commission amount) |
|
Unknown (did not provide contract) |
Unknown (did not provide contract) |
Did not provide contract |
|
| Genesee |
Securus |
80% |
Contract does not outline additional payments |
Contract does not guarantee minimum payment |
RFP Proposal p. 452 |
|
Securus |
20% for entertainment |
RFP Proposal p. 452 |
No |
|
Unknown (did not provide contract) |
Unknown (did not provide contract) |
Did not provide contract |
|
| Greene |
GTL |
44% |
Contract does not outline additional payments |
Contract does not guarantee minimum payment |
Greene County Response p. 3/Agreement p. 3 para. 4 |
|
Unknown (did not provide contract) |
Unknown (did not provide contract) |
Did not provide contract |
Unknown (did not provide contract) |
|
Unknown (did not provide contract) |
Unknown (did not provide contract) |
Did not provide contract |
|
| Hamilton |
Frontier Communications |
0% |
Contract did not outline additional payments |
Contract does not guarantee minimum payment |
FOIL Response |
|
None |
Not available at facility |
FOIL Response |
Not applicable |
|
None |
Not available at facility |
FOIL Response |
In response to a FOIL request, Hamilton County stated that phone calls are free at the county jail and did not provide contracts. |
| Herkimer |
GTL |
80% |
$1.60 for each Collect2Card call and $0.30 for each Connect2Phone call |
Contract does not guarantee minimum payment |
Report and Resolution No. 126 p. 1 |
|
Unknown (did not provide contract) |
Unknown (did not provide contract) |
FOIL Response |
Unknown (did not provide contract) |
|
Unknown (did not provide contract) |
Unknown (did not provide contract) |
FOIL Response |
Herkimer County responded that it “has no records which meet the specifications of your request” relating to tablet or video services. |
| Jefferson |
GTL |
80% |
Contract does not outline additional payments |
Contract does not guarantee minimum payment |
Amendment p. 1 para. 1 |
|
Unknown (did not provide contract) |
Unknown (did not provide contract) |
Did not provide contract |
Unknown (did not provide contract) |
|
Unknown (did not provide contract) |
Unknown (did not provide contract) |
Did not provide contract |
|
| Lewis |
GTL |
55% |
“Company shall also encumber Twenty-five percent (25%) of the Gross Reveneue billed or prepaid for inmate telephone calls covered by this Agreement, and issue a monthly check to the Premise Provider for this amount in the form of a technology grant” |
Contract does not guarantee minimum payment |
Amendment p. 1 para. 3 |
|
GTL |
20% of per-minute rate |
Tablet Services Schedule p. 3 |
Yes |
|
GTL |
20% |
Tablet Services Schedule p. 3 |
|
| Livingston |
GTL |
80% |
Contract does not outline additional payments |
Contract does not guarantee minimum payment |
Amendment p. 1 para. 1 |
|
GTL |
20% |
Amendment p. 1 para. 2 |
No |
|
GTL |
20% (included in tablets) |
Amendment p. 1 para. 2 |
|
| Madison |
GTL |
80% |
$1.60 for each Collect2Card call and $0.30 for each Connect2Phone call |
Contract does not guarantee minimum payment |
Resolution 19-488 p. 1 |
|
GTL |
20% of per-minute rate |
Services Schedule p. 3-4 para. 8 |
Yes |
|
GTL |
20% |
Services Schedule p. 3-4 para. 8 |
|
| Monroe |
Securus |
78.50% |
Contract does not outline additional payments |
Contract does not guarantee minimum payment |
Resolution No. 31 of 2020 p. 1 Section 1 |
|
Securus |
20% on premium tablet content/ 25% eMessaging |
Resolution No. 31 of 2020 p. 1 Section 1 |
No |
|
Securus |
25% |
Resolution No. 31 of 2020 p. 1 Section 1 |
|
| Montgomery |
GTL |
44% |
Contract does not outline additional payments |
Contract does not guarantee minimum payment |
GTL Inmate Telephone Service Agreement p. 2 para. 4 |
|
Unknown (did not provide contract) |
Unknown (did not provide contract) |
FOIL Response |
Unknown (did not provide contract) |
|
Unknown (did not provide contract) |
Unknown (did not provide contract) |
FOIL Response |
Montgomery County responded on 9/30/2020 that they did not have a current contract. We obtained a contract that is expired, but automatically renews, from Worth Rises. As of 3/12/2021, rates for Montgomery County were listed on the GTL website. |
| Nassau |
GTL |
54% |
$100,000 one-time sign-on payment |
Contract does not guarantee minimum payment |
Amendment No. 1 p. 1, Use and Occupancy p. 2 para. 4 |
|
Unknown (did not provide contract) |
Unknown (did not provide contract) |
FOIL Response |
Unknown (did not provide contract) |
|
Unknown (did not provide contract) |
Unknown (did not provide contract) |
FOIL Response |
Nassau County responded that “no records exist” relating to tablet or video services. |
| Niagara |
GTL |
80% |
$50,000 technology grant in both 2017 and 2018 |
$299,000 per year |
Amendment p. 1 para. 2 |
|
Unknown (did not provide contract) |
Unknown (did not provide contract) |
Did not provide contract |
Unknown (did not provide contract) |
|
GTL |
Contract does not seem to promise a commission |
Amendment p. 1, para. 3 |
|
| Oneida |
GTL |
45% |
$50,000 bonus in 2010 paid over 3 annual installments |
Contract does not guarantee minimum payment |
GTL Inmate Telephone Service Agreement p. 2 para. 4 |
|
Trinity |
10% |
Amendment to the Commissary Services Agreement p. 2 para. 6 |
No |
|
Trinity |
10% (included with tablets) |
Amendment to the Commissary Services Agreement p. 2 para. 6 |
In response to a request for the current contracts on 7/13/2020, the county provided a contract with Trinity for tablets and phones which expired on 4/20/2020. We assumed that this is the current provider. However, it is possible that the county has switched tablet and video service providers to Telmate, which is owned by GTL. Telmate’s website, as of 3/12/2021, lists that it provides tablets and video here. |
| Onondaga |
ICSolutions |
65% |
$350,000.00 Technology Grant/Signing Bonus |
Contract does not guarantee minimum payment |
ICSolutions Contract p. 398 |
|
Unknown (did not provide contract) |
Unknown (did not provide contract) |
Did not provide contract |
Unknown (did not provide contract) |
|
ICSolutions |
65% |
ICSolutions Contract p. 398 |
|
| Ontario |
Securus |
65% |
Contract does not outline additional payments |
“Such compensation will be paid monthly with a minimum annual guarantee amount of $75,000. After the first 12 months and each year thereafter during the Term, the minimum annual guarantee will be 80% of the previous 12 month’s actual commissions earned” |
Agreement Schedule p. 7 |
|
Securus |
20% of tablet rentals and eMessaging |
Agreement Schedule p. 10, 11 |
No |
|
Securus |
Unknown (Contract mentions these services, but does not specify any commission amount) |
Agreement Schedule p. 12, Securus Video Visitation Schedule p. 1 |
|
| Orange |
GTL |
50% |
Contract does not outline additional payments |
Contract does not guarantee minimum payment |
Inmate Telephone Service Agreement p. 2 para 5 |
|
Unknown (did not provide contract) |
Unknown (did not provide contract) |
FOIL Response |
Unknown (did not provide contract) |
|
Unknown (did not provide contract) |
Unknown (did not provide contract) |
FOIL Response |
Orange County responded “N/A/ no such record” to the request for records relating to tablet and video services. GTL’s website lists that it provides video services as of 3/12/2021. |
| Orleans |
ICSolutions |
Unknown (Contract mentions these services, but does not specify any commission amount) |
Unknown (Contract mentions these services, but does not specify commission details) |
Unknown (Contract mentions these services, but does not specify commission details) |
Resolution No. 208-519 p. 1 |
|
None |
Not available at facility |
FOIL Response |
Not applicable (service not available at facility) |
|
ICSolutions |
Unknown (Contract mentions these services, but does not specify any commission amount) |
Resolution No. 208-519 p. 1 |
Orleans County provided some documents, but did not provide agreements with service providers. The response stated that the records requested “are trade secrets or are submitted to agency by a commercial enterprise or derived from information obtained from a commercial enterprise and which, if disclosed, would cause substantial injury to the competitive position of the subject enterprise (POL 87(2)(d)).” |
| Oswego |
GTL |
80% |
$1.60 for each Collect2Card call and $0.30 for each Connect2Phone call |
Contract does not guarantee minimum payment |
Amendment p. 1 para. 2 |
|
GTL |
20% of per-minute rate |
Amendment p. 4 para. 8 |
Yes |
|
GTL |
20% |
Amendment p. 4 para. 8 |
|
| Otsego |
GTL |
44% |
Contract does not outline additional payments |
Contract does not guarantee minimum payment |
GTL Inmate Telephone Service Agreement p. 2 para. 4 |
|
Unknown (did not provide contract) |
Unknown (did not provide contract) |
Did not provide contract |
Unknown (did not provide contract) |
|
Unknown (did not provide contract) |
Unknown (did not provide contract) |
Did not provide contract |
|
| Putnam |
GTL |
80% |
Contract does not outline additional payments |
Contract does not guarantee minimum payment |
Amendment p. 1 para. 1 |
|
GTL |
Unknown (Contract mentions these services, but does not specify any commission amount) |
Amendment p. 1, Service Schedule p. 2 para. 6 |
Unknown |
|
Unknown (did not provide contract) |
Unknown (did not provide contract) |
Did not provide contract |
Only the first page of the service schedule was provided. |
| Rensselaer |
GTL |
55% |
Unknown (Contract mentions these services, but does not specify commission details) |
$200,000 annual guarantee |
Amendment p. 1 para. 1-2 |
|
Unknown (did not provide contract) |
Unknown (did not provide contract) |
Did not provide contract |
Unknown (did not provide contract) |
|
GTL |
Contract does not seem to promise a commission |
Amendment p. 1 para. 3 |
|
| Rockland |
GTL |
Unknown (did not provide contract) |
Unknown (did not provide contract) |
Unknown (did not provide contract) |
Did not provide contract |
|
Unknown (did not provide contract) |
Unknown (did not provide contract) |
FOIL Response |
Unknown (did not provide contract) |
|
Unknown (did not provide contract) |
Unknown (did not provide contract) |
FOIL Response |
Rockland County responded that Corrections does not keep responsive records. We checked service provider websites to see if Rockland County was listed; we found the county on both the GTL and Securus websites. Since GTL is also listed on the Rockland County Sheriff’s Office website, we assume this is the correct phone service provider. |
| Saratoga |
GTL |
80% |
Contract does not outline additional payments |
Contract does not guarantee minimum payment |
Amendment p. 1 para. 1 |
|
Keefe |
15% |
Addendum to Commissary Service Agreement para. 3 |
No |
|
Keefe |
15% (included in tablets) |
Exhibit A Description of Services p. 1 |
|
| Schenectady |
GTL |
55% |
“… Premise Provider is compensated on a per call basis, depending on the program implemented, either at a flat amount per call, or on a percentage of the call charge.” |
Contract does not guarantee minimum payment |
GTL Inmate Telephone Services Agreement p. 1-2 para. 4 |
|
Unknown (did not provide contract) |
Unknown (did not provide contract) |
Did not provide contract |
Unknown (did not provide contract) |
|
Unknown (did not provide contract) |
Unknown (did not provide contract) |
Did not provide contract |
Schenectady County did not provide a response to FOIL requests. However, we obtained a contract from MuckRock.com. In addition, GTL’s website lists Schenectady County as one of the places it serves. |
| Schoharie |
GTL |
55% of billed or prepaid |
“Company shall also encumber Twenty-five percent (25%) of the Gross Reveneue billed or prepaid for inmate telephone calls covered by this Agreement, and issue a monthly check to the Premise Provider for this amount.” |
Contract does not guarantee minimum payment |
Service Schedule p. 2 para. 3 |
|
GTL |
20% of per-minute rate |
Amendment Exhibit A p. 4 para. 8 |
Yes |
|
GTL |
20% |
Amendment Exhibit A p. 4 para. 8 |
|
| Schuyler |
GTL |
55% |
“… Premise Provider is compensated on a per call basis, depending on the program implemented, either at a flat amount per call, or on a percentage of the call charge.” |
Contract does not guarantee minimum payment |
GTL Inmate Telephone Service Agreement p. 2 para. 4 |
|
Unknown (did not provide contract) |
Unknown (did not provide contract) |
Did not provide contract |
Unknown (did not provide contract) |
|
Unknown (did not provide contract) |
Unknown (did not provide contract) |
Did not provide contract |
|
| Seneca |
GTL |
80% |
Contract does not outline additional payments |
Contract does not guarantee minimum payment |
Amendment p. 1 para. 2 |
|
Unknown (did not provide contract) |
Unknown (did not provide contract) |
Did not provide contract |
Unknown (did not provide contract) |
|
Unknown (did not provide contract) |
Unknown (did not provide contract) |
Did not provide contract |
|
| St. Lawrence |
GTL |
80% |
Contract does not outline additional payments |
Contract does not guarantee minimum payment |
Amendment p. 1 para. 1 |
|
GTL |
10% |
Addendum to St. Lawrence County Sheriff’s Office para. 4 |
No |
|
GTL |
Unknown (Contract mentions these services, but does not specify any commission amount) |
Addendum to St. Lawrence County Sheriff’s Office para. 2 |
|
| Steuben |
GTL |
44% |
Contract does not outline additional payments |
Contract does not guarantee minimum payment |
Agreement p. 2 para. 4 |
|
GTL |
0% |
Amendment p. 1 para. 2 |
Not applicable (indicates there is no commission on service) |
|
GTL |
Unknown (Contract mentions these services, but does not specify any commission amount) |
Amendment p. 2 para. 6.a.ii |
|
| Suffolk |
Securus |
86% |
$1.60 per PayNow call + $0.30 per Text2Connect transaction fee |
Contract does not guarantee minimum payment |
Agreement Exhibit E p. 35 para. 6 |
|
Unknown (did not provide contract) |
Unknown (did not provide contract) |
Did not provide contract |
Unknown (did not provide contract) |
|
Unknown (did not provide contract) |
Unknown (did not provide contract) |
Did not provide contract |
|
| Sullivan |
GTL |
56% |
$27,000 one-time signing bonus |
Contract does not guarantee minimum payment |
GTL Inmate Telephone Service Agreement p. 2 para. 4 |
|
Unknown (did not provide contract) |
Unknown (did not provide contract) |
Did not provide contract |
Unknown (did not provide contract) |
|
Unknown (did not provide contract) |
Unknown (did not provide contract) |
Did not provide contract |
Sullivan County did not provide a response to FOIL requests. However, we obtained a recent contract from MuckRock.com. In addition, Securus’s website lists Sullivan County as one of the places it serves. |
| Tioga |
GTL |
80% |
Contract does not outline additional payments |
Contract does not guarantee minimum payment |
Amendment p. 1 para. 3 |
|
None |
Not available at facility |
FOIL Response |
Not applicable (service not available at facility) |
|
None |
Not available at facility |
FOIL Response |
|
| Tompkins |
GTL |
80% |
Contract does not outline additional payments |
Contract does not guarantee minimum payment |
Amendment p. 1 para. 3 |
|
GTL |
20% of per-minute rate |
Amendment Exhibit A p. 4 para. 8 |
Yes |
|
GTL |
20% |
Amendment Exhibit A p. 4 para. 8 |
|
| Ulster |
Securus |
Unknown (did not provide contract) |
Unknown (did not provide contract) |
Unknown (did not provide contract) |
Did not provide contract |
|
Unknown (did not provide contract) |
Unknown (did not provide contract) |
Did not provide contract |
Unknown (did not provide contract) |
|
Unknown (did not provide contract) |
Unknown (did not provide contract) |
Did not provide contract |
|
| Warren |
GTL |
Unknown (Contract mentions these services, but does not specify any commission amount) |
Unknown (Contract mentions these services, but does not specify commission details) |
Unknown (Contract mentions these services, but does not specify commission details) |
Contract Extension Between County of Warren and Global Tel*Link Corporation p. 1 |
|
None |
Not available at facility |
FOIL Response |
Not applicable (service not available at facility) |
|
None |
Not available at facility |
FOIL Response |
Some documentation was provided in response to a FOIL request, although the contract itself was not provided. |
| Washington |
GTL |
80% |
Contract does not outline additional payments |
Contract does not guarantee minimum payment |
Amendment p. 1 para. 1 |
|
GTL |
20% of per-minute rate |
Amendment Exhibit A p. 4 para. 8 |
Yes |
|
GTL |
20% |
Amendment Exhibit A p. 4 para. 8 |
|
| Wayne |
GTL |
44% |
Contract does not outline additional payments |
Contract does not guarantee minimum payment |
GTL Inmate Telephone Service Agreement p. 1-2 para. 4 |
|
Unknown (did not provide contract) |
Unknown (did not provide contract) |
Did not provide contract |
Unknown (did not provide contract) |
|
Unknown (did not provide contract) |
Unknown (did not provide contract) |
Did not provide contract |
|
| Westchester |
GTL |
62% |
“… B) put in escrow $200,000.00 to be used for enhanced technology at the County’s request; C) roll over an escrow balance of $61,652.63 remaining from the previous agreement into the new term; …” |
Contract does not guarantee minimum payment |
Global Tel Link August 2018 – July 2021 p. 2 |
|
Unknown (did not provide contract) |
Unknown (did not provide contract) |
Did not provide contract |
Unknown (did not provide contract) |
|
Primonics (Securus) |
County pays Primonics $4748.33 per month |
Primonics Contract No. 5717BPS p. 2 |
|
| Wyoming |
GTL |
80% |
“… Premise Provider is compensated on a per call basis, depending on the program implemented, either at a flat amount per call, or on a percentage of the call charge.” |
Contract does not guarantee minimum payment |
Resolution No. 20-129 p. 1 |
|
Unknown (did not provide contract) |
Unknown (did not provide contract) |
Did not provide contract |
Unknown (did not provide contract) |
|
Unknown (did not provide contract) |
Unknown (did not provide contract) |
Did not provide contract |
|
| Yates |
GTL |
80% |
Contract does not outline additional payments |
Contract does not guarantee minimum payment |
Amendment p. 1 para. 1 |
|
GTL |
20% |
Amendment p. 1 para. 2 |
No |
|
GTL |
20% |
Amendment p. 1 para. 2 |
|
This appendix table shows that the majority of counties bundle together phone calls and other services into a single contract. Bundling services together usually adds additional costs for the consumers. We chose to distinguish between counties (such as Albany) that bundled together services from a single vendor within the initial contract, and other counties (such as Broome) that signed a phone contract and then later added non-phone services to that contract via amendment. Both of these scenarios are concerning for different reasons: When counties bundle from the outset, providers can obscure the true cost of the contract and the provider’s profits, as explained in Footnote 2. And when counties add new services onto an existing contract instead of putting out a competitive request for proposals, they fail to consider whether a competing company could provide either the existing or newly-added services at a lower cost.
| County |
Are Services Bundled? |
| Albany |
Yes: Phone, tablet, and video services were bundled in initial contract |
| Allegany |
Unknown (Did not provide contract) |
| Broome |
Yes: Tablet and video services were added to existing phone contract via amendment |
| Cattaraugus |
Yes: Tablet and video services were added to existing phone contract via amendment |
| Cayuga |
Unknown (Did not provide Tablet and Video contracts) |
| Chautauqua |
Yes: Phone and video services were bundled in initial contract |
| Chemung |
Unknown (Did not provide Tablet and Video contracts) |
| Chenango |
Unknown (Did not provide Tablet and Video contracts) |
| Clinton |
Yes: Tablet and video services were added to existing phone contract via amendment |
| Columbia |
Unknown (Did not provide Tablet and Video contracts) |
| Cortland |
Yes: Tablet services were added to existing phone contract via amendment |
| Delaware |
Yes: Tablet and video services were added to existing phone contract via amendment |
| Dutchess |
Yes: Phone, tablet, and video services were bundled in initial contract |
| Erie |
Yes: Video services were added to existing phone contract via amendment |
| Essex |
Yes: Phone, tablet, and video services were bundled in initial contract |
| Franklin |
Yes: Tablet and video services were added to existing phone contract via amendment |
| Fulton |
No: Has contracts with different providers for phone and tablet services |
| Genesee |
Yes: Phone and video services were bundled in initial documents |
| Greene |
Unknown (Did not provide Tablet and Video contracts) |
| Hamilton |
N/A (Facility does not offer tablet and video services) |
| Herkimer |
Unknown (Did not provide Tablet and Video contracts) |
| Jefferson |
Unknown (Did not provide Tablet and Video contracts) |
| Lewis |
Yes: Tablet and video services were added to existing phone contract via amendment |
| Livingston |
Yes: Phone, tablet, and video services were bundled in initial contract |
| Madison |
Yes: Tablet and video services were added to existing phone contract via amendment |
| Monroe |
Yes: Phone, tablet, and video services were bundled in initial contract |
| Montgomery |
Unknown (Did not provide Tablet and Video contracts) |
| Nassau |
Unknown (Did not provide Tablet and Video contracts) |
| Niagara |
Yes: Video services were added to existing phone contract via amendment |
| Oneida |
Unclear: County provided contracts for different providers for phone services and tablet/video services (GTL for phones and Trinity for tablets and video). However, Telmate, a GTL subsidiary, lists that it provides tablet and video services to Oneida County on its website. |
| Onondaga |
Yes: Phone and video services were bundled in initial contract |
| Ontario |
Yes: Phone, Tablet, Video were bundled in initial contract |
| Orange |
Unknown (Did not provide Tablet and Video contracts) |
| Orleans |
Unknown (Did not provide full phone and video contracts) |
| Oswego |
Yes: Tablet and video services were added to existing phone contract via amendment |
| Otsego |
Unknown (Did not provide Tablet and Video contracts) |
| Putnam |
Yes: Tablet services were added to existing phone contract via amendment |
| Rensselaer |
Yes: Video services were added to existing phone contract via amendment |
| Rockland |
Unknown (Did not provide phone, tablet, or video contracts) |
| Saratoga |
Yes: Tablet and video services were added to existing phone contract via amendment (The phone and tablet provider is Keefe, which is owned by GTL) |
| Schenectady |
Unknown (Did not provide phone, tablet, or video contracts) |
| Schoharie |
Yes: Tablet and video services were added to existing phone contract via amendment |
| Schuyler |
Unknown (Did not provide Tablet and Video contracts) |
| Seneca |
Unknown (Did not provide Tablet and Video contracts) |
| St. Lawrence |
Yes: Tablet and video services were added to existing phone contract via amendment |
| Steuben |
Yes: Tablet and video services were added to existing phone contract via amendment |
| Suffolk |
Unknown (Did not provide Tablet and Video contracts) |
| Sullivan |
Unknown (Did not provide phone, tablet, or video contracts) |
| Tioga |
N/A (Facility does not offer tablet and video services) |
| Tompkins |
Yes: Tablet and video services were added to existing phone contract via amendment |
| Ulster |
Unknown (Did not provide contract) |
| Warren |
N/A (Facility does not offer tablet and video services) |
| Washington |
Yes: Tablet and video services were added to existing phone contract via amendment |
| Wayne |
Unknown (Did not provide Tablet and Video contracts) |
| Westchester |
No: Has contracts with different providers for phone and video services (county did not provide a tablet contract) |
| Wyoming |
Unknown (Did not provide Tablet and Video contracts) |
| Yates |
Yes: Phone, tablet, and video services are in a single contract (unknown if it was set up this way initially or if additional services were added to existing contract via amendment) |
Different county contracts specify different payees for the commissions. In some cases, kickbacks are paid directly to the jail, in others to the county more broadly, and in still others to a specified fund. For each county, this table shows the payee listed in the county contract.
Of course, as we have argued for years, these kickbacks are inappropriate no matter who technically receives them. As Verizon, a vocal opponent of predatory phone calls, noted in a comment to the FCC: “DOCs may use commissions to fund beneficial inmate services that may not otherwise receive funding. But forcing inmates’s families to fund these programs through their calling rates is not the answer. Because higher rates necessarily reduce inmates’s telephone communications with their families and thus impede the well-recognized societal benefits resulting from such communications, other funding sources should be pursued.”
| County |
Phones |
Tablets |
Video |
| Albany |
County |
County |
County |
| Allegany |
Unknown (did not provide phone contract) |
Unknown (did not provide tablet contract) |
Unknown (did not provide video contract) |
| Broome |
Broome County Jail/Premises Provider |
Broome County Jail/Premises Provider |
Broome County Jail/Premises Provider |
| Cattaraugus |
Cattaraugus County, Attn: Sheriff’s Office |
Premises Provider |
Premises Provider |
| Cayuga |
Cayuga County Jail, Sheriff David S. Gould |
Unknown (did not provide tablet contract) |
Unknown (did not provide video contract) |
| Chautauqua |
Chautauqua County Jail |
Unknown (did not provide tablet contract) |
Chautauqua County Jail |
| Chemung |
Chemung County Jail, Attn: Sheriff Christopher J. Moss |
Unknown (did not provide tablet contract) |
Unknown (did not provide video contract) |
| Chenango |
Unknown (did not provide phone contract) |
Unknown (did not provide tablet contract) |
Unknown (did not provide video contract) |
| Clinton |
Clinton County Jail, Attn: David Farro, Sheriff |
Clinton County Jail/Premises Provider |
Clinton County Jail/Premises Provider |
| Columbia |
Unknown (county provided incomplete documentation that leaves details of service unclear) |
Unknown (did not provide tablet contract) |
Unknown (did not provide video contract) |
| Cortland |
Cortland County Jail |
Cortland County Sheriff’s Department/Premise Provider |
Unknown (did not provide video contract) |
| Delaware |
Unknown (county provided incomplete documentation that leaves details of service unclear) |
County said it does not provide this service |
County said it does not provide this service |
| Dutchess |
Dutchess County Sheriff’s Department, Attn: George Krom, Correction Administrator |
Dutchess County/Premise Provider |
Unknown (did not provide video contract) |
| Erie |
Erie County Sheriff’s Office, NY/Facility |
County said it does not provide this service |
Erie County Sheriff’s Office, NY/Facility |
| Essex |
Essex County Jail, Attn: Sheriff David Reynolds |
Essex County Jail/Premises Provider |
Essex County Jail/Premises Provider |
| Franklin |
Franklin County Jail/Premises Provider |
Franklin County Jail/Premises Provider |
Franklin County Jail/Premises Provider |
| Fulton |
Fulton County Jail, Attn: Sheriff Thomas J. Lorey |
Unknown (county provided incomplete documentation that leaves details of service unclear) |
Unknown (did not provide video contract) |
| Genesee |
County |
Unknown (county provided incomplete documentation that leaves details of service unclear) |
Unknown (did not provide video contract) |
| Greene |
Greene County Jail, Att: Daniel Frank, County Administrator |
Unknown (did not provide tablet contract) |
Unknown (did not provide video contract) |
| Hamilton |
County said there are no commissions on phone calls |
County said it does not provide this service |
County said it does not provide this service |
| Herkimer |
Herkimer County Jail, Attn: Ms. Judy Higgins (Deposited by county to Account A 3150A.2450A, Commissions, Correctional Facility Fund) |
Unknown (did not provide tablet contract) |
Unknown (did not provide video contract) |
| Jefferson |
Jefferson County Sheriff’s Office |
Unknown (did not provide tablet contract) |
Unknown (did not provide video contract) |
| Lewis |
County of Lewis/County |
Lewis County Jail/Premises Provider |
Lewis County Jail/Premises Provider |
| Livingston |
Livingston County, Attn: Chief Deputy Jason Yasso |
Livingston County Jail/Premises Provider |
Livingston County Jail/Premises Provider |
| Madison |
Madison County Jail, Attn: Sheriff |
Madison County/ Premises Provider |
Madison County/Premises Provider |
| Monroe |
Jail Administration, Monroe County Sheriff’s Office (by county resolution, payments go to trust fund 9620, T99 Jail Commissary-Phone) |
Jail Administration, Monroe County Sheriff’s Office (by county resulotion, payments go to trust fund 9620, T99 Jail Commissary-Phone) |
Jail Administration, Monroe County Sheriff’s Office (by county resulotion, payments go to trust fund 9620, T99 Jail Commissary-Phone) |
| Montgomery |
Montgomery County Treasurer |
Unknown (did not provide tablet contract) |
Unknown (did not provide video contract) |
| Nassau |
Nassau County Correctional Center, Attn: Warren Vandewater, Budget Director |
Unknown (did not provide tablet contract) |
Unknown (did not provide video contract) |
| Niagara |
Niagara County Sheriff’s Office |
Unknown (did not provide tablet contract) |
Unknown (did not provide video contract) |
| Oneida |
Oneida County Sheriff’s Office/Premises Provider |
Oneida County Sheriff’s Office |
Oneida County Sheriff’s Office |
| Onondaga |
County of Onondaga/County |
Unknown (did not provide tablet contract) |
County of Onondaga/County |
| Ontario |
Ontario County/Customer |
Ontario County/Customer |
Ontario County/Customer |
| Orange |
Karen Daly, Fiscal Manager, Orange County Correctional Facility |
County said it does not provide this service |
County said it does not provide this service |
| Orleans |
County |
County said it does not provide this service |
County |
| Oswego |
Oswego County Correctional Facility |
Oswego County Correctional Facility/Premises Provider |
Oswego County Correctional Facility/Premises Provider |
| Otsego |
Otsego County Sheriff’s Department |
Unknown (did not provide tablet contract) |
Unknown (did not provide video contract) |
| Putnam |
Putnam County, NY, Attn: Robert L. Langley Jr., Sheriff |
Unknown (county provided incomplete documentation that leaves details of service unclear) |
Unknown (did not provide video contract) |
| Rensselaer |
Rensselaer County Bureau of Finance |
Unknown (did not provide tablet contract) |
Unknown (county provided incomplete documentation that leaves details of service unclear) |
| Rockland |
Unknown (did not provide phone contract) |
Unknown (did not provide tablet contract) |
Unknown (did not provide video contract) |
| Saratoga |
County of Saratoga/County |
Saratoga County Correctional Facility/Client |
Saratoga County Correctional Facility/Client |
| Schenectady |
Finance Department |
Unknown (did not provide tablet contract) |
Unknown (did not provide video contract) |
| Schoharie |
Schoharie County Sheriff’s Office, ATTN: Sheriff Ron Stevens |
Schoharie County Jail/Premises Provider |
Schoharie County Jail/Premises Provider |
| Schuyler |
Schuyler County Jail, Attn: Sheriff William E. Yessman |
Unknown (did not provide tablet contract) |
Unknown (did not provide video contract) |
| Seneca |
Seneca County Jail |
Unknown (did not provide tablet contract) |
Unknown (did not provide video contract) |
| St. Lawrence |
St. Lawrence County Sheriff’s Office |
St. Lawrence County Correctional Facility |
Unknown (county provided incomplete documentation that leaves details of service unclear) |
| Steuben |
Steuben County Jail, Attn: Sheriff Joel Ordway |
Unknown (county provided incomplete documentation that leaves details of service unclear) |
Unknown (county provided incomplete documentation that leaves details of service unclear) |
| Suffolk |
County of Suffolk/County |
Unknown (did not provide tablet contract) |
Unknown (did not provide video contract) |
| Sullivan |
Sullivan County Sheriff’s Office, Attn: Sheriff |
Unknown (did not provide tablet contract) |
Unknown (did not provide video contract) |
| Tioga |
Tioga County Jail, Att: Gary W. Howard, Sheriff |
County said it does not provide this service |
County said it does not provide this service |
| Tompkins |
Tompkins County Sheriff’s Department/Premises Provider |
Tompkins County Sheriff’s Department/Premises Provider |
Tompkins County Sheriff’s Department/Premises Provider |
| Ulster |
Unknown (did not provide phone contract) |
Unknown (did not provide tablet contract) |
Unknown (did not provide video contract) |
| Warren |
Unknown (county provided incomplete documentation that leaves details of service unclear) |
County said it does not provide this service |
County said it does not provide this service |
| Washington |
Unknown (county provided incomplete documentation that leaves details of service unclear) |
Washington County Jail/Premises Provider |
Washington County Jail/Premises Provider |
| Wayne |
Wayne County Sheriff’s Office/Premises Provider |
Unknown (did not provide tablet contract) |
Unknown (did not provide video contract) |
| Westchester |
County of Westchester/County |
Unknown (did not provide tablet contract) |
County said it does not provide this service |
| Wyoming |
Wyoming County Jail |
Unknown (did not provide tablet contract) |
Unknown (did not provide video contract) |
| Yates |
Unknown (county provided incomplete documentation that leaves details of service unclear) |
Yates County Jail/Premises Provider |
Yates County Jail/Premises Provider |
Advocates and local politicians can take note of when the current contract in your county is set to expire. Many will automatically renew unless a new contract is sought and negotiated. As you can see, some counties sent contracts that have already expired.
| County |
Expiration date |
Renewal Terms |
Notes |
| Albany |
2/11/22 |
2 one-year options for renewal |
|
| Allegany |
2014 |
Automatically renews |
The full GTL contract was not provided, though the county’s FOIL response indicates that the initial contract expired in 2014 and has been renewed every year since. |
| Broome |
2/14/22 |
2 one-year options for renewal |
|
| Cattaraugus |
5/20/22 |
Automatically renews |
|
| Cayuga |
10/28/19 |
Automatically renews |
In response to a request for the current contract on 5/12/2020, the county sent a contract that expired on 10/28/2019. |
| Chautauqua |
5/31/23 |
Automatically renews |
This is a 10-year contract. |
| Chemung |
4/10/22 |
Automatically renews |
|
| Chenango |
Unknown (contract was not provided) |
Unknown (contract was not provided) |
|
| Clinton |
10/5/23 |
Automatically renews |
|
| Columbia |
12/29/20 |
Automatically renews |
|
| Cortland |
5/1/21 |
Automatically renews |
|
| Delaware |
10/13/23 |
Does not specify renewal terms |
|
| Dutchess |
9/29/20 |
Automatically renews |
The exact end date of this contract is unclear because the effective date (the date that the Agreement is signed by all parties) is unclear. There are no dates accompanying signatures directly; however, the signature page bears a date of 9/29/15 in the bottom left corner. We assumed that this is the effective date. |
| Erie |
9/30/22 |
2 one-year automatic renewals |
|
| Essex |
7/1/23 |
Does not specify renewal terms |
|
| Franklin |
Unknown |
Unknown |
Full contracts were not provided; as such, the end date of the contract is unclear. The most recent amendment was signed 9/11/2020. |
| Fulton |
GTL: 10/8/23
Trinity: Unknown |
GTL: automatically renews
Trinity: Unknown” |
Fulton County contracts with GTL for phone services and Trinity for tablets. The agreement with Trinity does not provide an end date. The most recent date of signature on that document is 1/9/2020. |
| Genesee |
Unknown (contract was not provided) |
Unknown (contract was not provided) |
Full contracts were not provided; as such, the end date of the contract is unclear. The resolution approving Securus’s proposal, which was provided to us, was signed 5/25/2018. |
| Greene |
6/8/14 |
Automatically renews |
|
| Hamilton |
Not applicable |
Not applicable |
In response to a FOIL request, Herkimer County stated that phone calls are free at the county jail and did not provide contracts. |
| Herkimer |
10/25/19 |
Automatically renews |
|
| Jefferson |
10/10/17 |
Automatically renews |
|
| Lewis |
4/15/23 |
Does not specify renewal terms |
|
| Livingston |
GTL: 8/27/2023
Primonics: 7/18/17 |
Automatically renews |
|
| Madison |
11/17/21 |
Automatically renews |
|
| Monroe |
4/30/25 |
5 one-year options for renewal |
|
| Montgomery |
4/13/17 |
Automatically renews |
Montgomery County responded on 9/30/2020 that they did not have a current contract. We obtained a contract that is expired, but automatically renews, from Worth Rises. As of 3/12/2021, rates for Montgomery County were listed on the GTL website. |
| Nassau |
2/7/15 |
Does not specify renewal terms |
In response to a request for the current contract on 7/1/2020, the county sent a contract that expired on 2/7/2015. Nassau County also responded that “no records exist” relating to tablet or video services. |
| Niagara |
6/17/21 |
Automatically renews |
|
| Oneida |
GTL: 6/15/2012
Trinity: 4/30/2020 |
GTL: automatically renews
Trinity: Does not specify renewal terms |
In response to a request for the current contract on 7/13/2020, the county sent a contract with Trinity for tablets that expired on 4/20/2020. Telmate’s website, as of 3/12/2021, lists that it provides tablets and video here. |
| Onondaga |
12/31/2021 |
Does not specify renewal terms |
|
| Ontario |
10/27/23 |
1 five-year option for renewal |
|
| Orange |
2/2/16 |
3 one-year options for renewal |
In response to the request for current contracts on 7/10/2020, the county sent a contract that expired on 2/2/2019 at the latest. Orange County responded “N/A no such record” to the request for records relating to tablet and video services. GTL’s website lists that it provides video services as of 3/12/2021. |
| Orleans |
5/31/22 |
Unclear from the documents provided |
Orleans County provided no agreements with service providers. The response stated that the records requested “are trade secrets or are submitted to agency by a commercial enterprise or derived from information obtained from a commercial enterprise and which, if disclosed, would cause substantial injury to the competitive position of the subject enterprise (POL 87(2)(d)).” |
| Oswego |
1/30/22 |
Automatically renews |
|
| Otsego |
12/20/16 |
Automatically renews |
|
| Putnam |
Either 4/26/24 or 10/22/22 |
Either automatically renews or 3 one-year automatic renewals |
The contract states that the term of the agreement runs until 4/26/2024, though an amendment states that the term of the agreement is extended to 10/22/2022 with 3 one-year renewals. |
| Rensselaer |
12/20/19 |
Unclear from the documents provided |
In response to the request for the current contracts on 3/1/2021, the county sent a contract that expired on 12/20/2019. |
| Rockland |
Unknown (contract was not provided) |
Unknown (contract was not provided) |
Rockland County responded that Corrections does not keep responsive records. Current rates were listed on both the GTL and Securus websites. GTL is listed on the Rockland County Sheriff’s Office website. |
| Saratoga |
GTL: Unknown
Keefe: 9/4/24 |
GTL: Unknown
Keefe: automatically renews |
The full GTL contract was not provided; as such, the end date of the contract is unclear. The most recent amendment was signed 3/23/2020. |
| Schenectady |
8/14/20 |
Automatically renews |
Schenectady County did not provide response to our FOIL requests. However, we obtained a contract from MuckRock.com. GTL’s website lists Schenectady County as one of the places it serves. |
| Schoharie |
2/11/25 |
Automatically renews |
|
| Schuyler |
3/16/25 |
Automatically renews |
|
| Seneca |
8/9/23 |
Automatically renews |
|
| St. Lawrence |
2/20/24 |
Automatically renews |
|
| Steuben |
2/20/21 |
Automatically renews |
|
| Suffolk |
4/30/19 |
Does not specify renewal terms |
|
| Sullivan |
5/27/16 |
Automatically renews |
Sullivan County did not provide response to our FOIL requests. However, we obtained a recent contract from MuckRock.com. Securus’s website lists Sullivan County as one of the places it serves. |
| Tioga |
5/19/25 |
Automatically renews |
|
| Tompkins |
6/15/23 |
Automatically renews |
|
| Ulster |
Unknown (contract was not provided) |
Unknown (contract was not provided) |
|
| Warren |
None |
Automatically renews |
Some documentation was provided in response to a FOIL request, though the contract itself was not provided. |
| Washington |
4/11/24 |
Does not specify renewal terms |
|
| Wayne |
9/11/11 |
1 two-year option for renewal |
|
| Westchester |
GTL: 7/31/21
Primonics: 5/14/24 |
GTL: 1 two-year option for renewal |
|
| Wyoming |
6/11/24 |
Automatically renews |
|
| Yates |
3/16/21 |
Does not specify renewal terms |
|


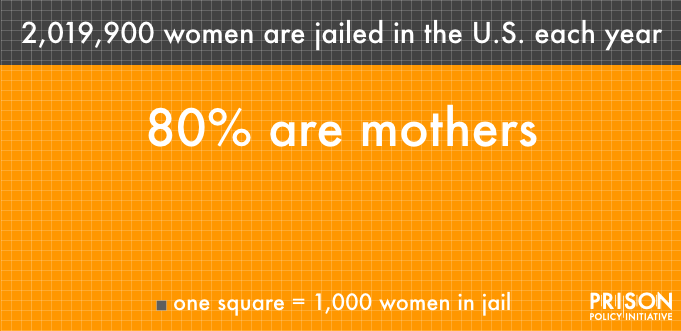 Estimates have been rounded for this graphic. Sources: Federal Bureau of Investigation,


