At a time when cutting the adult prison population by 50% seems radical to many people, states have already cut the number of confined youth by 60% since 2000.
December 19, 2019
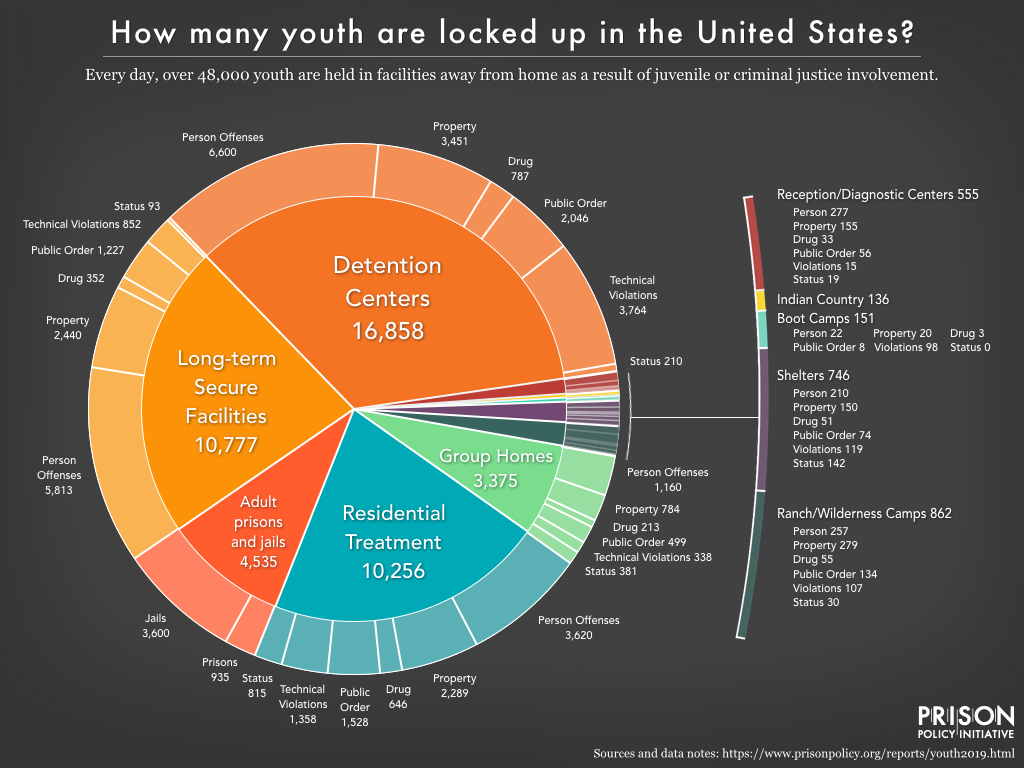
Why are 48,000 children and teenagers locked up in the United States, and where exactly are they? How are the juvenile justice system and the criminal justice system similar, and how are they different? In a new infographic and report, the Prison Policy Initiative answers these unexpectedly difficult questions about youth confinement.
Youth Confinement: The Whole Pie 2019 reveals failures in the juvenile justice system that mirror failures in the adult system, including:
- Unnecessary pretrial detention. On any given day, 9,500 youth – or 1 in 5 youth in confinement – are locked up before trial.
- Incarceration for the most minor offenses. 19% of youth in juvenile facilities are locked up for “technical violations” of probation or parole, or for status offenses (behaviors for which an adult would not be prosecuted).
- Glaring racial disparities. While only 14% of children under 18 in the U.S. are Black, 42% of boys and 35% of girls in juvenile facilities are Black.
But the number of youth in confinement is also falling dramatically. “At a time when cutting the adult prison population by 50% strikes many people as radical, states have already cut the number of confined youth by 60% since 2000, and that trend is continuing,” said report author Wendy Sawyer. The report describes state reforms that have helped shrink the juvenile justice system, such as:
- Reducing incarceration for certain offenses, including status offenses, technical violations, and misdemeanors
- Closing large detention facilities and developing new community-based supervision and treatment programs
- Limiting the amount of time youth may be incarcerated or under court supervision
“States have reduced youth incarceration without seeing an increase in crime, which is very encouraging, but there are still far too many youth in confinement,” said Sawyer, “Today, there are 13,500 youth locked up away from home for drug possession and low-level offenses, not to mention 7,000 other youth detained before trial. That means this country still has a lot of work to do.”
For the full report and more infographics, see https://www.prisonpolicy.org/reports/youth2019.html.
We list 24 high-impact policy ideas for state legislators looking to reform their criminal justice systems.
by Wanda Bertram,
December 12, 2019
This report has been updated with a new version for 2022.
 State legislatures can determine the future of mass incarceration. That’s why we just published — as we do every December — a report on 20+ winnable criminal justice reforms that state legislators can take on.
We publish this report as a PDF with links to more information and model bills, and we’ll soon send it to state legislators across the country. This year, our list of reforms ripe for legislative victory includes:
- Eliminating probation fees and regulating privatized probation services
- Banning Departments of Corrections taking kickbacks from prison retailers
- Decreasing state incarceration rates by reducing jail populations
- Repealing ineffective and harmful “sentencing enhancement” zones
- Offering medication-assisted opioid treatment to reduce deaths in prison
- Protecting in-person visits and letters from home in local jails
- Ending automatic driver’s license suspensions for nonpayment of fines and fees, and for drug offenses unrelated to driving
- Capping maximum probation terms
- Reducing or eliminating jail time for technical violations
- Reducing barriers to housing for formerly incarcerated people
Our full report on winnable criminal justice reforms includes more ideas for reducing state prison populations, eliminating burdensome costs for incarcerated people, supporting people leaving prison, and promoting public health and community safety.
Will your state be working on any of these reforms? We’re looking forward to the progress we can make together in 2020!
Our 50-state survey finds that in spite of national standards, most states lack important policies on prenatal care and nutrition for pregnant women.
by Roxanne Daniel,
December 5, 2019
This past August, released surveillance footage showed 26-year-old Diana Sanchez alerting Denver County Jail deputies and medical staff that she was in labor just hours before she gave birth to her son, alone in her cell. With her pleas ignored by staff, Sanchez was forced to give birth without any medical aid or assistance. Her experience is not isolated, as a number of reports by women in prisons and jails across the country have revealed a similar disregard for pregnant women’s basic needs.
What’s more, the documentation of pregnancies and pregnancy care is sparse, sometimes anecdotal, and rarely generalizable on a national level. The most recent data from the Bureau of Justice Statistics (BJS) was collected more than 15 years ago. In 2002, BJS found that 5% of women in local jails were pregnant when admitted. For prisons, BJS reported that in 2004, 4% of women in state prisons and 3% of women in federal prisons were pregnant upon admission. The government has not released any further national data since.
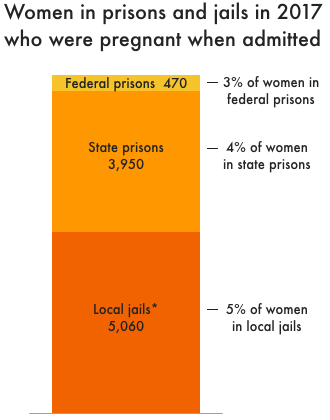 These estimates are based on the number of women under local, state, and federal jurisdiction in 2017 and the percentages of women in prisons and jails who were pregnant when admitted, as reported by the Bureau of Justice Statistics. *Note that the estimate for women in local jails is based on the jail population on a single day, not the much greater number of women admitted to jail over the course of a year.
A recent study of 22 U.S. state prison systems and all U.S. federal prisons, published in the American Journal of Public Health, found a similar pregnancy rate; roughly 3.8% of the women in their sample were pregnant when they entered prison from 2016-2017. While the rate of pregnancy in prison may have remained stable since the early 2000s, the additional 10,000+ women imprisoned since then indicates that the number of women who are incarcerated while pregnant has grown, too. As long as the mass incarceration of women endures, incarcerated pregnancies will continue to rise.
Given the scale and stakes of this issue, it is imperative that correctional systems set policies that ensure the health and well-being of pregnant women in their custody. Provisions for adequate nutrition and prenatal medical care must be codified in policy to protect against negative health outcomes, such as miscarriages and low fetal birth weights, that can impact mothers and their children for the rest of their lives.
To see the extent to which these concerns are currently being addressed, we evaluated the policies of each state’s prison system and the federal Bureau of Prisons (BOP) to screen for adherence to nationally recognized guidelines. Troublingly, many states fail to meet even basic standards.
Continue reading →
When the only way to get necessities in prison is to buy them from a single retailer, exploitation is the result.
by Wanda Bertram,
November 14, 2019
As John Oliver explained in a recent episode of Last Week Tonight, people in prison are consumers too: Incarcerated people must pay for basic necessities such as phone calls, soap, and medicine, to say nothing of “luxury” items such as books. But how are consumer rights and protections different for people behind bars, and what can be done to protect these consumers from exploitation?
The Hastings Race and Poverty Law Journal has just published an article by Prison Policy Initiative volunteer Stephen Raher, presenting a comprehensive survey of consumer law issues in prisons and jails. Raher will speak about his article, The Company Store and the Literally Captive Market, at this weekend’s Consumer Rights Litigation Conference, sponsored by the National Consumer Law Center. Raher’s article explains:
- How incarcerated consumers are denied basic aspects of customer care – such as refunds for shoddy products, meaningful warranties, or even the expectation that a product will be well made. (pp. 72-76)
- How prison retail companies attempt to justify the high prices they charge incarcerated customers. For instance, prison retailers often claim that high prices are necessary because of the overhead costs associated with security. But these overhead costs — to the extent that they are real–are likely canceled out by common business functions that prison retailers don’t have to spend money on, such as advertising and operating a network of brick-and-mortar stores. (p. 25)
- How prison retail companies have avoided regulation. For instance, some prison phone companies are attempting to brand themselves as “information services” companies, a class of company subject to fewer regulations and less oversight. (p. 52)
- How prisons and jails themselves exacerbate the problem. Not only have a growing number of correctional facilities shifted the costs of incarceration onto incarcerated people (for example, by making people pay for medical supplies or clothing), they also frequently garnish portions of family members’ deposits into their loved ones’ trust accounts, making it even more expensive for people on the outside to support their loved ones. (pp. 81-82)
- What sources of protection are available. Incarcerated people and their family members may have rights under existing laws like the Communications Act, the Electronic Fund Transfer Act, or state consumer-protection statutes. Some activist groups have scored major victories under these laws, but often legal action is impossible or impractical given ubiquitous arbitration clauses and class-action bans that appear in companies’ terms of service. (p. 33)
There are also detailed discussions of data breaches impacting incarcerated people (pp. 40-44), deceptive advertising practices (pp. 36-40), and the rapidly-expanding practice of utilizing computer tablets inside prisons and jails (pp. 21-23).
Historically, there was little need for consumer protection in correctional facilities because the facilities used to provide basic necessities and incarcerated people had little need to engage in commercial transactions. But as more essential goods and services — toothpaste, phone calls, socks, etc. — are accessible only via purchase, people are faced with commercial exploitation while they are incarcerated.
Unfortunately, incarcerated people are uniquely vulnerable because in many segments of American law (like telecommunications), government regulators have taken a hands-off approach under the belief that consumers will choose companies that don’t treat them unfairly, and therefore the market will self-police. This logic has no place in correctional facilities, where phone and commissary vendors enjoy monopoly powers, and consumers have one choice: submit to an unfair transaction, or go without toothpaste or a phone call with family.
The article concludes with eight concrete policy proposals that describe how state and local governments, and federal lawmakers, can take modest but meaningful steps to protect incarcerated people and their families from unfair and oppressive commercial transactions.
The article is long and detailed, so we prepared a table of contents for it with links to the individual sections:
Table of contents
- Background p. 5
- Surveying the Landscape of Prison Retailing p. 9
- End Users p. 9
- Payers p. 10
- Facilities p. 12
- Vendors p. 15
- Telecommunications p. 16
- Commissary p. 17
- Money Transmitters, Correctional Banking, and Release Cards p. 18
- Tablets: The New Frontier p. 21
- Unfair Industry Practices p. 23
- Masquerading as Cream: Inflated Prices and Inefficient Payment Systems p. 24
- What Law Applies? p. 30
- Terms of Service: Carrying a Bad Joke Too Far p. 33
- Advertising, Privacy, and Consumer Psychology p. 35
- Data Insecurity p. 40
- Potential Sources of Protection p. 46
- Telecommunications Law p. 46
- Technology Has Outpaced the Regulatory Framework p. 51
- The New Cross-Subsidies p. 54
- Advocacy and Activism p. 56
- Financial Services Law, Money Transmitters, and Prepaid Accounts p. 58
- Categorizing Prepayments p. 60
- Financial Services Law and Prison-Related Transfers p. 61
- Legal Issues Related to Release Cards p. 64
- UDAP Statutes p. 66
- Prices p. 68
- Terms and Conditions p. 70
- Sales of Goods p. 72
- Antitrust p. 75
- Policy Recommendations p. 76
- State and Local Governments p. 77
- Reimagine Procurement Practices p. 77
- Foster Competition p. 78
- Conduct Rulemaking Proceedings to Protect Consumers p. 80
- Provide Protection for Trust Account Balances p. 81
- Develop Independent ADR Systems p. 82
- Federal p. 83
- CFPB Regulation of Correctional Banking p. 83
- Congressional Action p. 84
- Wright Petition, Post-Remand p. 85
- Conclusion p. 86
The Bureau of Justice Statistics is tasked with collecting, analyzing, and publishing data about the criminal justice system. But its reports are slowing down - and its framing of criminal justice issues is becoming more punitive.
by Wendy Sawyer,
November 14, 2019
We’ve heard this question from a few advocates and journalists who, like us, depend on the Bureau of Justice Statistics (BJS) and other government data sources for timely information about the justice system. And while monitoring changes in federal data collections isn’t a core part of our work, we have observed a troubling trend: Since 2017, data releases are slowing down.
We aren’t the only ones who have noticed. Last month, a coalition representing thousands of academic and nonprofit researchers and advocates wrote to the Office of Justice Programs with questions about missing and delayed data releases as well.
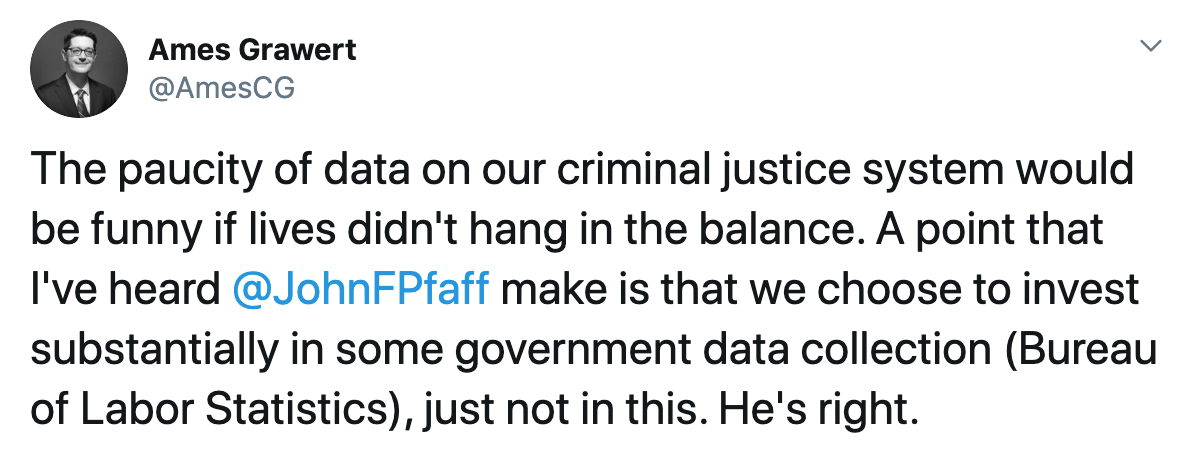
I probably don’t have to convince our regular readers that timely data is essential for identifying both social problems and effective policy solutions — and that it’s especially important in the context of criminal justice, where the human costs are so high. And admittedly, it’s not news that government justice data has long been less well-funded, less timely, and less comprehensive than, say, labor statistics.
Even so, these publications have slowed even further — and even been curtailed — under the current administration. To see the extent of this trend, I went through the BJS’ list of publications since 2000 and compared the time between the data collection reference dates and the corresponding report publication dates for six annual report series. I found that there has indeed been a dramatic change in the past several years:
 The time between data collection and data publication for most regular Bureau of Justice Statistics reports has increased dramatically in the last few years.
Publication delays in annual Bureau of Justice Statistics reports
I looked at six report series that have been on annual schedules for years: Jail Inmates, Prisoners, Probation and Parole in the United States, Correctional Populations in the United States, Jails in Indian Country, and the Mortality series (formerly Deaths in Custody). These are the reports that we rely on to produce our Whole Pie and Correctional Control reports, and provide data for many of our other briefings and publications.
I found that while data collection activities for these series have continued, BJS data releases and reports have all experienced significant delays, starting in 2017:
- The annual Prisoners report provides a “snapshot” of who’s incarcerated in state and federal prisons on a given day, allowing the public and policymakers to spot trends and respond to them as quickly as possible. These reports came out like clockwork for years, typically within 7-12 months of the year-end data collection. The 2017 prison data was 4 months later than usual, released in April 2019. We have not yet seen 2018 data from BJS, but the Vera Institute of Justice released state prison data it collected independently earlier this year, essentially “lapping” the government’s data collection and publication.
- Since 1996, the Jail Inmates report, which offers a similar “snapshot” of local jail populations across the U.S., has been published within one year of the data collection reference date (usually June 30). The 2017 report was released 22 months after the midyear reference date, and it’s already been over 16 months for the 2018 data. The delay on this report is especially concerning, given how quickly jail populations can shift with changes in policing, prosecution, or court processes.
- The Probation and Parole report serves a similar trend-monitoring purpose, but focuses on the 4.5 million people on probation and parole in the U.S. These reports were reliably released in late fall of each year after data collection, dating back to 2004. (In the 10 years before that, these reports came out even sooner, by late August.) The 2016 report, however, was released in April 2018, and we’ve now been waiting over 22 months for the 2017 data.
- The Correctional Populations reports present data on people who are incarcerated and those under community supervision, and sometimes include useful data on these populations before the more targeted prison or jail reports are published. These reports were published consistently in late fall of the year following data collection until December 2016, when 2015 data were reported. The 2016 report was late, and we have yet to see the 2017 data, which now reflect the correctional populations of over 22 months ago.
- The very narrow glimpse we have into how the justice system operates on tribal lands largely comes from the Jails in Indian Country reports. Typically released within 12-18 months of the June 30 data reference date, it’s now been almost 2 years since the last time BJS released a report in this series, although the 2017 and 2018 data have been collected.
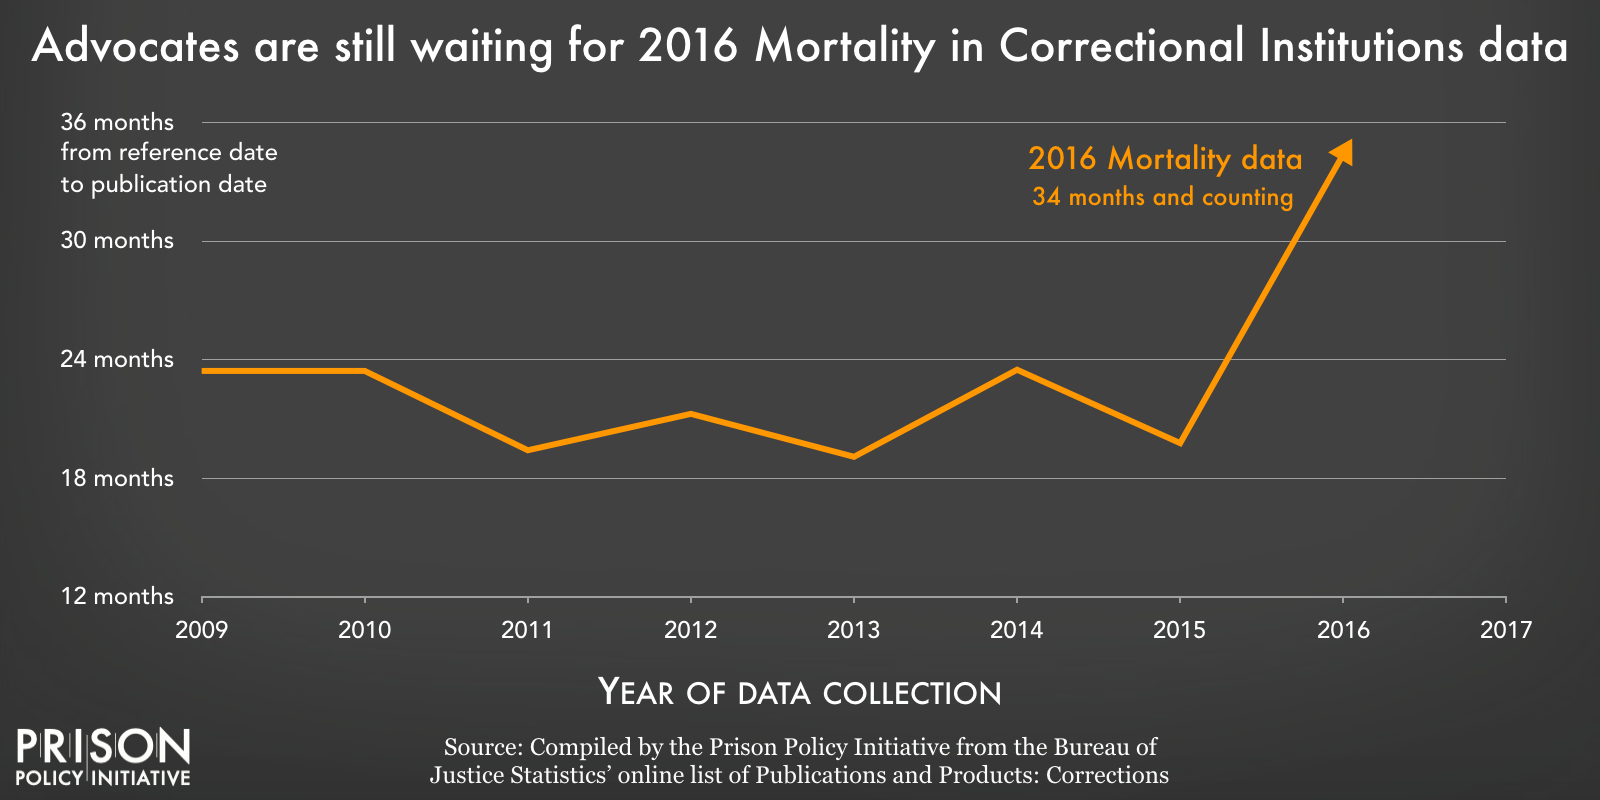
- Finally, the Mortality reports are our only “official” source of information about deaths in prison and jail custody; they are essential for holding correctional agencies accountable for preventable deaths from suicide and homicide. They also help shine a light on the life-threatening health problems among incarcerated people. Yet the last two Mortality reports only gave us part of the picture, reporting only deaths in prisons in 2014 and only HIV-related deaths in prisons in 2015. And although these reports are published on a slightly slower schedule (18-24 months from the data reference date), these, too, have been badly delayed. The most recent data on jail deaths available is from 2013 — despite increasing attention to jail suicides and a law requiring this data to be reported annually — and three years of data have been collected since we last saw any reports.
Researchers and advocates are concerned about other delays at BJS
In October, as I mentioned above, a coalition headed by the Crime and Justice Research Alliance and COSSA wrote to the Office of Justice Programs with questions about other missing and overdue BJS publications.
Of special concern is the 2016 Survey of Prison Inmates (SPI). The SPI was conducted every 5-7 years from 1974-2004, and was finally conducted again in 2016. In the intervening years, we saw the high-water mark of mass incarceration thus far, and witnessed tremendous growth and change in correctional control. Yet BJS has published none of the invaluable data contained in this survey, which includes “demographic characteristics, current offense and sentence, incident characteristics, firearm possession and sources, criminal history, socioeconomic characteristics, family background, drug and alcohol use and treatment, mental and physical health and treatment, and facility programs and rule violations, etc.” Almost none of the 2016 data has been released, three years later and counting. Only a report on the methodology and a report on a subset of the data on firearms have been released to date.
The coalition’s letter also highlights delays in the annual Background Checks for Firearms Transfers reports (the last data reported are from 2015), and asks whether a planned survey of police forensic units, commissioned by the Department of Justice in 2014, has been abandoned.
It gets worse: Important data on jails and pretrial detention won’t even be collected for years
The Bureau of Justice Statistics is also many years behind schedule for at least one crucial and long-awaited data collection, the Survey of Inmates in Local Jails (SILJ). The SILJ was collected every 5-7 years from 1972-2002, and it provides the most comprehensive, nationally representative data available on people held in local jails. It’s especially important for the information it offers about the pretrial (or unconvicted) population. Unbelievably, the 2002 SILJ is the most recent source we have to measure what portion of people held pretrial are there because they can’t afford a bail bond, what racial disparities exist among pretrial detainees, and what offenses people are locked up for before trial. After much delay, the current plan has the next survey slated for 2021; assuming it is released in 2022, it will be 15 years off-schedule.
Another data series that sheds light on pretrial decisions, State Court Processing Statistics, was “halted in 2009 due to concerns about cost and representativeness,” according to a recent BJS-funded study by the Urban Institute. According to that report, BJS “plans to implement a new data collection series to develop national statistics on the processing of pretrial defendants…This program, National Pretrial Reporting Program (NPRP), was conceptualized to supplement or replace the State Court Processing Statistics (SCPS) program.” While the feasibility study tested an experimental survey and recommended an alternative sampling method that would make the sample nationally representative, it’s been 10 years now since BJS has released any new data on pretrial processes.
Beyond delays: “Trimmed” data from the FBI, politicized language at OJJDP and BJS
Government justice agencies have not merely delayed their data releases: They’ve also made partisan decisions that undermine the transparency and impartiality we expect from them. These issues extend beyond the Bureau of Justice Statistics to other reporting agencies.
In 2017, the FBI “strategically trimmed the amount of tables” from 81 to 29 in the agency’s annual report on arrest data and trends, Crime in the United States. The missing data included information as fundamental as arrests by sex. In response to “user feedback” — and very likely, assertions that it reflected the Trump administration’s “suppression of government data and…unwillingness to share information” — 70 “supplemental” tables were later released.
Advocates have also noticed troubling changes on the Office of Juvenile Justice and Delinquency Prevention’s website, changes “that indicate a shift toward a more punitive approach to juvenile justice under the Trump administration.” For example, a webpage with the OJJDP’s policy guidance on “Eliminating Solitary Confinement for Youth” was taken down, and the new administration also issued a “language guidance” document directing OJJDP employers and contractors to replace widely-accepted terms with decidedly less pointed terms that downplay systemic problems. The document suggested changing references to “justice-involved youth” with the more stigmatizing “offender” label, “underserved youth” with “all youth,” and avoid referring to juvenile delinquency or crime as a “public health issue” and always emphasize “public safety.”
This signaling of the new administration’s priorities wasn’t just performative; the new OJJDP administrator Caren Harp also attempted to undermine efforts to reduce racial disparities among justice-involved youth by “slashing the kinds of data that local agencies must collect.” Harp reasoned that there hadn’t been enough progress to justify the data collection — leaving advocates wondering how collecting less data would improve matters.
In a previous briefing, I’ve already highlighted some alarmist framing in a recent BJS press release; other analysts and advocates have noted these “heavily politicized” communications as well. While the BJS reports themselves remain valuable data sources and politically neutral in tone, the headlines of the accompanying press releases in the past year or so have become increasingly alarmist and reflective of the Trump administration’s rhetoric. (Of course, this is not the first administration to politicize press releases: many will remember that former BJS Director Lawrence Greenfeld was replaced in 2005 because he objected to the Bush administration’s attempts to suppress findings of racial disparities in a BJS press release.)
So what’s going on?
The reasons behind these decisions and delays are unclear — is it funding problems? Staff shortages? Changes in leadership? It could well be any, or all, of these problems.
BJS has been “flat funded” for years, despite the massive growth in the number and size of the correctional agencies they survey, and despite increasing demands for justice system data under laws mandating annual data collection, like the Prison Rape Elimination Act and the Deaths in Custody Reporting Act. A National Academies publication explains that this has been a problem under both Democratic and Republican administrations, going back decades.
The Crime and Justice Research Alliance and COSSA — the coalition that wrote the October letter to the DOJ I mentioned earlier — suggest that staffing problems may explain the delays. They write, “[M]any in the criminal justice research community have heard of an alarming decline in the number of BJS staff as a consequence of hiring freezes, staff attrition, and failure to replace departing staff and experts.” Again, this is an agency that has been chronically underfunded and understaffed relative to the herculean task of collecting and analyzing the nation’s decentralized justice system data.
And then there is the issue of leadership. With its mandate to produce reliable, large-scale studies with national, state, and local policy implications, effective leadership at BJS requires “strong scientific skills, experience with federal statistical agencies, familiarity with BJS and its products, [and] visibility in the nation’s statistical community,” among other qualities. That’s according to four former BJS Directors and the President of the American Statistical Association, who wrote to former Attorney General Sessions in 2017 to encourage the appointment of an experienced research director to head up BJS.
That didn’t happen. Instead, since late 2017, the Bureau of Justice Statistics has been under the leadership of Jeffrey Anderson, whose only prior statistical experience appears to be the co-creation of a college football computer ranking system in 1992. On criminal justice, all I could find in his history were a handful of 2015-2016 articles in which he argues against criminal justice reform. In a National Review article, he called Obama-era Washington “tone-deaf on crime,” despite the widespread bipartisan support of criminal justice reform. Sadly, the problems we’re seeing with data delays and politicized language suggest that the current leadership may not agree about the importance of the agency they lead.
Welcome Jenny Landon, our new Development & Communications Associate!
by Wendy Sawyer,
November 1, 2019
 Please welcome our new Development & Communications Associate, Jenny Landon.
Jenny is a 2016 University of Massachusetts graduate, with a degree in Social Thought and Political Economy. She previously worked on anti-corruption campaigns as an organizer with Represent.Us. Most recently, she honed her development and communications skills at Tapestry, a local community health organization. We’re excited to grow our team’s capacity to take on more projects with Jenny’s help.
Welcome, Jenny!
The Prison Policy Initiative submits a comment letter calling on the USPS to stop rounding up postage costs and to remember that low-income incarcerated people are reliant on the postal service for communication.
by Peter Wagner,
October 29, 2019
Today, the Prison Policy Initiative submitted a comment letter to the regulatory agency that oversees the Postal Service’s rates. The Postal Service is proposing to round the price of a first class stamp up to the nearest 5 cents.
Our objection is not to the specific rate charged, but to the policy of rounding up to the nearest nickel. We specifically objected to the Postal Services argument that the rounding is appropriate because the annual impact on the average “household” is small. In our nine-page letter, we explain:
- Why the 2.3 million people incarcerated in the U.S. are disproportionately reliant on the Postal Service for communication.
- How much mail the typical incarcerated person sends (in perhaps the first ever national estimate of how many stamps incarcerated people purchase).
- Why the Postal Service is obligated to serve all people, not just “households.”
- Just how little income incarcerated people have, and how many hours of prison labor it would take to pay for a 3 cent rate increase caused by the Postal Service’s rounding policy.
- Why it is inappropriate to propose a rule that disproportionately impacts incarcerated people — who do not have ready access to the Internet — and only allow a narrow two week comment period.
In our letter, we explain that incarcerated people and their families represent a constituency that is uniquely dependent on letter mail sent via the U.S. Postal Service. We argue that the Postal Service’s five-cent rounding policy imposes substantial negative effects on this constituency. Unless the Postal Service is willing to create a new classification to provide reduced rates for mail sent by or to an incarcerated person, the needs of incarcerated customers should be accounted for in determining how rates are calculated.
The five-cent rounding policy has already come under fire from the federal courts. In September, a federal court rejected the Postal Service’s rationale for its January 2019 rate increase to 55 cents. (The Postal Service’s data showed that a stamp should cost 52 cents in 2019, but their new rounding rule made a stamp cost 55 cents in 2019.) Unfortunately, despite the Postal Service’s loss in court, the proposal for rates in 2020 invents a new flawed rationale to justify the discredited rounding policy. (Without the rounding policy, stamp prices would probably be 52 or 53 cents in 2020.)
The report highlights the need for reforms to local jails, which now hold more women than state prisons do.
October 29, 2019
A report released this morning by the Prison Policy Initiative and the ACLU Campaign for Smart Justice presents the most recent and comprehensive data on how many women are locked up in the U.S., where, and why.
Women in the U.S. experience a dramatically different criminal justice system than men do, but data on their experiences is difficult to find and put into context. The new edition of Women’s Mass Incarceration: The Whole Pie, which the Prison Policy Initiative and ACLU have published every year since 2017, fills this gap with four richly-annotated data visualizations about women behind bars.
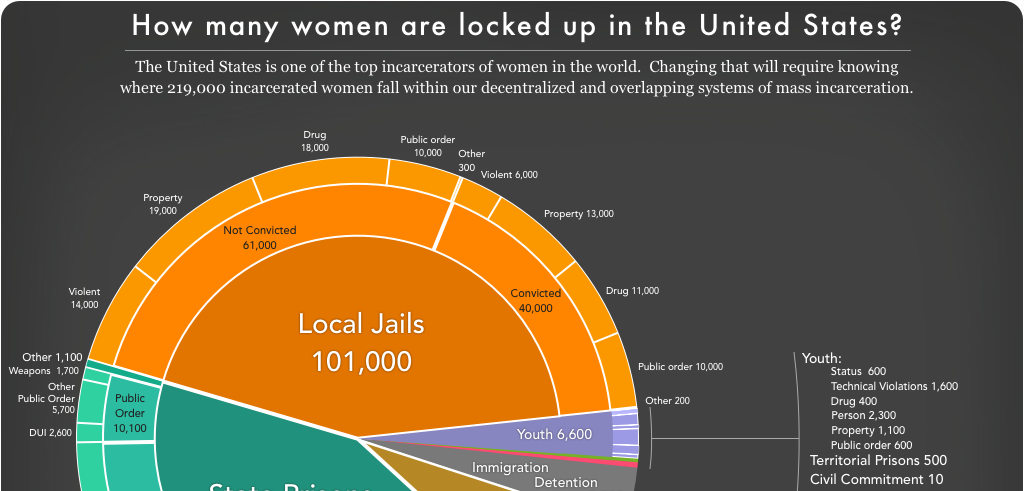
“Producing this big-picture view of incarcerated women helps us see why many recent criminal justice reforms are failing to reduce women’s incarceration,” said report author Aleks Kajstura. Most importantly, the new report underscores the need for reforms to local jails:
- More incarcerated women are held in local jails than in state prisons, in stark contrast to incarcerated men, meaning that reforms that only impact people in prison will not benefit them.
- The number of women in local jails grew between 2016 and 2017 — a trend that reflects counties’ growing reliance on jails to solve social problems.
- Women convicted of criminal offenses are more likely than men to be serving their sentences in local jails, where healthcare and rehabilitative programs are much harder to access than in prisons.
- On any given night, 4,500 immigrant women are held for ICE in local jails — over half of the 7,700 women held in immigration detention.
The report goes on to explain why 231,000 women are locked up in the U.S.:
- 73% of women in prisons and jails are locked up for nonviolent offenses, in contrast to only 57% of all people in prisons and jails (who are almost entirely men).
- 10% of girls in the juvenile justice system — compared to only 3% of boys — are held for status offenses like running away, truancy, or “incorrigibility,” which would not be crimes if committed by adults.
- 27% of women in prisons and jails are locked up for violent offenses, including acts of violence committed in self-defense.
Beyond presenting new data, Women’s Mass Incarceration: The Whole Pie 2019 also reviews the existing literature on women’s incarceration, including the Prison Policy Initiative’s prior research on gender disparities in police contact, women’s access to reentry services after incarceration, and the incomes of women in prisons and jails.
We've had an incredibly productive year. In our new annual report, we share the highlights.
by Peter Wagner,
October 17, 2019
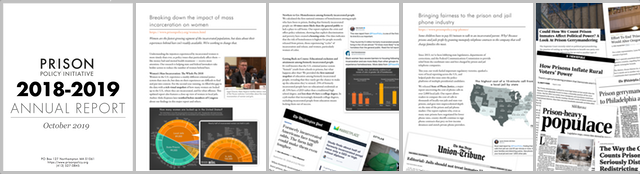
We just released our 2018-2019 Annual Report, and I’m thrilled to share some highlights of our work with you. We’ve had an incredibly productive year, releasing 10 major national reports and 27 research briefings, as well as doubling down on our strategic communications work and making our website an even better tool for researchers and advocates.
There are a few successes I’m particularly proud of:
- Calculating the first national estimates of homelessness among people who have been to prison, revealing that formerly incarcerated people are 10 times more likely to be homeless than the general public.
- Releasing a landmark report on the prison and jail phone industry, which sparked a wave of news coverage, spurred multiple counties to action, and helped push the issue of prison phone justice onto the platforms of multiple presidential candidates.
- Launching a campaign to help counties uncover the root causes of jail overcrowding rather than building new jail space, using our new report Does our county really need a bigger jail?
- Helping Washington and Nevada become the fifth and sixth states to end prison gerrymandering. (And momentum is building: nine other states considered bills to end prison gerrymandering this year.)
- Publishing a groundbreaking 50-state report comparing parole release systems — a first-of-its-kind guide to understanding parole and how it works in every state.
But these highlights barely scratch the surface of what we’ve accomplished this year. See our highly-skimmable annual report for a review our work on all of our issues over the last year. I’m honored that you were a part of these successes, and I’m looking forward to working with you in the year to come.
The government hasn’t collected national data on the race or ethnicity of people awaiting trial in jail since 2002. We review the academic literature published since then to offer a more current assessment of racial disparities in pretrial detention.
by Wendy Sawyer,
October 9, 2019
Being jailed before trial is no small matter: It can throw a defendant’s life into disarray and make it more likely that they will plead guilty just to get out of jail.1 As advocates bring national attention to these harms of pretrial detention, many places – most recently New Jersey, California, New York, and Colorado – have passed reforms intended to dramatically reduce pretrial populations.
But it’s not enough to simply bring pretrial populations down: Another central goal of pretrial reform must be to eliminate racial bias in decisions about who is detained pretrial and who is allowed to go free. Historically, Black and brown2 defendants have been more likely to be jailed before trial than white defendants. And recent evidence from New Jersey and Kentucky shows that while some reforms have helped reduce pretrial populations, they’ve had little or no impact on reducing racial disparities.
As of 2002 (the last time the government collected this data nationally), about 29% of people in local jails were unconvicted – that is, locked up while awaiting trial or another hearing. Nearly 7 in 10 (69%) of these detainees were people of color, with Black (43%) and Hispanic (19.6%) defendants especially overrepresented compared to their share of the total U.S. population. Since then, pretrial populations have more than doubled in size, and unconvicted defendants now make up about two-thirds (65%) of jail populations nationally. With far more people exposed to the harms of pretrial detention than before, the question of racial justice in the pretrial process is an urgent one – but the lack of national data has made it hard to answer.
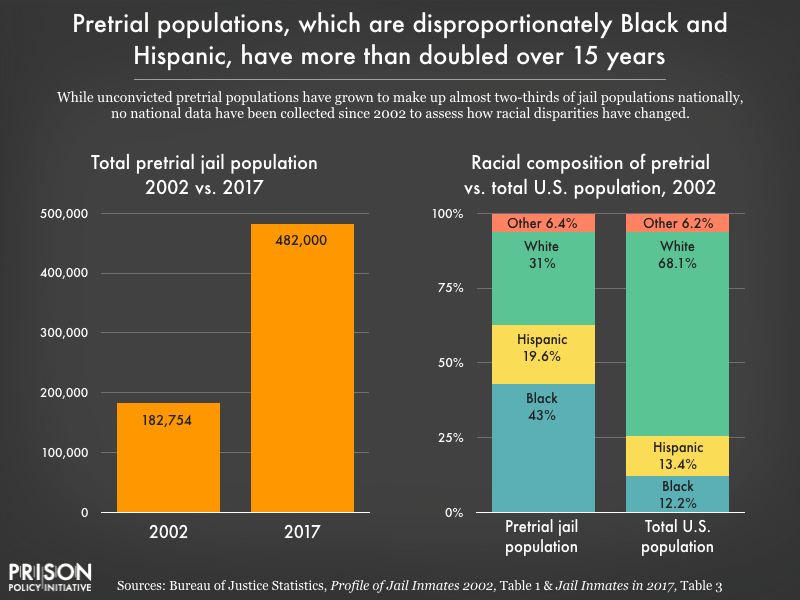 While pretrial jail populations have grown to make up almost two-thirds of jail populations nationally, and Black and Hispanic defendants were overrepresented in the 2002 population, no national data have been collected since then to assess how racial disparities may have changed.
So what, exactly, is the state of racial justice in pretrial detention? And how can advocates assess racial justice in their county or state? What data do they need, and where can they find it? This briefing reviews findings from recent studies of racial disparities in pretrial decisions – including both national and more geographically-limited analyses – and then suggests sources for further research to understand and address the problem.
To assess the state of racial justice in pretrial detention since the last national survey was conducted nearly 20 years ago, I reviewed more recent academic literature – studies that utilize other data sources and offer more nuanced analysis.
Overall, the available research suggests that:
- In large urban areas, Black felony defendants are over 25% more likely than white defendants to be held pretrial.
- Across the country, Black and brown defendants are at least 10-25% more likely than white defendants to be detained pretrial or to have to pay money bail.
- Young Black men are about 50% more likely to be detained pretrial than white defendants.
- Black and brown defendants receive bail amounts that are twice as high as bail set for white defendants – and they are less likely to be able to afford it.
- Even in states that have implemented pretrial reforms, racial disparities persist in pretrial detention.
National data is limited and outdated
Only one publicly-accessible study uses a nationally representative sample to measure pretrial detention status by race: the Survey of Inmates in Local Jails (SILJ), which was last conducted in 2002. Considering that jails and policing practices have changed significantly since 2002, an update to this dataset – now slated for 2021 – is long overdue.
Since 2002, national studies have been limited to felony cases in large urban counties. These studies are based on the Bureau of Justice Statistics’ (BJS) State Court Processing Statistics (SCPS), data which were last collected in 2009. The data include both demographic and case characteristics for each defendant, allowing researchers to control for legally-relevant factors like offense type, number of arrest charges filed, prior criminal record, and whether the defendant had failed to appear in court before. While BJS’ own publications based on this dataset (the Felony Defendants in Large Urban Counties series) do not provide a breakdown of pretrial detention by race or ethnicity, some academic researchers have used it for that purpose. (For a full list of their studies, see the appendix to this article.)
These national studies of felony cases in large counties generally conclude that the direct impact of race on pretrial decisions is weak, but that racial bias acts cumulatively to affect outcomes, and indirectly via factors like ability to pay for bond or a private attorney. McIntyre & Baradaran’s analysis of 1990-2006 SCPS data concludes that Black defendants are over 25% more likely to be held pretrial than white defendants. The most recent SCPS data, from 2009, supports that finding: Even after controlling for age, gender, and a number of conceivably legally-relevant factors (most serious charge, prior arrests, etc.), Dobbie & Yang (2019) find that over half (58%) of the 39 sampled counties had higher rates of pretrial detention for Black defendants than for white defendants. In 5 counties, the unexplained racial gap was over 20%.
More recent, but geographically-limited, studies help fill in the gaps
More recent analyses shed further light on racial justice in pretrial decision-making, even though their samples are not nationally representative. I looked at 16 of these more geographically-limited studies, with subjects ranging from federal drug cases in the Midwest to misdemeanor cases in Harris County (Houston), Texas. In all, they include samples from 11 states spread across the U.S., and major cities including New York City, San Francisco, Philadelphia, and Miami.
Of course, no single estimate of racial disparity in pretrial detention will apply to all counties nationwide. In the studies I reviewed, the racial gap in pretrial detention between Black and white defendants ranges widely, from about 10% to 80% depending on the study and jurisdiction (that is, the county or city).
However, these studies most frequently confirm that unexplained racial disparities continue to plague the pretrial process.3 Throughout the literature, researchers report that rates of pretrial detention and receiving financial conditions of release (i.e. money bail) are consistently higher for Black and Latinx defendants (and often Native American defendants, when they are included in the analysis). Bail bond amounts, too, are consistently higher for Black and brown defendants, even though they are less able to afford money bail. Rates of release on recognizance or other nonfinancial conditions of release, such as pretrial supervision, are likewise lower for Black and brown – versus white – defendants. Furthermore, the studies that included sex and age in their analysis found that young Black males face the greatest disadvantages.
Specifically, these studies report significant racial disparities, such as:
- Most of these studies find that Black and brown defendants are 10-25% more likely to be detained pretrial or to receive financial conditions of release.
- Median bond amounts, when compared, are often about $10,000 higher for Black defendants compared to white defendants. In at least one study, the median bond set for Black defendants was double the median bond set for white defendants.
- The most recent analyses of racial disparities in pretrial detention – assessing the effects of reforms in New Jersey and Kentucky – show that pretrial assessment tools have not reduced these disparities as much as advocates hoped. After New Jersey essentially ended the use of money bail for most defendants in 2017, the total pretrial population dropped significantly, but the racial composition of the pretrial jail population changed very little. And in Kentucky, the racial disparity in pretrial release rates actually worsened after the state enacted a law requiring the use of a pretrial assessment tool.
Advocates may be able to find data about their local jails
Of course, county or city jail administrators may collect and maintain data on the racial/ethnic composition of their pretrial populations. Advocates in some jurisdictions may be able to request data about their own local pretrial jail populations, which they can compare with the overall local population for a simple measure of racial disparity. Such a comparison, however, will exclude other relevant characteristics (such as seriousness of offense or past failures to appear in court) and won’t identify what stage(s) of pretrial decision-making are affected by race (such as the decision to set a money bail amount, or how high bail was set). Nevertheless, even a crude estimate of racial disparity in local pretrial detention can help advocates draw attention to the issue and raise important questions with decisionmakers.
Where to look next for more data
Jailing Black and brown pretrial defendants more often than white defendants isn’t just unfair; it also contributes to racial disparities later in the justice process. But in order to solve this problem, local advocates and policymakers need current data about who is held pretrial in their counties and states. And in order to identify broader patterns in pretrial decision-making, we need more data at the national level as well.
Until the Bureau of Justice Statistics updates its Survey of Inmates in Local Jails – which, unfortunately, is not guaranteed to happen on schedule in 2021 due to chronic underfunding – advocates and policymakers must rely on independently-produced local studies. Academic researchers (including those referenced in this briefing) have already developed models for these local studies.
In places where there appears to be little or no data published about racial disparities in the pretrial process, advocates can partner with local academic institutions or ask state Statistical Analysis Centers for assistance. Several large-scale projects led by non-governmental organizations are also actively working to assist local jurisdictions in using their data to inform policy changes that will reduce unnecessary incarceration. For example, the MacArthur Foundation’s national Safety and Justice Challenge supports initiatives in 52 jurisdictions across the U.S. to reduce the misuse and overuse of jails. And Arnold Ventures recently launched the National Partnership for Pretrial Justice, advancing a variety of pretrial justice projects across 35 states. Measures for Justice is developing a broad, publicly-accessible database of county criminal justice data; currently it offers data from 6 states, with data from 14 more states expected in 2020. And of course, community bail funds across the country have been collecting data as they bail low-income defendants out of jail – no strings attached – and reporting high success rates that underscore just how unnecessary money bail is. These kinds of resources can help local advocates and future researchers find the data they need to measure racial disparities in pretrial justice processes, and work to eliminate them.
See the Appendix for a list of all of the sources reviewed for this briefing, with links and summaries of their findings related to racial disparities in pretrial detention.
Footnotes

 These estimates are based on the
 Please welcome our new Development & Communications Associate, Jenny Landon.
 While pretrial jail populations have grown to make up almost two-thirds of jail populations nationally, and Black and Hispanic defendants were overrepresented in the 2002 population, no national data have been collected since then to assess how racial disparities may have changed.

