Uncategorized archives

All too often, proposals to expand local jails receive no pushback or critical attention. A new report helps counties think twice.

May 6, 2019

Easthampton, Mass. – A new Prison Policy Initiative report gives cities and counties a long-needed tool for fighting mass incarceration: a guide to preventing unnecessary jail expansion. The report, Does our county really need a bigger jail?, lays out 33 questions that local decision-makers should ask in evaluating proposals for new or bigger jails.

“It’s very common today for jails to be overcrowded, because the number of people in jails nationwide has tripled in the last 30 years,” said report author Alexi Jones. “But in too many counties, jail growth is rooted in known policy failures like an overreliance on money bail. Local policymakers owe it to their constituents to find out if there is a better fix to overcrowding than just building a new or bigger jail.”

The report’s 33 questions for policymakers include:

  • On a typical day, how many people are confined in the existing jail who have not been convicted?
  • How many people in the county are incarcerated because they cannot afford to pay fines and fees?
  • What specialized “diversion” courts and treatment programs is the county using to divert people struggling with substance use and mental illness into more effective treatments than jail?
  • Do official cost estimates for building new jail space include not only the cost of construction, but the cost of debt service on the loan, annual operation costs, and collateral costs such as adverse impacts on public health?
Graph showing growth in the number of people who have served 10 or more years in prison

“Building new jail space typically costs tens of millions of dollars or more, even as other options that are both more cost-effective and more compassionate are ignored,” said Jones. “If policymakers can’t answer these questions about why more jail space is necessary, they should not be undertaking jail expansion.”

For all 33 questions, the report also offers a set of alternatives and best practices, including:

  • Releasing more pretrial defendants on their own recognizance, and investing in pretrial services to help them make their court dates;
  • Requiring judges to set fines and fees based on a defendant’s ability to pay;
  • Investing in specialized “problem-solving” courts for people with mental health or substance use disorders that serve as true alternatives to jail time.

The report’s recommendations are accompanied by helpful graphics, as well as examples of local and state governments successfully implementing alternatives to jail expansion. “We know that the answer to mass incarceration begins at the local level,” said Jones. “That’s why it’s critical to help cities and counties think beyond jail expansion when it comes to improving public safety.”


People on probation are much more likely to be low-income than those who aren't, and steep monthly probation fees put them at risk of being jailed when they can't pay.

by Mack Finkel, April 9, 2019

Over 3.6 million people are under probation supervision in the U.S., and in most states, they are charged a monthly probation fee. The problem? Many of them are among the nation’s poorest, and they can’t afford these fees. From our previous research in Massachusetts – and from reports from around the country – we know that the burden of probation fees often falls disproportionately on the poor. To determine the extent of the problem nationally, we examined the incomes of people on probation in a recent survey, the National Survey of Drug Use and Health. Our analysis confirms that, nationwide, people on probation are much more likely than people not on probation to have low incomes.

The National Survey of Drug Use and Health (NSDUH) is an annual survey that asks respondents about a broad range of topics, including their annual income and whether they were on probation in the past 12 months. The inclusion of recent probation history in the survey makes it a valuable data source for criminal justice research; it comes closer than any other source to offering a recent, descriptive, nationally representative picture of the population on probation.1 Prof. Michelle Phelps of the University of Minnesota, for example, used this survey in her recent analysis comparing people on probation to those in prison, using educational attainment as a measure of economic status.

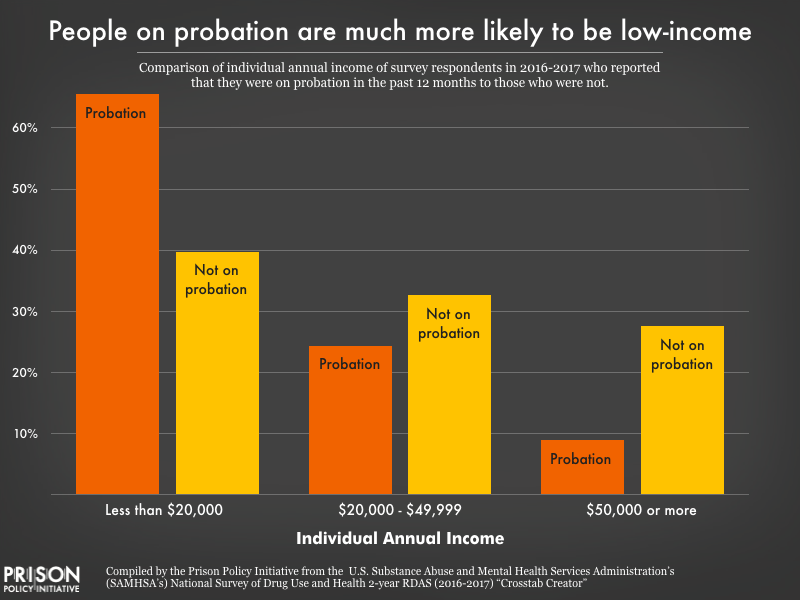
Our analysis of the 2016-2017 NSDUH data shows that people on probation typically have much lower incomes than those who aren’t on probation:

Chart comparing the portion of the probation population making less than $20,000 per year, $20,000 to $49,999 per year, and $50,000 or more per year to the portion of the population that was not recently on probation. Most notable is that two-thirds of the probation population has an annual income below $20,000, compared to just 40% of the non-probation population.People on probation are much more likely to be low-income than those who aren’t on probation, and steep monthly probation fees often put them at risk of being jailed when they can’t pay. For a more detailed comparison, see the Appendix table.

Key findings from our analysis include:

  • Nationwide, two-thirds (66%) of people on probation make less than $20,000 per year.
  • Nearly 2 in 5 people on probation (38%) make less than $10,000 per year, well below the poverty line.
  • On the wealthier end of the spectrum, few people (9%) on probation have annual incomes of $50,000 or more, while more than a quarter (28%) of those not on probation make at least $50,000 per year.

Monthly probation fees may be just one of several fees that someone on probation has to pay regularly. As part of the conditions of their probation, an individual might have to pay court costs, one-time fees, monthly supervision fees, electronic monitoring costs, or any combination of these charges. Sometimes the law strictly defines the cost of these fees, and sometimes “reasonableness” is the only statutory guideline. Depending on the state, courts, departments of corrections, sheriffs’ departments, and the probation programs themselves can all collect revenue from these fees.

Even though the Supreme Court has said it is unconstitutional to incarcerate someone because they cannot afford to pay court ordered fines and fees, many courts effectively do just that. Judges often fail to consider the individual’s ability to pay (as opposed to their willingness to pay) and treat nonpayment of fees as a violation of probation. This flies in the face of many state statutes that allow incarceration only when there is evidence that the individual is able to pay but refuses.2 As a result, poor people on probation face a very real risk of being incarcerated because they can’t afford monthly fees. As the National Criminal Justice Debt Initiative shows, many state laws amount to “poverty penalties” and “poverty traps” and failure to pay can mean an extended probation sentence, driver’s license revocation, mandatory work program, or incarceration.


Unaffordable fees and low-income probation populations, select states

*In Massachusetts, the fees have two tiers, $50 for administrative and $65 for supervised probation. In Oklahoma, there are two separate monthly supervision fees, one up to $40 and another up to $20.

**Due to the small number of NSDUH respondents in Maine and South Carolina who were on probation at any time in the past 12 months, the survey does not make the necessary data available for those states as part of NSDUH’s efforts to protect respondents’ identities.

This table includes states where probation fees can cost $50 or more each month, and shows that in almost all of these states, over half (and even as many as 83%) of people on probation have annual incomes below $20,000. For them, unaffordable probation fees can lead to a cycle of poverty and incarceration. (Sources: Criminal Justice Debt Reform Builder, for probation fees, and the National Survey on Drug Use and Health: 2-Year RDAS (2016-2017) for income data on the population experiencing probation in the past 12 months.)
State Monthly supervision fee Portion of probation population
making less than $20,000 per year
Colorado Up to $50 48%
Idaho Up to $75 67%
Illinois $50 65%
Louisiana $71 to $121 69%
Maine $10 to $50 NA**
Massachusetts $50 or $65* 52%
Michigan Up to $135 67%
Mississippi $55 67%
Montana At least $50 64%
New Mexico $15 to $150 83%
North Dakota $55 77%
Ohio Up to $50 62%
Oklahoma Up to $60* 75%
South Carolina $20 to $120 NA**
Washington Up to 100 50%


Such high fees – and high stakes – defeat the purpose of probation. In theory, probation (often touted as an “alternative” to incarceration) allows people to continue to work and manage family responsibilities while under supervision. But people faced with unaffordable fees are more likely to violate the conditions of supervision, experience housing and food instability, and struggle to support their children. And when failure to pay is treated as a violation of probation, individuals can be incarcerated, have their probation extended, and/or lose public benefits like food stamps and supplemental security income.

Louisiana is an especially punishing state for poor people on probation. The average probation sentence there lasts three years, and probation fees are among the highest in the country, at $71 to $121 per month, even though 69% of people on probation make less than $20,000 per year. Data from a report by the state’s Justice Reinvestment Task Force shows just how unreasonable these fees are. In Louisiana in 2015:

  • While under community supervision, the average person owed $1,740 in supervision fees alone. (Supervision fees were just one type of a number of court-ordered fines and fees.)
  • On average, people under supervision could only pay about half of the imposed fees; at the end of their supervision term, the average person still owed 48% of their supervision fees.

Louisiana’s probation system creates impossible debts that unfairly burden poor probationers. As in many states, failure to pay can lead to license suspensions, extension of supervision terms, and incarceration.

Fortunately, this is slated to change. Under a new law going into effect in August 2019, Louisiana courts will hold hearings on ability to pay, and defendants may have their fees waived or reduced if the court finds that fees will cause substantial financial hardship. While the fees are still far too high, the new law offers hope for low-income people on probation. (It’s worth noting that judges, district attorneys, and court clerks whose offices benefit from the fees have fought to delay the implementation of the law.)

As long as probation sentences include unreasonable fees and harsh punishments for failure to pay them, probation will continue to punish people just for being poor. Some states have begun to implement reforms to reduce the unnecessary incarceration and other unintended consequences of their probation fee systems. But as our analysis shows, this is a widespread problem that every state imposing probation fees should address. States must acknowledge that people on probation are mostly low-income, and driving them further into poverty through monthly fees is cruel and counterproductive.


Footnotes

  1. Although the survey does not ask about current probation status, the recency of their probation status makes those who have been on probation in the past 12 months a reasonable proxy for the general probation population. We therefore use the term “probation population” to refer to this group in our analysis.  ↩
  2. For state statutes that allow incarceration as a response to nonpayment of supervision fees, see these results from the Criminal Justice Debt Reform Builder.  ↩


Appendix table: Percentage of Probation Population vs. Non-Probation Population in Each Category of Personal Annual Income (Source: NSDUH 2016-2017)

Personal Annual Income Less than $10,000 $10,000 to $19,999 $20,000 to $29,999 $30,000 to $39,000 $40,000 to $49,999 $50,000 to $74,999 $75,000 or more
On probation in the past 12 months 37.9% 27.7% 13.4% 7% 5% 6.1% 2.9%
Not on probation in the past 12 months 21.8% 17.9% 13% 10.7% 9% 12.3% 15.3%

California's AB 964 would require in-person visits in all California jails

by Bernadette Rabuy, March 30, 2019

comment letter

For the past few years, California policymakers have been at hard work to protect in-person jail visitation from sheriffs and private companies who are eager to replace crucial human contact with impersonal video chats. While legislators were successful in preventing jails who provided in-person visits in January 2017 from later eliminating them, jails that had already banned in-person visits are permitted to continue their video-only policies.

That could change this legislative cycle thanks to Assembly Member Medina’s AB 964. AB 964 would require that all California jails provide in-person visits. Specifically, jails that are currently exempted would need to restore in-person visits by 2025.

The Assembly Public Safety Committee will be voting on AB 964 on April 2. We submitted a comment, encouraging committee members “to recognize and support the positive role families play in rehabilitation” and, more importantly, that “human beings need in person visits.”


Tablet computers are delivering a captive audience to profit-seeking companies, while enabling prisons to cut essential services like law libraries. We investigate.

by Mack Finkel and Wanda Bertram, March 7, 2019

We released an updated briefing on prison tablets in 2024. We recommend reading that, instead.

This article was updated in May 2021 with details about California’s prison tablet contract, and in August 2023 with information about additional attempts to eliminate existing services in favor of tablets in prisons.

Twelve states have recently signed contracts with prison telecom companies to provide tablet computers to incarcerated people – a sharp increase since we began analyzing these contracts in 2017. Though many prisons already allow incarcerated people to buy tablets, these contracts provide something different: Tablets for free, ostensibly at no cost to either consumers or taxpayers. (To be clear, these aren’t like the iPads you can buy at a store; they’re cheaply made, with no internet access.)

But as with most state contracts that appear to cost nothing, there is a catch – several, in fact.

First, the “free” tablets charge users at every opportunity, including above-market prices for phone calls, video chats and media. Even sending an email requires a paid “stamp.” Furthermore, our recent analysis of these contracts suggests that they actually put the interests of incarcerated people last, prioritizing cost savings and the provider’s bottom line.

For instance, many of these contracts:

  • Guarantee the Department of Corrections a portion of tablet revenue.
  • Allow tablet providers to alter the prices of services – such as email, music and money transfer – without state approval.
  • Allow providers to terminate tablet services if the tablets aren’t profitable enough.
  • Exempt providers from replacing a broken tablet if they think it was “willfully” damaged – a loophole ripe for exploitation, as prison tablets are cheaply made and break easily.

More details below:

Table 1. Findings from our analysis of eight “no-cost” contracts between state Departments of Corrections and tablet providers. Contracts are listed from oldest to newest. For more on GTL and Securus (JPay), the predominant tablet providers, see our recent report State of Phone Justice. In this table, “Active since” denotes the date that installation of tablet equipment in the correctional facility began.
**Note: While news reports state that each person in Vermont prisons is receiving a tablet, Vermont’s contract with GTL (which originally provided for kiosks, with the option for the state to request tablets) is less clear. According to the contract, tablets will be provided to up to 90% of people in each “living unit” in Vermont prisons. (See page 36 of the contract.)
Contract Active since Does the DOC receive a portion of tablet revenue? Can the provider cancel the service for reasons related to profitability? Are the terms of use subject to DOC approval? Will the provider replace broken tablets? Example of service charges on tablets
Colorado DOC and GTL August 2015 (suspended in 2018) Yes. DOC earns a flat payment of $800,000 per year. Yes. GTL can cancel the service if there is insufficient tablet revenue, or if more than 10 tablets in any one housing unit need to be repaired. No, DOC does not have to approve the Terms and Conditions. GTL has discretion to determine whether damage was “willful,” and does not have to replace willfully damaged tablets. GTL also does not have to replace more than 5 (or 5%, whatever is greater) tablets in a housing unit every year. A digital music subscription costs $19.99 per month.
Missouri DOC and JPay March 2017 Yes, DOC earns a 20% commission on songs, albums, movies, ebooks, and games. Yes. JPay can cancel the service if there is insufficient revenue. No. Terms of use not mentioned in contract (and therefore likely not subject to DOC oversight.) Unclear. A subscription to NewsStand, an app that allows one to read the news, costs $5.95 per month.
Vermont DOC and GTL** April 2017 Yes. The contract specfies that the DOC receives 32% of commissary sales, but it is unclear what percent of tablet media sales are paid to the DOC. Unclear. The contract does not specify revenue metrics as cause for termination. Tablet usage tracking/monitoring is required in the contract, and the state determines what limited number of functions are provided, but the contract does not specify terms of use. Unspecified. The contract indicates that GTL will provide the state with their company repair procedure policy. 1 week of streaming music: $7.99; 30 day access to game center: $5.99
New York DOCCS and JPay August 2017 No. No, contract does not specify circumstances in which service can be canceled. No. Terms of use not mentioned in contract (and therefore likely not subject to DOC oversight.) Unclear. Sending an email requires paid “stamps” starting at $0.35 (emails can require several stamps, depending on length).
South Dakota DOC and GTL March 2018 Yes. DOC earns a 50% commission on electronic messages and 24.2% on most types of phone calls. Yes. GTL can cancel the service if there is insufficient revenue or if equipment is “subjected to recurring vandalism.” No, DOC does not have to approve the Terms and Conditions. GTL has discretion to determine whether damage was “willful,” and does not have to replace willfully damaged tablets. A 14-day digital music subscription costs $14.99, including a $9 “infrastructure charge.”
Indiana DOC and GTL July 2018 Yes, DOC earns a 10% commission on purchased content (not including phone or video calls made on tablets). Yes. GTL can cancel service in housing units where 10 or 10% of tablets are damaged in a year. Yes, DOC must approve the Terms and Conditions. GTL has discretion to determine whether damage was “willful,” and does not have to replace willfully damaged tablets.
GTL does not have to replace tablets more than once for any given incarcerated person, nor does it have to replace more than 5 or 5% of tablets in a housing unit every year.
A 30-day subscription to “unlimited podcasts” costs $9.99.
Delaware DOC and GTL (pilot program) October 2018 No. Yes. GTL can cancel the service if too many tablets are damaged. Yes, DOC must approve Terms and Conditions. Unclear. Reading e-books, sending messages, or accessing music, movies, or games costs $0.05 per minute.
Maine DOC and Edovo December 2018 No. No, contract does not specify circumstances in which service can be canceled. Yes, DOC must approve Terms and Conditions and Privacy Policy. The facility has discretion to determine whether they or Edovo will replace damaged tablets. Edovo does not have to replace more than 5% of tablets for free every year. Sending more than 10 electronic messages per month costs between $10 and $50, depending on the number of messages one wishes to send.
South Carolina DOC and GTL January 2019 No. No, contract does not specify circumstances in which service can be canceled. No. Terms of use not mentioned in contract (and therefore likely not subject to DOC oversight). GTL is required to repair or replace damaged tablets or equipment, regardless of the cause of damage or loss. Sending electronic messages costs $0.25 per message.
Connecticut DOC and JPay April 2019 Yes, commissions to the DOC include 10%-35% revenue for replacement technology, purchases of external hardware accessories, and fees for emails, songs/music, news subscriptions, etc; and 50% of printing fees. No, contract does not specify circumstances in which service can be canceled. Yes, user agreement (including privacy and ownership provisions) is specified in contract, but unclear whether terms must be approved by DOC. Jpay will “repair and/or replace any broken or damaged Tablets and Kiosks as directed and authorized by the Department.” Any tablet that is “intentionally damaged or destroyed” must be replaced at cost to the DOC. Unclear who decides if a tablet was intentionally damaged. Audiobooks are available for $0.99-19.99 each. News subscriptions are $4.99 a month. Each email is $0.30.
West Virginia DCR and GTL October 2019 Yes, the WVDCR receives a 5% commission on all gross revenue. Yes. GTL can cancel the service if there is insufficient revenue. No. Terms of use not mentioned in contract (and therefore likely not subject to DOC oversight). Unclear, but contract states that GTL “will in no way be responsible, or liable for…the safety, efficacy, or use of the tablets…Tablets are provided ‘as is’ without warranty of any kind.” Reading e-books, sending messages, or accessing music, movies, or games costs $0.05 per minute.
California DCR and GTL December 2020 Yes. DOC earns a flat payment of $200,000 per year, which it says is “to cover the State contract management responsibilities and services.” Unclear. No mention of Terms and Conditions. “The state shall provide reasonable measures against loss by pilferage or destruction. The vendor shall be responsible for any expenses required for the repair of the equipment.” A video call costs $0.20 per minute, or $6 for a 30-minute call.

Providers and DOC officials often describe free tablets as a gift to incarcerated people, but they more closely resemble a corporate investment than a gift. For the companies, free tablets with expensive services more than pay for themselves down the line. And for prison administrators, tablets pave the way for the elimination of essential services. We’ve already seen prisons eliminate:

  • Law libraries. South Dakota eliminated its paralegals and physical law library after rolling out tablets. A subsequent lawsuit alleged that the tablet software meant to replace the law library is often unusable, and deprives incarcerated people of meaningful access to the courts.
  • Physical books. In 2018, Pennsylvania ended book donations to incarcerated people in favor of costly e-books, many of which were lifted directly from the free online library at Project Gutenberg (this policy was ultimately repealed and replaced with a cumbersome policy requiring book donations go through a “secure processing center” before being delivered to incarcerated people). New York and Maryland also tried to end book donations (before public pressure forced them to backtrack), and one large Florida jail even took away Bibles, replacing them with low-quality e-Bibles on tablets. In Cook County, Illinois, the sheriff’s office declared “paper products” contraband in 2023 and has limited access to books, offering tablets as an “alternative.”
  • Postal mail, which prisons can eliminate in favor of digital mail scans (as Pennsylvania did) and paid electronic messaging.
  • Music and Mp3 players. In 2017, the Florida Department of Corrections transitioned from MP3 players to tablets and people who had bought hundreds or thousands of dollars of music lost access to the music on the MP3 players, as they were confiscated as contraband when replaced with tablets.
  • Educational programming. Tablets are increasingly being used to supplement – and supplant – in-person higher education in prisons, leading to a “subpar educational experience” and significant technical difficulties in many state prisons, including in Missouri and Florida. In Massachusetts in 2022, the Department of Corrections chose to not reapply for more than $2 million in state educational grants for prison programs, and instead encouraged using tablets (which the state has already spent $14 million on) that are “pre-loaded with educational materials that they can use to study on their own” (the DOC maintains that this is in an effort to “offer more enrichment,” rather than replace existing teachers and programs).

All this being said, there is nothing inherently wrong with tablet technology, in or out of a prison setting. It’s certainly possible to imagine using tablet technology to substantially improve prison life — if states can ever learn to distinguish truly innovative policies from high-tech ploys to cut costs.


The movement for phone justice has won huge victories in state-run prisons, but people in jail pretrial are on the front lines of exploitation.

February 11, 2019

County and city jails frequently charge incarcerated people $1/minute or more for a phone call, far more than even the worst rates in state prisons, a new 50-state report finds. The Prison Policy Initiative report State of Phone Justice uncovers the cost of phone calls in over 2,000 jails nationwide, explaining why sheriffs sign lucrative phone contracts that prey on pretrial detainees.

“Jails have managed to escape the political pressure that forced many prisons to bring their rates down,” said co-author Peter Wagner. “We found that many jails are charging three, five or even 50 times as much as their state’s prisons would charge for the same phone call.” The report explains how:

  • Phone providers compete for jail contracts by offering sheriffs large portions of the revenue – and then charge exorbitant phone rates.
  • Providers exploit sheriffs’ lack of experience with telecommunications contracts to slip in hidden fees that fleece consumers.
  • State legislators, regulators and governors pay little attention to jails, even as they continue to lower the cost of calls home from state prisons.
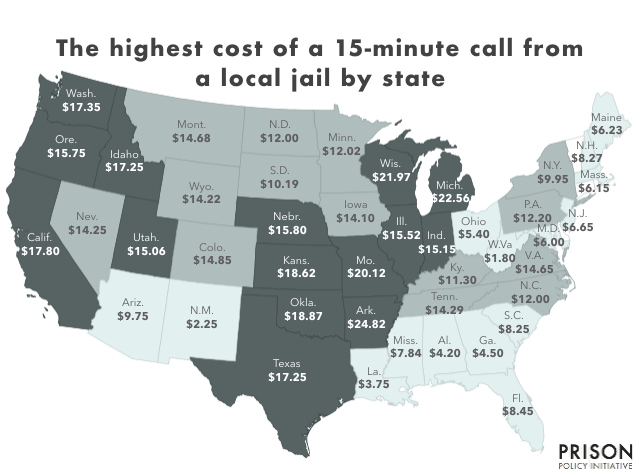
U.S. map showing the highest jail phone rates in every state

“High phone rates impact everyone in jail, but those worst affected are people detained pretrial because they cannot afford bail,” co-author Alexi Jones said. “When someone has to organize their defense from jail, the cost of phone calls becomes extremely limiting, and that ultimately makes our justice system less fair.”

The report also includes:

  • A sortable table of the cost of phone calls in jails nationwide, as well as the provider each jail contracts with;
  • A table comparing the cost of prison phone calls in each state to the cost of jail phone calls;
  • Explanations of two specific profit-making tricks used by jail phone providers, which target the very poorest consumers at their moments of crisis (with explanatory comics by illustrator Kevin Pyle);
  • A timeline showing how the two largest phone providers, Securus and GTL, are locking facilities into perpetual contracts by buying up their competitors.

“If we’re going to tame the correctional phone market, we need sheriffs, state legislators, public utilities commissions and federal regulators to understand the significance of jail phone calls,” Wagner said.


Phone providers are so creative in their influence-peddling that the most viable reform strategies do not focus only on "commissions."

by Peter Wagner and Alexi Jones, February 11, 2019

The prison and jail phone industry is rife with problems – from sky-high phone rates to inexplicable consumer fees to expensive and unnecessary “premium services” – and all of these problems can be traced to a single moment in the industry’s history: When the companies decided to start offering facilities a percentage of their revenue in order to win contracts.

Before long, jails and prisons were prioritizing commissions over low rates when choosing a phone provider. This didn’t just saddle incarcerated people and their families with higher phone rates – it created two major problems for the companies, both of which have caused the market to spiral into dysfunction.


Problem 1: The arms race for higher commissions

Prison phone companies started offering commissions to jails and prisons in order to win contracts from companies that didn’t offer them. What they didn’t expect was that sheriffs would become dependent on this new income. The companies were forced into an “arms race,” competing to give away more and more of their revenue from phone calls; the proffered commissions inched ever closer to 100%.

The companies had painted themselves into a corner: How do you make a profit when you’ve given virtually all of your revenue away? Their solution: Find another source of revenue and hide it from the facility’s management.

That’s why, today, prison and jail phone companies have learned to sustain themselves with revenue entirely separate from phone rates. The first of these hidden sources of revenue is consumer fees – fees to deposit money, open accounts, or get a refund.

The second source of revenue is a suite of unrelated, profitable services that the companies bundle into phone contracts, such as money transfer, commissary sales, video calls, emails, etc. Most recently, the New York Department of Corrections and Community Supervision signed a contract for over 50,000 “free” tablet computers, alongside its phone contract with Securus. (The tablets are, of course, not “free” for incarcerated people and their families, who pay to use the tablets and are generating millions in profit for Securus.)

Advertisement from a phone provider offering 100 percent commissions on phone revenue.Smart Communications promises the impossible. (What could go wrong?) Source: Screenshot from http://www.smartcommunications.us

Advertisement from a phone provider offering 100 percent commissions on phone revenue.Smart Communications promises the impossible. (What could go wrong?) Source: Screenshot from http://www.smartcommunications.us

The most extreme – and telling – example so far of the prison phone market’s reliance on extra services comes from a provider named Smart Communications. This year, the Florida-based company began marketing to facilities on a promise of “100% phone commissions.” The catch should be obvious: The provider makes money by bundling other profitable services into the contract, and sharing none of this additional revenue with the facilities.

Such extravagant promises reveal what providers have been doing all along: promising higher and higher commissions by relying more and more heavily on ancillary services and fees to boost profits.


Problem 2: Circumventing new regulations

Gradually, the public has come to understand that there is an inherent conflict of interest when facilities award monopoly contracts and then reap a percentage of the revenue. As a result, the commission system started to fall out of favor. Some – though far from all – state legislatures started to prohibit percentage-based commissions.

But legislatures left open a critical loophole: They didn’t prohibit companies from offering all improper perks to facilities – only commissions.

Instead of paying a fixed percentage of their revenue to the facilities, the companies now use the extra revenue to issue kickbacks in other forms. From the perspective of the poor families paying for the calls, nothing has changed – phone rates remain high – but for the companies, disguising payments in this way makes it harder for journalists and advocates to track the kickbacks. These payments include:

As such, some of the prison and jail systems that have been widely hailed for refusing phone commissions do not, in our opinion, deserve the praise:

  • In 2007, the County Commissioners of Dane County, Wisconsin voted to ban the commissions that brought in nearly $1 million per year. The County Supervisor explained, “We’ve lost our moral compass and direction for a million bucks a year.” But in 2009 the county negotiated a new contract where instead of taking a commission, it would just take an “administrative fee” of $476,000 in monthly increments.
  • By statute, the California prison system does not take a percentage commission, but it’s quite happy to take cash and cell phone blocking equipment, which was expected to cost GTL between $16.5 million and $33 million to install. (It should also come as no surprise that states with lower phone rates have fewer problems with contraband cell phones and therefore have no need for jamming equipment.)
  • Since 2008, the Michigan Department of Corrections has refused percentage commissions. However, in 2011, they raised their rates1 and started requiring that their provider pay money into a “Special Equipment Fund.” As of 2018, this fund takes in $11 million per year, which would amount to a 57% commission. As a result — despite lowering their phone rates in 2018 — Michigan’s phone calls are more expensive calls than 23 states that take traditional commissions.2

Not all hope is lost, of course. Sheriffs and legislatures still have the power to clean up this mess and make the prison and jail phone industry fair for consumers. But to do so, they’ll have to start evaluating phone contracts differently, focusing on more than just percentage commissions. Sheriffs and legislators should also ask whether:

  1. Consumers are getting a good price for phone calls and ancillary fees.
  2. The phone contract prohibits the provider from steering calls to more expensive methods.
  3. The contract does not include other correctional services. (Bundling phone contracts with other things the facility needs makes it impossible for the facility and the families to determine whether the cost for each service is reasonable.)
  4. The contract does not include “free” products like tablets which are paid for through the sale of “premium” content.
  5. The contract specifically lists all rates, fees and charges. (It is unfortunately common for facilities to sign contracts without knowing what the provider is going to charge for ancillary fees, or for products that the providers label as “premium” or “convenience”.

Similarly, it can be really tempting to want to ban percentage commissions. We instead suggest two different ways to change the incentives behind these contracts:

  1. Require contracts to be negotiated on the basis of the lowest price to the consumer. (New York law does this for the state’s prison phone contract.)
  2. Cap commissions not as a percentage but as a fixed number of cents per minute, say 1 cent a minute. This approach maintains the problematic system of families subsidizing the correctional system, but is in improvement in that it gives the facilities an economic incentive to increase call volume and to monitor their provider for unnecessary fees and services that cut in to call revenue.


Suggested reading for more on the topics here:

  • See Prison phone provider accuses Florida Dept. of Corrections of using inmates’ families as a slush fund by Ben Conarck of the Florida Times-Union about how Florida “explicitly prohibited” contract bids that offered a percent commission, and then during negotiations demanded (and received from the winning bidder) a “wish list of goodies” instead of lower rates.
  • Our August 1, 2013 letter arguing that the Federal Communications Commission should take an expensive view of “commissions.”” This letter was written when we still thought it practical to prohibit all commissions, but the detail in our letter reviews many of the most egregious examples of commissions packaged under other names.
  • Our August 12, 2015 letter to the Federal Communications Commission with our investigation of the industry’s campaign contributions. We make the case that the FCC should focus on lowering the total cost of calls instead of chasing the infinite forms that commissions are taking.
  • Our article about the prison phone industry’s new business model: “fee harvesting.” In this 2015 article, we explain why the providers focus on fees and why the facilities have a a real but short-sighted incentive to look the other way.

Footnotes

  1. Rates changed from 10-12 cents a minute to 18-20 cents with the increase going to the “Special Equipment Fund.”  ↩
  2. These states are: Florida, Hawaii, Colorado, Wisconsin, Idaho, Nevada, Washington, Wyoming, Massachusetts, North Carolina, Maine, South Dakota, North Dakota, Texas, Pennsylvania, Minnesota, Virginia, Delaware, Mississippi, Vermont, West Virginia, New Hampshire, and Illinois. The one bright spot in the Michigan contact is that it prohibits deposit fees, which the state estimates will save families $3 million per year. We don’t have a position on whether fee cuts or rate cuts are superior, but to make the best apples-to-apples comparisons, we compared other states to what we GTL would likely have set Michigan’s phone rates at with $3 deposit fees ($0.14/min).  ↩

The cost of jail phone calls punishes people in the most desperate circumstances, most of whom have not been convicted of a crime.

by Wendy Sawyer, February 5, 2019

It’s easy to see how people in state prison, who spend years or decades behind bars, are hurt by the cost of phone calls. But less obvious is how people in jail, who are usually behind bars for much shorter periods, can be hit even harder by the same cost.

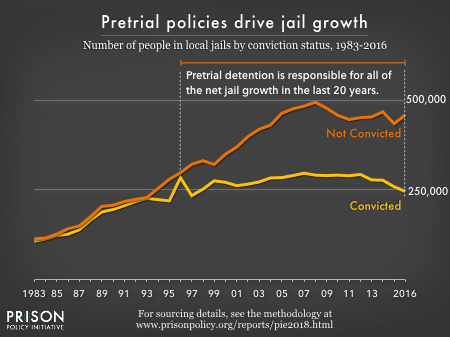
The answer has to do with why people are in local jails in the first place. In many cases, it’s solely because they are poor. On a given day, 3 out of 4 people held in jails under local authority have not even been convicted, much less sentenced. Very often, they simply cannot afford the bail amount set by the court as a condition of release. (Men in jails reported earning a median of $17,676 per year before incarceration (in 2018 dollars). For women, the median pre-incarceration income was just $11,184 per year, well below the poverty line.)

When people can’t get together the funds to get out of jail, exorbitant phone rates only make a difficult time even harder. Pretrial detention is an extremely stressful experience; detainees are often at risk of losing their jobs, housing, and even custody of their children. Being locked up, even for a short time, can interrupt medical care and can exacerbate mental health problems. It’s no coincidence that suicide risk is highest in the first week of jail incarceration. Calls with loved ones are essential for people under these conditions, who may need to coordinate childcare or elder care, make arrangements for missing work, have prescriptions brought to the facility, or simply have someone to talk to while incarcerated. Expensive phone calls further punish people in jails – most of whom, again, have not been convicted of a crime.

Even beyond the potential damage to one’s health and personal affairs, pretrial detention also negatively affects case outcomes, and it’s in this way that high phone rates from jails do the most harm to the justice process itself. People who can’t afford money bail are forced to organize their defense from jail, where it is much harder to contact people who can help – and the cost of calling them from jail is even more limiting. In a 2016 opinion in a case about the proper use of phone calls in pretrial processes, Judge Jenny Rivera acknowledged the difficulty of preparing a defense while detained:

“Pretrial detention hampers a defendant’s preparation of his defense by limiting ‘his ability to gather evidence [and] contact witnesses’ during the most critical period of the proceedings…The detained suspect…lacks a similar ability [to a defendant free on bail or their own recognizance] to contact witnesses and gather evidence.”

People detained pretrial are more likely to plead guilty just to get out of jail, more likely to be convicted, and more likely to get longer sentences. Costly phone calls play a central role in this injustice by limiting how often and how long pretrial detainees can talk to their families and friends in the service of their defense. This makes it harder for defense attorneys to coordinate with family to build mitigation cases or track down witnesses. As a result, pretrial detainees often present a weaker defense than they would have if they had been able to make calls freely (or better, had not been detained in the first place).

Furthermore, on a systemic level, high phone rates from jails hurt indigent defendants by draining already-scarce resources from public defenders’ offices. As the Missouri State Public Defenders explained in a letter to the FCC, these offices pick up the tab for phone calls from clients in jail, which can add up to tens of thousands of dollars every year. In the long term, they say the cost “reduces our ability to communicate with our clients about their cases, diminishes the quality of representation we are able to provide, and thus risks denying clients their Sixth Amendment right to effective counsel.”

So jail phone companies (and jails themselves, which get kickbacks on these calls) are essentially subsidized by public defenders – and by extension, taxpayers – while public defenders are left with even fewer resources to help indigent clients. Ultimately, this, too, makes conviction more likely.

But, wait, you might ask, if you’ve been paying attention to this issue: Didn’t the government solve this problem years ago? Didn’t the FCC limit how expensive phone calls from correctional facilities could be?

Partly, yes: In 2014, the FCC set limits on rates for out-of-state calls from prisons and jails. But here too, unfortunately, people in jails get shortchanged. People in jails almost always make in-state calls, meaning that the FCC’s rate caps don’t apply to 92% of calls from jail. Instead of paying 21 cents or less per minute, as they would for out-of-state calls, people in jail calling loved ones in-state often still pay $1 per minute or more.

The cost of these calls continues to get less attention from regulators, journalists and the public than it deserves. There’s an irony in that: When poor people in jail can’t afford to make phone calls, the fairness of the justice system is distorted – and everyone pays an outsized price.


Homelessness is the greatest predictor of involvement with the juvenile justice system. And since LGBTQ youth compose 40% of the homeless youth population, they are at an increased risk of incarceration.

by Daiana Griffith, January 22, 2019

In a recent report, we found a strong link between incarceration and homelessness among formerly incarcerated people. But while we examined racial and age disparities among that population, we weren’t able to address how homelessness affects justice-involved youth — especially LGBTQ youth who are overrepresented in the juvenile justice system. In this piece, we highlight research that elucidates the relationship between homelessness and LGBTQ youth incarceration, while also emphasizing how homelessness and incarceration disproportionately affect LGBTQ youth of color.

LGBTQ youth face higher rates of detention and incarceration. A 2015 study shows that 20% of all youth in the juvenile justice system identify as lesbian, gay, bisexual, questioning, gender nonconforming, or transgender, even though they compose only 5 to 7% of the total U.S. youth population. (Troublingly, the portion that identify as LGBTQ and/or gender nonconforming is even higher for girls in the juvenile justice system, at 40%.) This high percentage of justice-involved LGBTQ youth may be driven by their even higher rates of homelessness.

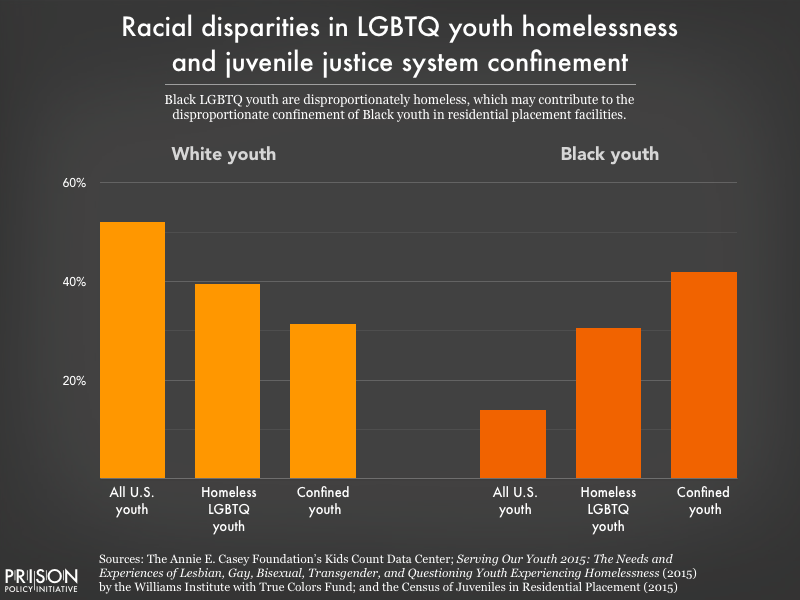
Side-by-side graphs showing that white youth are underrepresented among homeless LGBTQ youth and confined youth, while Black youth are overrepresented among both groups.While white youth are underrepresented among the homeless LGBTQ youth and confined youth populations, Black youth are overrepresented among both groups. Black youth made up just 14 percent of the total youth population in 2014, but 31% of the homeless LGBTQ youth population that year, and 42% of the confined youth population in 2015.

According to a Center for American Progress report, homelessness is the greatest predictor of involvement with the juvenile justice system, and 40% of homeless youth identify as LGBT. LGBTQ youth usually face homelessness after fleeing abuse and lack of acceptance at home because of their sexual orientation or gender identity. Once homeless and with few resources at hand, LGBTQ youth are pushed towards criminalized behaviors such as drug sales, theft, or survival sex, which increase their risk of arrest and detainment.

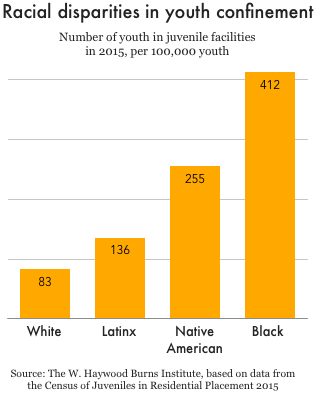
Graph showing racial disparities in youth confinement in juvenile facilities in 2015. White youth were confined at a rate of 83 per 100,000 youth, Latinx youth at 136 per 100,000, Native American youth at 255 per 100,000 and Black youth at 412 per 100,000 youth.

LGBTQ youth of color — particularly Black youth — are at an increased risk of criminalization. This, in part, reflects the fact that LGBTQ youth of color have disproportionately high rates of homelessness. A 2014 survey of human service providers serving homeless youth, for instance, reported that 31% of the LGBTQ youth they served identified as African-American or Black, despite Black youth making up only 14% of the general youth population in 2014. The racial disparities in youth homelessness contribute to the overrepresentation of youth of color in juvenile facilities in general; in 2015, 2 out of 3 youth in juvenile facilities were either Black, Hispanic, or American Indian.

The disparities in youth incarceration mean that LGBTQ youth, and especially youth of color, also face the harms related to incarceration at greater rates. Incarceration, for example, can be detrimental to young people’s physical and mental health, their relationships, and their social and economic prospects. Among these different consequences, access to stable housing can be especially negatively affected.

Youth in the juvenile justice system are likely to end up with juvenile delinquency records that can prevent them from accessing housing and finding employment once released. Similar to formerly incarcerated adults, justice-involved youth are subjected to discrimination by public housing authorities and private property owners, which, combined with affordable housing shortages, exposes them to housing insecurity.

In the case of justice-involved LGBTQ youth, housing discrimination based on criminal records can be compounded by housing discrimination against LGBTQ people. A 2017 study based in the D.C. metropolitan area found that housing providers were less likely to book an appointment with gay men, as well as less likely to tell homeseekers who disclosed their transgender identity about available units.

These alarming statistics remind us that LGBTQ youth are at a higher risk of both homelessness and incarceration, and the many harms accompanying these situations. This means that if we are to put less youth behind bars, we must address the specific needs of LGBTQ youth who often end up homeless because of family conflict. In addition, we have to make finding stable housing post-release and eradicating discrimination based on criminal records a priority to avoid cycles of reincarceration.

Daiana Griffith is a student at Mount Holyoke College, graduating in May 2019. She contributed this post as a student volunteer over the winter term.


While preparing a report grading every state's parole release system, Jorge Renaud takes a deep dive into what makes a parole system fair and just.

by Jorge Renaud, January 2, 2019

When someone from the Northeast hears I’m on parole for a robbery in Texas, they invariably say something like, “Boy, I bet you’re glad you live in Massachusetts now,” assuming that the parole system in Massachusetts is as progressive as the state’s political reputation. As we prepare a report grading the parole release systems of all 50 states, the time is right to address this question — and dispel some myths.

From 30,000 feet the criminal justice landscapes of Texas and Massachusetts look very much as we expect from such typically red and blue states. Texas actively puts people to death; Massachusetts abolished the death penalty in 1982. You can’t vote in Texas if you have a felony conviction and are either incarcerated or on any type of supervision. In the Commonwealth, the only people denied the right to vote are in prison with felony convictions, but once they are out they can vote whether or not they are on parole or probation. And when it comes to sheer numbers, Massachusetts has the lowest incarceration rate in the country, with 324 individuals behind bars for every 100,000 residents, compared to the Texas rate of 891, the 7th highest among all states.

However, when it comes to parole, I’ve found that states that look progressive may in fact be oppressive, and those we dismiss as backwards might in fact face forward.

Prisons are the most visible, obvious manifestation of criminal justice. And for those incarcerated in prisons, the experience is shaped by hope: that they will someday leave prison, join civil society and never return. The likelihood that this hope will be realized in a given state — that an incarcerated person will be released and not return to prison — can largely be quantified. Measurable outcomes of state policies affect their chances: the frequency with which people are given life sentences, the average time incarcerated individuals actually serve, how often parole is granted, and how often paroled individuals are sent back to prison for minor, non-criminal violations rather than supported as they move back into society. Together, these factors make up what I’ll call a state’s “hope index” for people serving long sentences.

Let’s look at the factors that comprise the “hope index” of Texas and Massachusetts. Two of those measures are fairly even — how long individuals stay in prison and how readily they are released on parole. In 2015, Bureau of Justice Statistics data showed that 15 percent of individuals in Texas prisons had been there over 10 years. For Massachusetts, that number was 19 percent. The Robina Institute reported that in 2014, 36 percent of all parole hearings in Texas resulted in release being granted. Robina’s latest data for Massachusetts is for 2013, when the Commonwealth paroled 34 percent of all individuals eligible for release who actually attended hearings. (That same year, the Massachusetts Parole Board reported that the “paroling rate” was 58 percent. However, that number doesn’t take into account the 2,944 waivers by incarcerated individuals who “may not be interested in adhering to expected parole conditions….” More on that in a moment.)
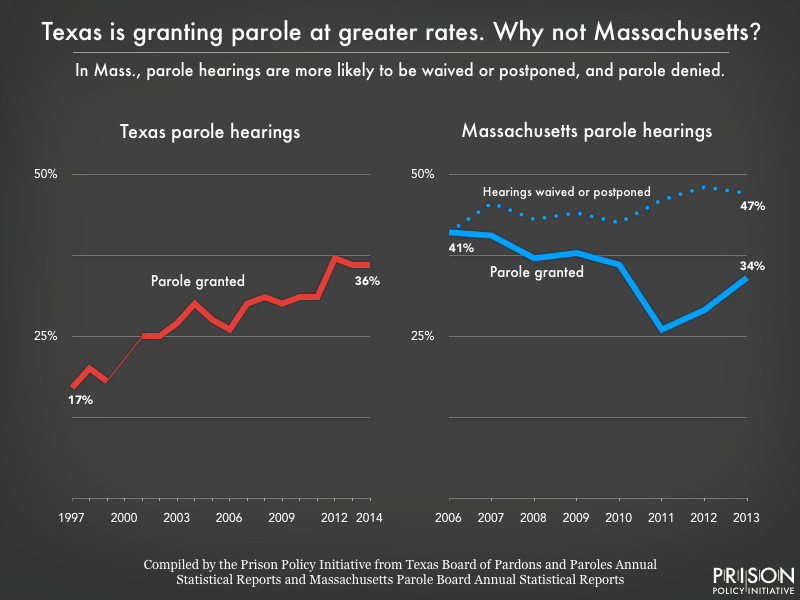
Side by side line graphs showing changes in Texas and Massachusetts parole grant rates over time. In Texas, the grant rate doubled from 17 percent in 1997 to 36 percent in 2014. In Massachusetts, the grant rate fell from 41 percent in 2006 to 34 percent in 2013, while the portion of release hearings that were waived or postponed rose from 41 percent to 47 percentFigure 1. In Texas, the parole grant rate more than doubled between 1997 and 2014 (no data were available for 2000). In Massachusetts, the grant rate fell between 2006 and 2013, while the portion of hearings that were waived or postponed increased, to make up nearly half of all scheduled release hearing outcomes in 2013. (For an explanation of this data, and why our calculated grant rates for Massachusetts are lower than those reported by the state, see the data note at the bottom of this post.)

The gap in the “hope index” becomes wider when we look at those who have an expectation of release. The Sentencing Project argues that sentences of over 50 years are “virtual life” sentences and adds those to the count of individuals sentenced to either life or life without parole (LWOP). By that count, one of every four people in a Massachusetts prison in 2016 was serving a life or virtual life sentence — the 6th highest rate in the country. Texas ranked 28th in that dismal category, with 12 percent of all individuals in Texas prisons serving life or virtual life sentences. (Lest the Commonwealth believe that including “virtual” life sentences is unfair, using just LWOP sentences leaves Massachusetts with the 2nd highest rate; 12 percent of everyone in Massachusetts prisons have LWOP sentences, trailing only Louisiana’s 13 percent. In Texas, that number is 0.5 percent.)

When it comes to staying out after release on parole, the two states again look very different from what we might expect. In 2016, Massachusetts returned 490 individuals on parole to prison; 83 percent of those were returned for a technical violation (that is, without committing a new offense). Texas returned 7,142 to its prisons, of which 18 percent were for technical violations without a new offense. Put a different way, in 2016 Massachusetts returned almost a quarter (22 percent) of its entire parole population to prison without any of them committing a new offense, while Texas returned just one percent for technical violations. In Texas, parole offers a real hope of success for those released. In Massachusetts; well, as state officials themselves write, “By virtue of being under supervision in the community, an inmate may have a higher likelihood of re-incarceration.”
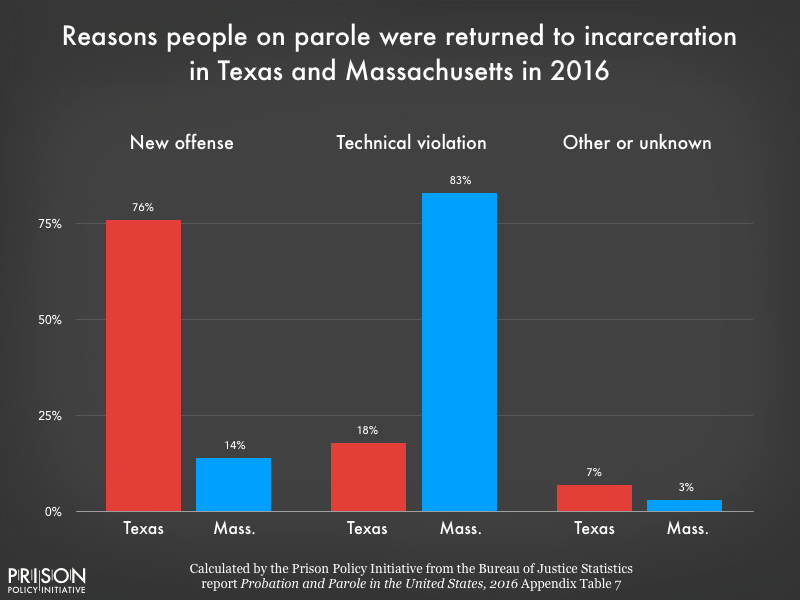
Bar chart comparing the portion of people returned to incarceration from parole in Texas and Massachusetts in 2016 for different reasons: for a new offense, for a technical violation, or another or unknown reason. 76 percent of returns in Texas were for a new offense. 83 percent of returns in Massachusetts were for technical violations.Figure 2. While Texas has a much larger parole population overall, and therefore returned more people to incarceration in 2016, three-quarters of returns to incarceration in Texas were for new offenses. Meanwhile, technical violations accounted for more than 4 out of 5 returns to incarceration from parole in Massachusetts.

Why does Massachusetts have such a low “hope index,” especially compared to Texas? Maybe the Commonwealth is diverting individuals with low-level offenses and only sending individuals to prison who commit serious and violent crimes. However, in both states, violent offenses account for approximately two-thirds of the prison population (60 percent in Texas compared to 70 percent in Massachusetts).

It may be that the Massachusetts “hope index” is skewed because over half of all scheduled parole release hearings are postponed or waived. By far the largest percentage of individuals leaving prison in the Commonwealth discharge their sentence, or “max out.” This means that a large number of individuals in Massachusetts prefer to finish their sentence rather than be on parole. (Which begs the question: Why?)

The truth, however, is simpler. First, despite the “throw away the key” rhetoric of the state’s politicians, the Texas Board of Pardons and Paroles has doubled its parole grant rate from 18 percent in 1999 to 36 percent in 2014, which was a big part of why the overall incarceration rate in Texas dropped from 1,050 in 2003 to 837 in 2014.

Second, the Texas Board of Pardons and Paroles doesn’t revoke many individuals on parole, especially not for technical violations without a new offense. The agency has not returned more than 3 percent of its parole population to prison for a technical violation since at least 2006, when the Bureau of Justice Statistics began compiling that data.

But most critically, the Texas Board of Pardons and Paroles only votes on releases and revocations — its staff do not supervise individuals on parole. That is done by the Parole Division of the Texas Department of Criminal Justice. This means parole officers in Texas are free from the political pressure that Massachusetts parole officers and supervisors surely feel, because in the Commonwealth, the officers out in the field are directly accountable to the political appointees who grant parole.

If you think that isn’t important, consider that then-Governor Deval Patrick cleaned out the entire Massachusetts Parole Board in 2011 for voting to release — and improperly supervising — Domenic Cinelli, who killed a Woburn police officer while on parole. Contrast that to the reaction of Texas parole officials when recently paroled Jose Gilberto Rodriguez killed three people and shot two others in July of 2017, sending Houston into a panic. Texas politicians didn’t hurl charges at the Board of Pardons and Paroles or its members, and an agency official told me they didn’t take those events lightly, but that those things “happen” and they did not plan any changes, in either supervision or release policies.

A final crucial difference between Texas and Massachusetts parole policies has a less quantifiable outcome, but surely affects individual success at rejoining civil society: In Texas, unlike Massachusetts, people under parole supervision are able to connect with other formerly incarcerated people, even if all are on parole, and draw on each other as a source of support. There are groups of individuals on parole and probation in Texas who are active politically, and whose voices and experiences are respected at meetings of city councils, commissioners’ courts, and at the Capitol. Massachusetts, in contrast, has a general parole condition that specifically prohibits anyone on parole from engaging “in a continuous pattern of association with persons known to have a criminal record…” and, in no uncertain terms, warns those on parole that they must, at the risk of revocation, tell their parole officer any time they are going to be in the presence of someone who has a criminal record. For those on parole, this policy not only isolates them from those who might best support and advise them as they move back into their communities — it gives any individual on parole the subtle message that they, too, are viewed with suspicion, and that others are warned against associating with them.

It’s impossible to explain the fact that Massachusetts — progressive, blue-state Massachusetts — returned to incarceration in 2016 almost a fourth of all individuals being supervised by the state parole board without those individuals being convicted of a new crime. So I won’t try.

What I can say is that “red” and “blue” don’t tell the entire story. Texas should take a hint from Massachusetts when it comes to slowing down incarceration rates, and Massachusetts could learn a thing or two from Texas about how to keep politics out of parole and give people serving long sentences a real reason to hope.


A note about the data

Those familiar with Massachusetts Parole Board statistics may wonder why the parole grant rates presented in Figure 1 are much lower than those reported by the Parole Board in their Annual Statistical Reports. This is because the Commonwealth excludes from its calculation all scheduled release hearings that are waived or postponed, and therefore do not result in a vote. In other states, this might not make much of a difference. But because so many hearings are waived or postponed in Massachusetts by those eligible for parole, ignoring those outcomes dramatically inflates the grant rate. Using reports from 2006 to 2013, we were able to recalculate the grant rates to include the waived and postponed release hearings. However, since 2014, the Parole Board annual reports no longer state how many release hearings were waived or postponed (instead, these hearings are lumped together with other kinds of hearings). It is therefore impossible to calculate a comparable grant rate for Massachusetts after 2013.


2018 was another big year for powerful data visualizations from the Prison Policy Initiative. These are our 11 favorites.

by Wendy Sawyer, December 28, 2018

2018 was another big year for powerful data visualizations from the Prison Policy Initiative. These are 11 of our favorites, in the order they appeared this year:

1. The Gender Divide

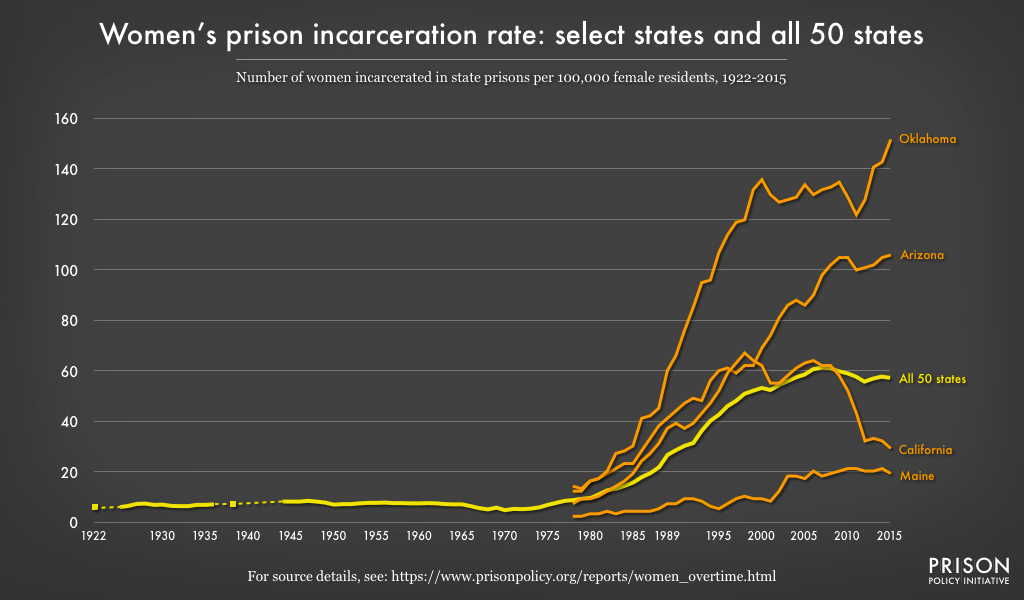
In January, we tracked women’s state prison growth as far back as 1922 to show that women’s incarceration today is historically unprecedented. Our report also shows that the national trend obscures even more dramatic state variation. For example, in 2016, Oklahoma’s female prison incarceration rate was more than double the national average, and six times the rate in Maine. We illustrated the scale of these variations by charting four disparate state trends alongside the national trend:

Line graph charting women's state prison incarceration rates in the U.S. since 1922 and in Oklahoma, Arizona, California and Maine since 1978. Oklahoma had the highest rate, at 152 per 100,000 women in 2015, Maine had the lowest at 19, and the national rate was 57. California shows a different trend, dropping dramatically in the early 2000s, while Arizona's rate has continued to climb to almost twice the national rate.


2. Youth Confinement: The Whole Pie

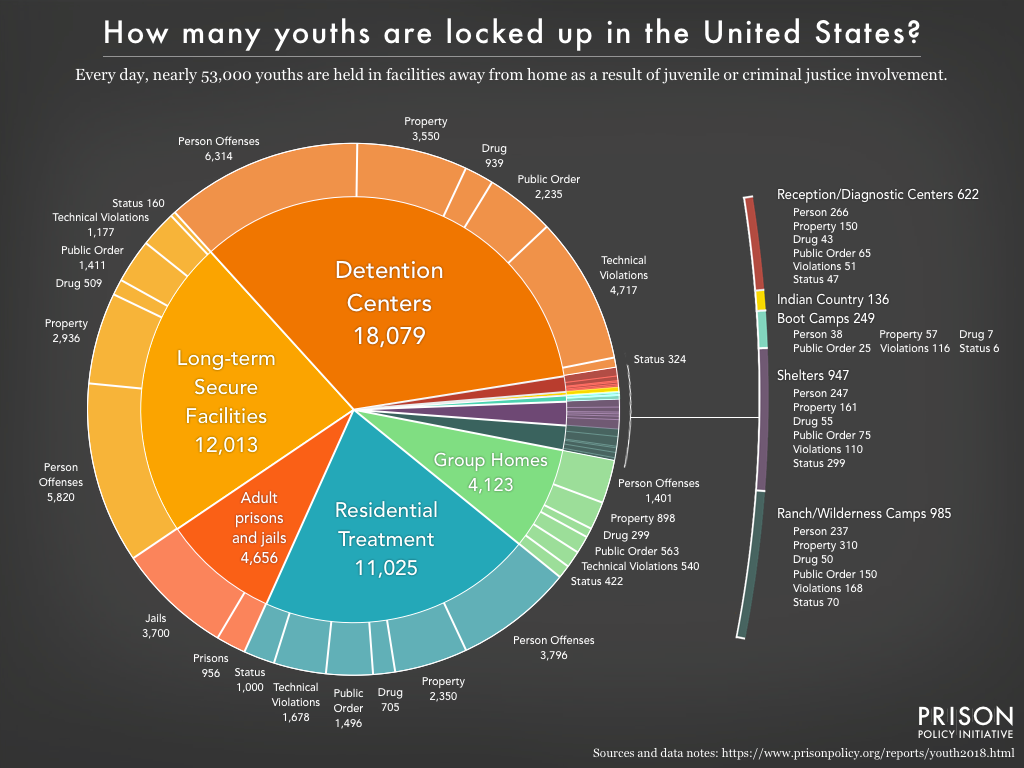
For the first time, we compiled data on youth confinement in both adult and youth facilities — using our “whole pie” approach — to show what happens when justice-involved youth are held by the state: where they are held, under what conditions, and for what offenses. We found that nearly one in ten of these youth are held in an adult prison or jail, and that most in juvenile “residential placement” are held in similarly restrictive, correctional-style facilities.

Pie chart showing the number of youth confined on a given day in the United States by facility type and, where available, the underlying offense

Other graphics in this report highlighted some of the problems of the adult criminal justice system that are mirrored in the juvenile justice system, including punitive conditions, pretrial detention, and overcriminalization.


3. Mass Incarceration: The Whole Pie 2018

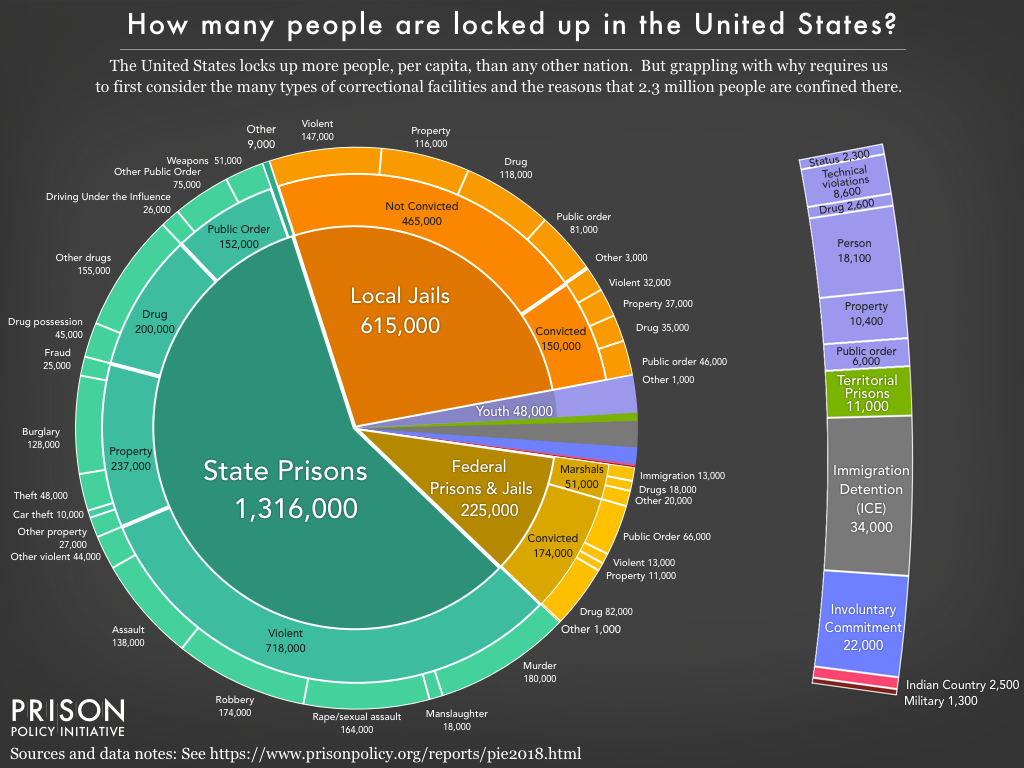
Our fifth edition of our “Whole Pie” report — and our most widely-referenced data visualization — offers the most comprehensive view of U.S. criminal justice confinement to date.

Pie chart showing where nearly 2.3 million people are locked up in the U.S. on a given day. Over half are held in state prisons, about a quarter held in jails for local authorities, and much smaller portions are held by federal authorities, juvenile facilities, state psychiatric hospitals and civil commitment centers, Indian Country jails, and immigration detention.

This year, we were able to include the 51,000 individuals held by the U.S. Marshals Service in the federal “slice,” as well as over 15,000 people held in state psychiatric hospitals due to justice system involvement. In addition to refining our methodology, we created four slideshows with detailed views of parts of the “pie” that are often misunderstood or overlooked, including federal detention and incarceration, jails and pretrial detention, drug offenses, and more.


4. Artist collaboration: Visualizing 10.6 million annual jail admissions

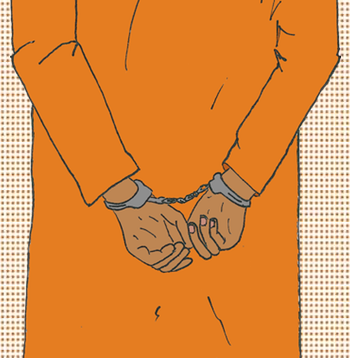
Following closely on the heels of the “Whole Pie” report, we collaborated with data journalist and illustrator Mona Chalabi to visualize how much greater the impact of jails is than the daily population suggests. While 731,000 people are held in jails on a given day, people actually go to jail 10.6 million times each year in the U.S.

What do 10.6 million jail admissions look like? To show us, Mona drew one person in handcuffs to represent one jail admission. She then repeated the image, much smaller, 10.6 million times:

Image of a person wearing an orange jumpsuit, with their hands handcuffed behind them.

To get the full effect, click through to the original post and start scrolling.


5. Showing that incarcerated people are buying necessities, not luxuries, in prison commissaries

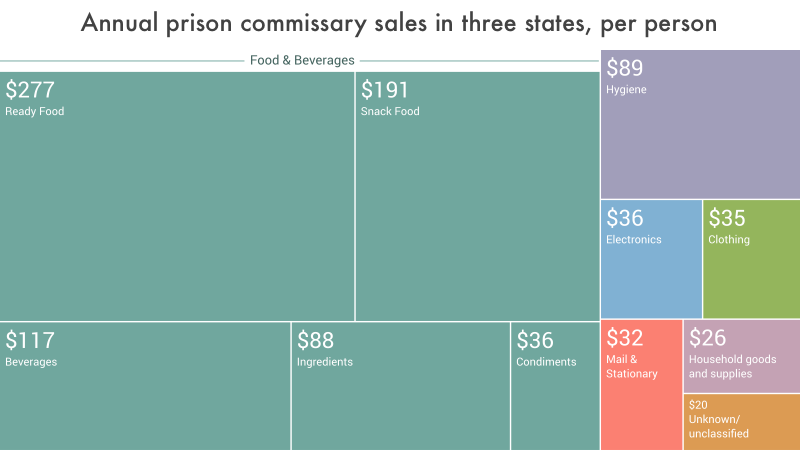
Prison commissaries are an essential part of prison life, but until this year, we didn’t have good data about how much items generally cost or what incarcerated people are buying. For the report The Company Store, Prison Policy Initiative volunteer Stephen Raher pored over commissary sales records from Illinois, Massachusetts, and Washington to find that incarcerated people in these states spent an average of $947 per person, per year, and that most of that money goes to food and hygiene products. We illustrated the breakdown of per capita commissary sales with a tree map for each state, and one showing the averages of all three states:

Image showing the average breakdown of commissary sales in three stats by product category. Food accounts for by far the most sales, followed by hygiene, electronics, and clothing.


6. Putting state incarceration rates in the global context

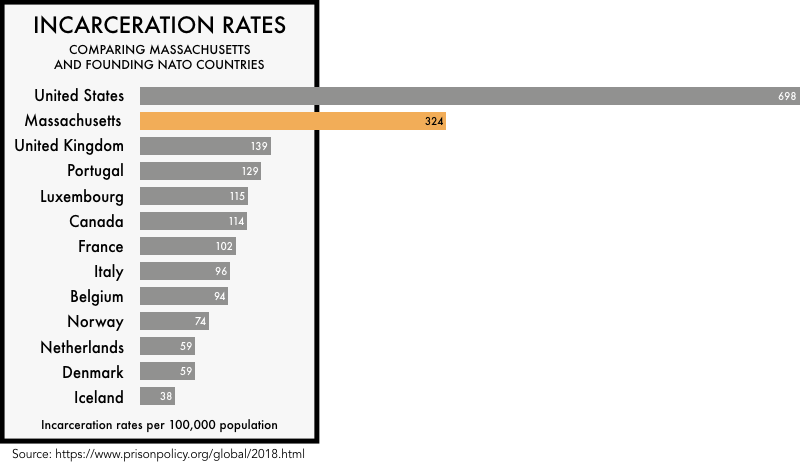
In our 2018 updates to States of Incarceration: The Global Context and its companion report focused on women’s incarceration, we compared each state’s rate of incarceration to those of 166 other countries, revealing that about half of all U.S. states have higher incarceration rates than any independent country on earth. Even states that have embraced “progressive” criminal justice reforms (like Massachusetts, below) incarcerate people at far higher rates than other Western democracies. To illustrate this point, we also created individual state graphs comparing states to founding NATO countries:

Bar chart comparing the incarceration rate of Massachusetts to the U.S. overall and to 11 founding NATO countries. Massachusetts' incarceration rate is 324 per 100,000 residents, which is lower than the U.S. rate of 698, but still more than twice the rate of the U.K., which has the next highest rate at 139 per 100,000


7. Showing the hidden costs in “free” tablet contracts

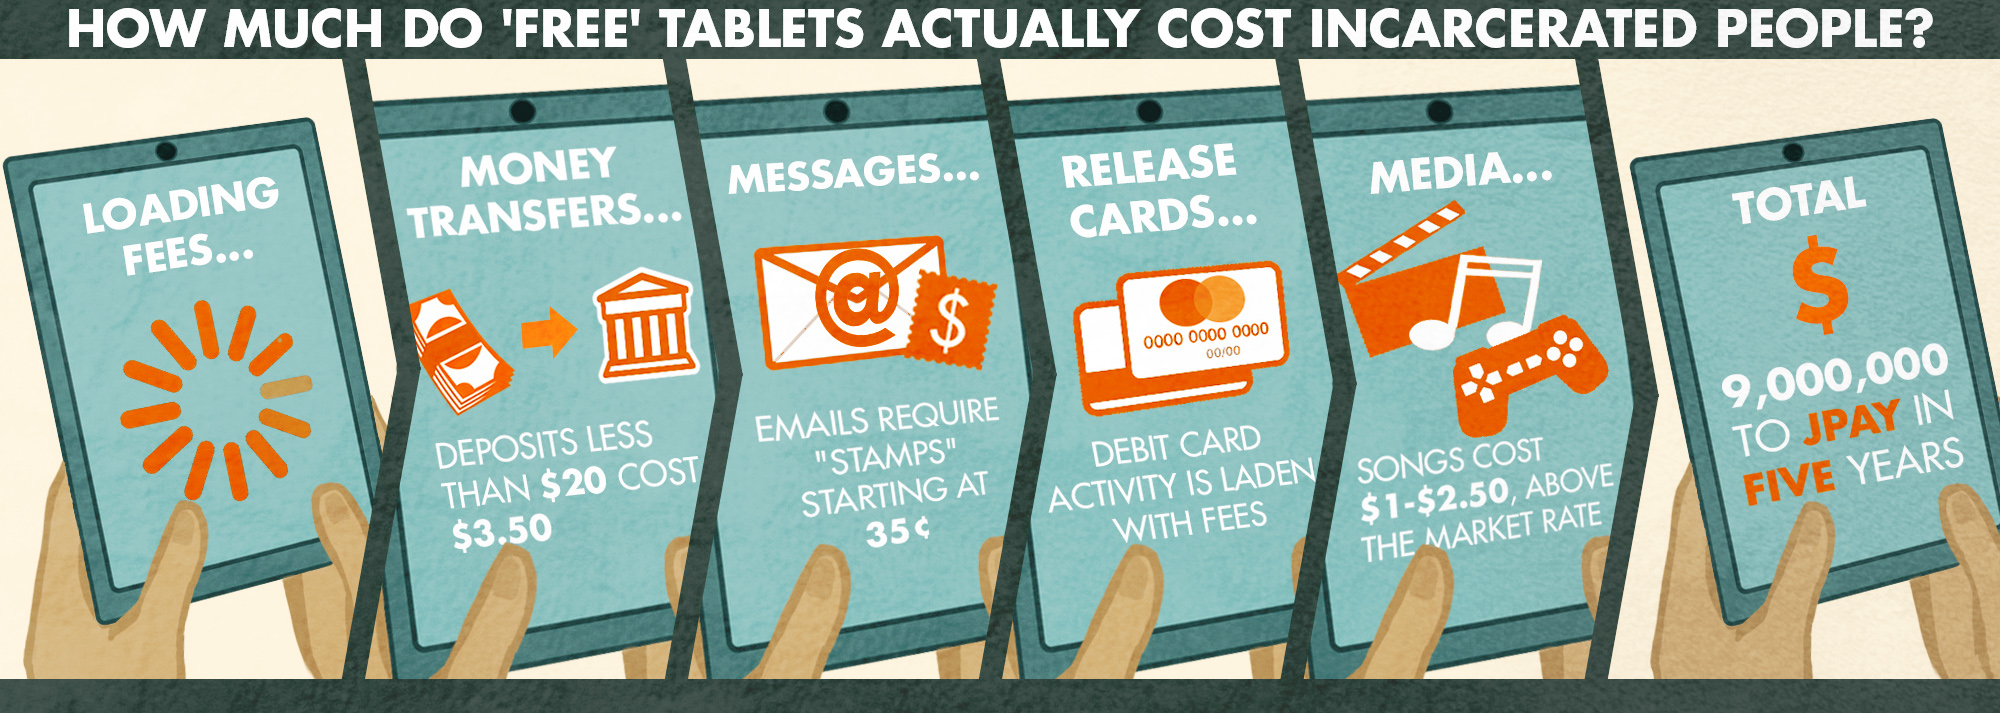
Illustrator Elydah Joyce artfully explained almost every scam we’ve documented in previous reports and how they were hidden within a “no cost” tablet contract between the New York State Department of Corrections and private company JPay:

Illustration showing five different costs built into supposedly free tablets that are charged to incarcerated people, including loading fees, money transfer fees, electronic message fees, release card fees, and overpriced digital products


8. Comparing unemployment among formerly incarcerated people to the Great Depression

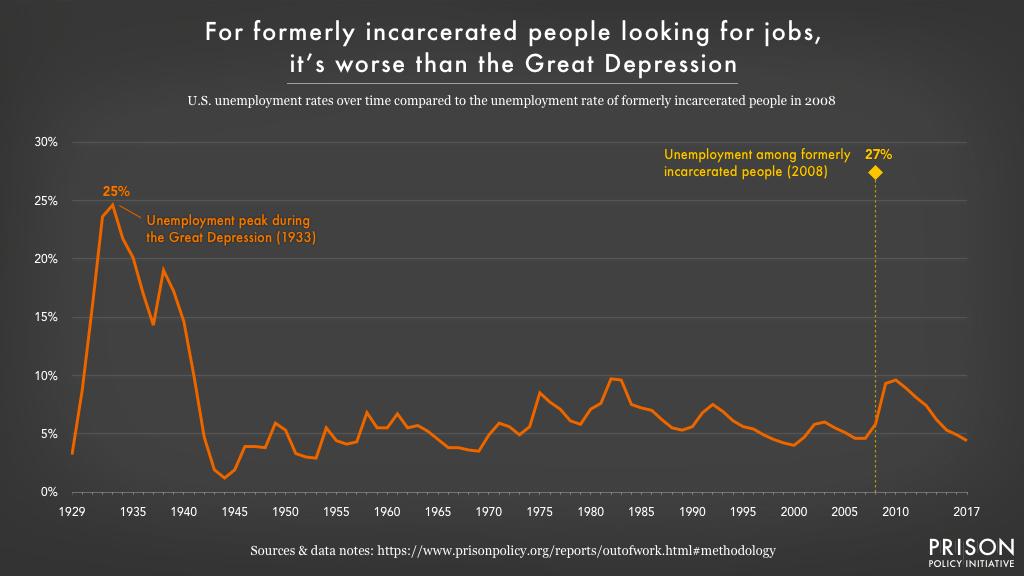
In Out of Prison & Out of Work, we calculated the first-ever national unemployment rate for formerly incarcerated people: a staggering 27 percent. To put that in perspective, we charted the U.S. unemployment rate since 1929 to show that, for the 5 million formerly incarcerated people in the U.S., the odds of finding employment are worse than they were even at the peak of the Great Depression:

Line graph charting U.S. unemployment rates since 1929. During the Great Depression, in 1933, unemployment peaked at 25 percent. In 2008, the unemployment rate of formerly incarcerated people was even higher, at 27 percent


9. Explaining the links between education, the labor market, and unemployment among formerly incarcerated people

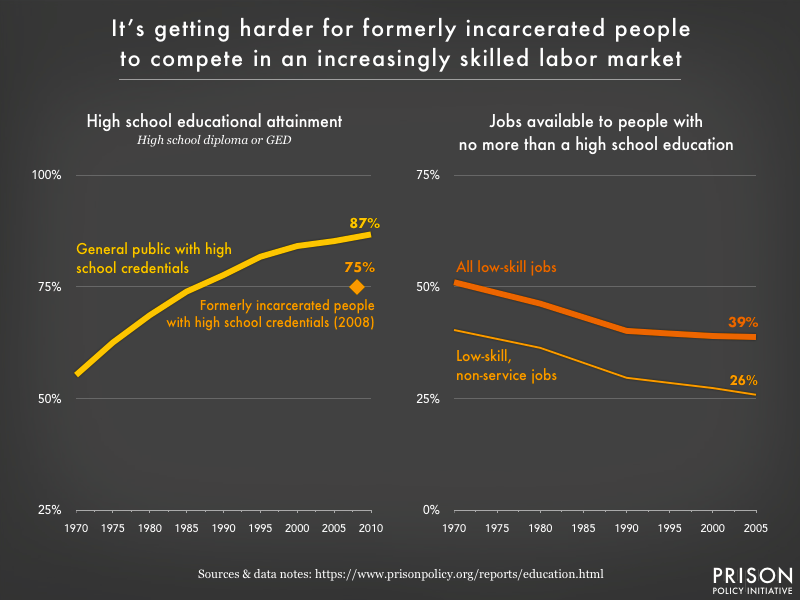
We connected the dots to show that changes in the labor market, combined with lagging educational attainment, have made it harder for formerly incarcerated people to compete for a dwindling number of low-skill jobs. This graphic from Getting Back on Course helps explain why unemployment rates are so high & and the need for educational opportunities is so great & for formerly incarcerated people:

Side by side line graphs showing that, since 1970, the portion of the general public with high school credentials has grown from just over 50 percent to 87 percent, while the portion of jobs available to people with only a high school credential has dropped from about 50 percent to 39 percent. And only 75 percent of formerly incarcerated people attain high school credentials.


10. The “Whole Pie” for women’s incarceration

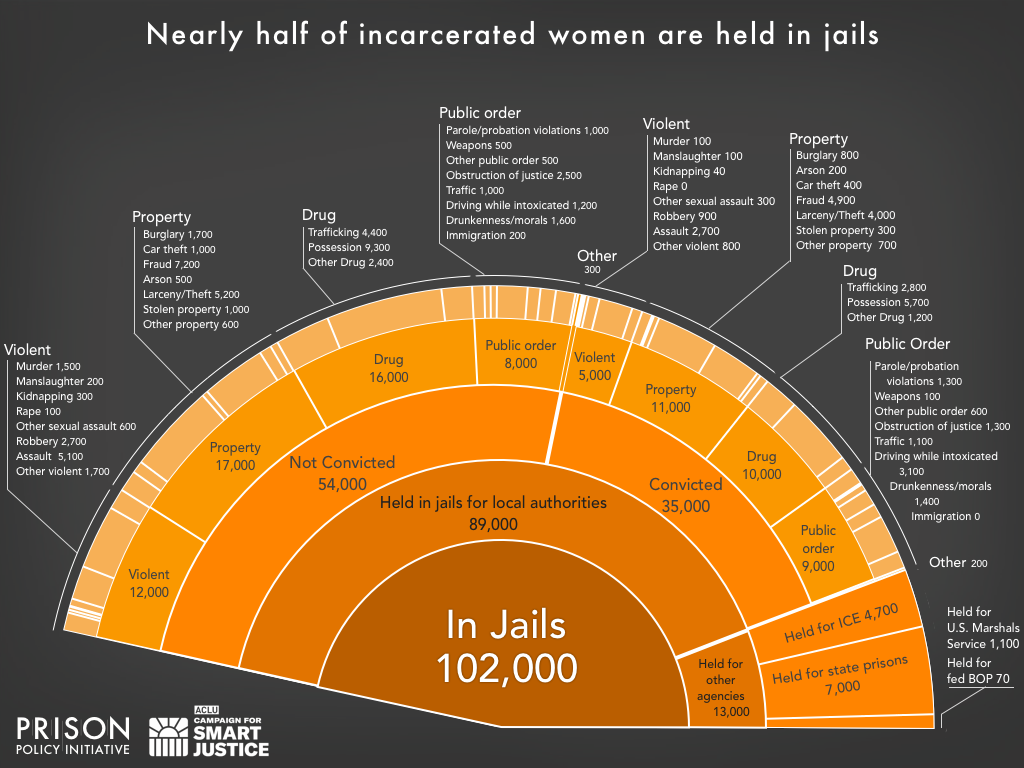
This year, we went deeper with our analysis of women’s incarceration in our update to Women’s Mass Incarceration: The Whole Pie, produced in collaboration with the ACLU’s Campaign for Smart Justice. Women remain an overlooked segment of the incarcerated population, despite the rapid growth of women’s prison and jail populations. This report offers a snapshot of how many women are locked up on a given day, where, and why. A new detailed view of the 102,000 women held in local jails reveals that over half are unconvicted and awaiting trial:

Detailed view of a pie chart wedge, showing that 102,000 women are held in jails on a given day in the U.S. About 13,000 are in beds contracted by state and federal authorities, and 60 percent of those under local control are not convicted.

While we continue to be frustrated by the lack of gender-specific data reported by government agencies, this report compiles the best sources available to help ensure that women are not left behind in the effort to end mass incarceration.


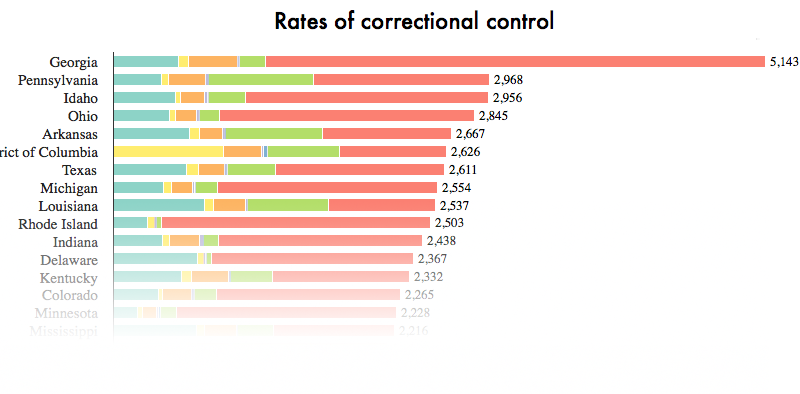
11. The big picture: correctional control by state

In our final report and infographic of the year, we compiled all of the state-level data available on various forms of state control — including incarceration in prisons and jails, probation, parole, youth confinement, involuntary commitment, and Indian Country jails — to give a more complete picture of correctional control. This broader view reveals that some states with comparatively low incarceration rates (like Rhode Island and Minnesota) have some of the highest rates of community supervision. Again, we are reminded that to end mass incarceration, every state will need to rethink its use of correctional control.


Stay Informed


Get the latest updates:


Share on 𝕏 Donate


Events

Not near you?
Invite us to your city, college or organization.