Given the public’s increasing demands for real change to the criminal justice system, we’ve updated and expanded our annual guide for state legislators to reforms that we think are ripe for victory. We’ve curated this list to offer policymakers and advocates straightforward solutions that would have the greatest impacts without further investments in the carceral system. We have focused especially on those reforms that would reduce the number of people needlessly confined in prisons and jails — a systemic problem made even more urgent by the COVID-19 pandemic.
This briefing is not intended to be a comprehensive platform, but rather to address a surprising problem faced by legislators: Each state’s criminal justice system varies so much that it can be difficult to apply lessons from other states to the same problem in one’s own. The laws and procedures are all different, each state collects different data, and often the same words are used to mean very different things in different states, so it’s important to figure out which problems are a priority in your state and which lessons from elsewhere are most useful. For that reason, each item here includes links to more state-level information, the text of model legislation, and/or detailed guidance on crafting a remedy.
Readers should also note that we made a conscious choice to not include critical reforms that are unique to just a few states, nor important reforms for which we don’t yet have enough useful resources that would make sense in most states. But this guide grows and evolves each year, so we welcome ideas and resources from other state legislators and advocates.
End unnecessary jail detention for people awaiting trial and for low-level offenses
End pretrial detention for most defendants
Problem: Many people who face criminal charges are unnecessarily detained before trial. Often the sole criteria for release is access to money for bail. This puts pressure on defendants to accept plea bargains, even when they are innocent, since even a few days in jail can destabilize their lives: they can lose their apartment, job, and even custody of children. Pretrial detention also leads to jail overcrowding, which means more dangerous conditions for people in jail, and also drives sheriffs’ demands for more and bigger jails — wasting taxpayer dollars on more unnecessary incarceration.
Solutions: States are addressing this problem with a variety of approaches, including bail reforms that end or severely restrict the use of money bail, establishing the presumption of pretrial release for all cases with conditions only when necessary, and offering pretrial services such as postcard or phone reminders to appear in court, transportation and childcare assistance for court appearances, and referrals to drug treatment, mental health services, and other needed social services.
More information: See The Bail Project’s After Cash Bail: A Framework for Reimagining Pretrial Justice; Pretrial Justice Institute; Massachusetts Women’s Justice Network’s Moving Beyond Incarceration for Women in Massachusetts: The Necessity of Bail/Pretrial Reform; the Criminal Justice Policy Program at Harvard Law School’s Primer on Bail Reform; and our briefing Technical violations, immigration detainers, and other bad reasons to keep people in jail.
Use alternatives to arrest and incarceration for low-level offenses
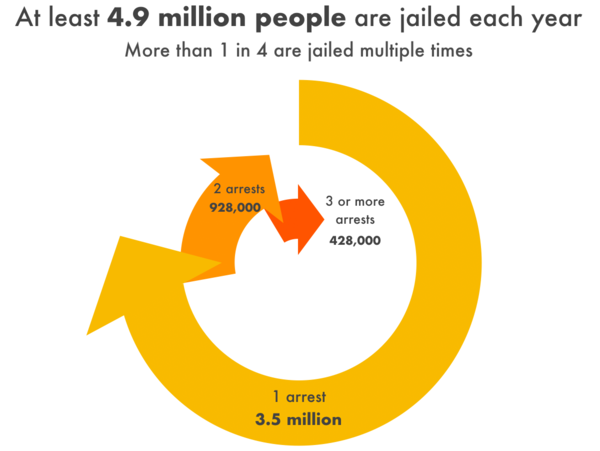
Problem: One out of every three people behind bars is being held in a local jail, and most for low-level or nonviolent offenses. Spending time in jail leads to a number of collateral consequences and financial roadblocks to successful reentry, and higher recidivism rates that quickly lead to higher state prison populations.
Solutions: Although jails are ostensibly locally controlled, the people held in jails are generally accused of violating state law, so both state and local policymakers have the power to reduce jail populations. State leaders should address state causes of growing local jail populations, such as:
- Encourage judges to use non-monetary sanctions, rather than fines and fees, and ensure that judges are holding indigency hearings before imposing and enforcing unaffordable fees.
- Reclassify criminal offenses and turn misdemeanor charges that don’t threaten public safety into non-jailable infractions, or decriminalize them entirely.
- Make citations, rather than arrest, the default action for low-level crimes.
- Institute grace periods for missed court appearances to reduce the use of “bench warrants,” which lead to unnecessary incarceration for low-level and even “non jailable” offenses. Establish an “open hours court” for those who have recently missed appearances to reschedule without fear of arrest.
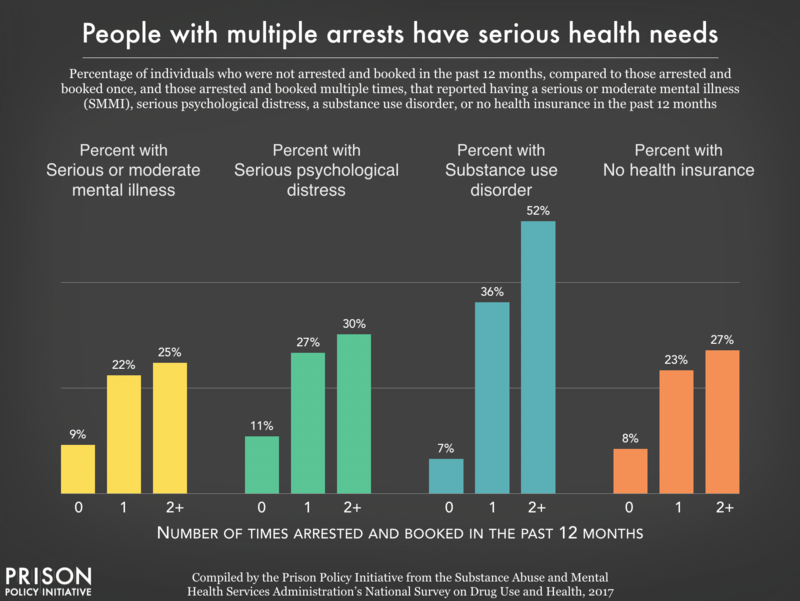
More information: See our reports Era of Mass Expansion: Why State Officials Should Fight Jail Growth and Arrest, Release, Repeat: How Police and Jails Are Misused to Respond to Social Problems, and The Bail Project’s After Cash Bail: A Framework for Reimagining Pretrial Justice.
Shorten excessive prison sentences and improve release processes
Shorten excessive prison sentences
Problem: Nationally, one of every six people in state prisons have been incarcerated for a decade or more. While many states have taken laudable steps to reduce the number of people serving time for low-level offenses, little has been done to bring relief to people needlessly serving decades in prison.
Solutions: State legislative strategies include: enacting presumptive parole, second-look sentencing, and other common-sense reforms, such as expanding good time. All of these changes should be made retroactive, and must include people convicted of both violent and nonviolent offenses.
More information: See our reports Eight Keys to Mercy: How to shorten excessive prison sentences and Reforms Without Results: Why states should stop excluding violent offenses from criminal justice reforms.
Stop mandating programming requirements that impede release on parole
Problem: The release of individuals who have already been granted parole is often delayed for months because the parole board requires them to complete a class or program (often a drug or alcohol treatment program) before they can go home — yet those programs are not readily available to them. In some states — especially Tennessee, Texas, and Vermont — thousands of people whom the parole board has been deemed “safe” to return to the community remain incarcerated simply because the state has imposed this bureaucratic hurdle.
Solution: Parole boards can waive these requirements or offer community-based programming after release. Research shows that these programs are effective when offered after release, as part of the re-entry process.
More information: See our briefing When parole doesn’t mean release.
Sentence fewer people to incarceration and make sentences shorter
Properly fund and oversee indigent defense
Problem: Low-income adults and children are frequently found guilty and incarcerated without an attorney or they are given an appointed attorney who is unqualified, financially conflicted, or who is so overworked that the defendant receives, in effect, no representation at all. This happens despite the fact that the Sixth and Fourteenth Amendments to the U.S. Constitution require states to provide effective representation to the indigent accused of crimes where incarceration is a potential punishment. Many states delegate this constitutional obligation to local governments, and then completely fail to hold local governments accountable when they fail to provide competent defense counsel.
Solution: States must require either: (a) directly fund and administer the services that provide indigent defense; or (b) create a state entity with the authority to set, evaluate, and enforce indigent defense standards for services funded and administered by local governments.
More information: Know Your State from the Sixth Amendment Center is an invaluable guide to the structure of each state’s indigent defense system, including whether each state has an independent commission with oversight of all public defense services (most do not). See also the American Bar Association’s Ten Principles of a Public Defense Delivery System and the American Legislative Exchange Council’s (ALEC) Resolution in Support of Public Defense.
Abolish mandatory sentencing
Problem: Mandatory minimum sentences and similar automatic sentencing structures like “sentencing enhancements” have fueled the country’s skyrocketing incarceration rates, harming individuals and undermining our communities and national well-being, all without significant increases to public safety.
Solution: The best course is to repeal mandatory minimum laws so that judges can craft sentences to fit the unique circumstances of each crime and individual, but where that option is not possible — either because of political or legislative realities — states should adopt sentencing “safety valve” laws, which give judges the ability to deviate from the mandatory minimum under specified circumstances.
More information, model bill language, and example bills: See Families Against Mandatory Minimums’ (FAMM) Turning Off the Spigot: How Sentencing Safety Valves Can Help States Protect Public Safety and Save Money and American Legislative Exchange Council’s (ALEC) Justice Safety Valve Act. See also our Geographic Sentencing Enhancement Zones page.
Increase the dollar threshold for felony theft
Problem: Generally, the dollar amount of a theft controls whether the crime is treated as a felony or a misdemeanor. In many states, these limits have not been increased in years, even though inflation has risen almost every year, making stagnant thresholds increasingly punitive over time.
Solution: States should increase the dollar amount of a theft to qualify for felony punishment, and require that the threshold be adjusted regularly to account for inflation. This change should be made retroactive for all people currently in prison, on parole, or on probation for felony theft.
More information and model bill language: For the felony threshold in your state and the date it was last updated, see our explainer How inflation makes your state harsher today than it was yesterday. The Pew Charitable Trusts report States Can Safely Raise Their Felony Theft Thresholds, Research Shows demonstrates that in the states that have recently increased the limits, this did not increase the risk of offending nor did it lead to more expensive items being stolen. For a model bill see the Public Leadership Institute’s Felony Threshold Reform Act.
Change the financial incentives that fuel punitive justice system responses
Redirect public funds to community organizations that provide social services
Problem: State and local investments in public safety often only fund strategies involving police and punishment. But the communities most impacted by these investments (i.e. those with the highest arrest and incarceration rates) often have little voice in these decisions, and are deprived of the resources they need for priorities such as reducing poverty and improving health, housing, education, and employment opportunities — all critical to community health and safety.
Solution: Community members can engage in budgetary advocacy to shift funding from local or state budgets into a local grant program to support community-led health and safety strategies in communities most impacted by mass incarceration, over-policing, and crime. States can use Colorado’s “Community Reinvestment” model, which is designed to support community efforts by requiring the use of a community-based intermediary organization (not a state agency) to manage the grant program and provide technical assistance. Colorado currently has four separate Community Reinvestment Initiatives that will provide over $88 million over the next few years to support community-based services in reentry, harm reduction, crime prevention, and underserved crime survivors.
More information: See the Colorado Criminal Justice Reform Coalition’s Community Reinvestment Overview Memo and a short video describing their community development approach to public safety. See also the Urban Institute’s Investing Justice Resources to Address Community Needs.
End civil asset forfeiture
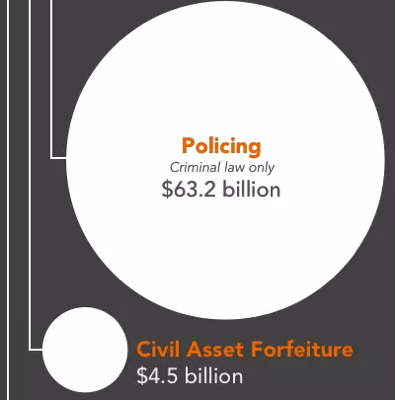
Problem: Police are empowered to seize and keep any personal assets, such as cash or cars, that they suspect are involved in a crime, even when there is never a related arrest or conviction. While this practice is supposed to disrupt major criminal organizations, it is disproportionately used against poor people who can not afford to challenge the seizures. Civil asset forfeiture makes poor communities poorer and incentivizes aggressive policing. (Even in states that have tightened asset forfeiture laws, local police can receive financial incentives to cooperate in federal property seizures from the federal “equitable sharing” program.)
Solutions: Legislatures can pass laws removing the profit motive from policing by requiring a criminal conviction for permanent forfeiture, by creating a presumption that low-value seizures are not connected to a crime and therefore not eligible for forfeiture, ending participation in the “equitable sharing” program, and requiring proceeds from forfeitures to go not to the police but to the state’s general fund or a fund dedicated to community development, education, or crime victim compensation.
More information: See the Center for American Progress report Forfeiting the American Dream and the Drug Policy Alliance’s work on Asset Forfeiture Reform(link no longer available).
Stop probation and parole systems from fueling incarceration
Reduce the length of probation sentences
Problem: Because probation is often billed as an alternative to incarceration and is imposed through plea bargains, the lengths of probation sentences do not receive as much scrutiny as they should. Excessively long sentences put defendants at risk of lengthy incarceration for subsequent minor offenses or, even worse, incarceration for minor violations of probation rules (“technical violations”).
Solutions: States should set upper limits for probation sentences and enable early discharge by awarding “compliance credits” for successfully meeting probation’s requirements for a given time period.
Example bills: Several states, including Louisiana (Act 280 (2017)), Florida (Fla. Stat. S 948.04), and New York (S4664A (2014), have shortened probation sentences by eliminating minimum sentences, setting caps on probation sentences, and awarding compliance credits. Although Louisiana’s law is stronger, ALEC has an Earned Compliance Credit Act.
More information: For more on how probation sets people up to fail, see our report Correctional Control 2018: Incarceration and supervision by state and for more on downsizing probation, see the Executive Session on Community Corrections report Less Is More: How Reducing Probation Populations Can Improve Outcomes.
Eliminate financial incentives that encourage unnecessary probation sentences
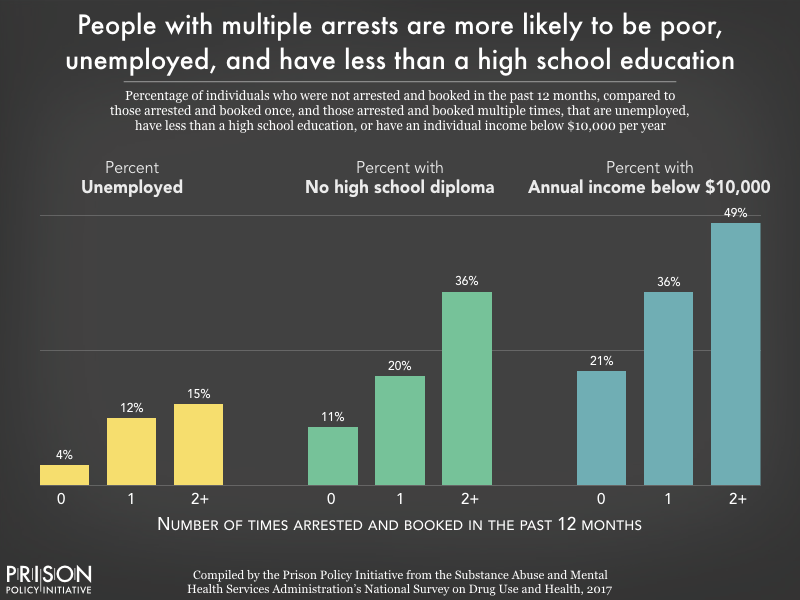
Problem: Most states charge people on probation a monthly fee, even though many probationers are among the nation’s poorest, and these fees put them at risk of being jailed for nonpayment. The Supreme Court has ruled it unconstitutional to incarcerate someone because they cannot afford to pay court ordered fines and fees, but many courts effectively do just that, by ignoring the question of ability to pay and treating nonpayment as a probation violation. When counties rely on these fees for revenue, courts are incentivized to impose unnecessary or excessive probation sentences. Moreover, the growth of privatized probation in some states has led to unnecessary “pay only” probation supervision for minor offenses.
Solutions: Pass legislation that would eliminate probation fees, require hearings on ability to pay before assessing fees, and/or regulate the use of privatized probation.
Example bills: San Francisco County Ordinance No. 131-18 (2018) eliminated all discretionary criminal justice fees, including probation fees; the ordinance includes a detailed discussion of the County’s reasons for ending these fees. Louisiana HB 249 (2017) makes many reforms, including requiring inquiries into ability-to-pay before imposing fines and fees or enforcing any penalties for failure to pay.
More information: See our briefing with national data and state-specific data for 15 states as well as our report Punishing Poverty: The high cost of probation fees in Massachusetts. States with privatized misdemeanor probation systems will find helpful the nine recommendations on pages 7-8 of the Human Rights Watch report Profiting from Probation: America’s “Offender-Funded” Probation Industry.
Eliminate re-incarceration and minimize jail time for technical violations of probation or parole rules
Problem: Incarcerating people for “technical violations” of probation and parole conditions is a common but harmful and disproportionate response to minor rule violations. These unnecessary incarcerations make it harder for people under supervision to succeed and lead to higher corrections costs. In many states, incarceration for technical violations is more common than incarceration for new crimes.
Solutions: States should limit incarceration as a response to supervision violations to only when the individual has committed a new crime and poses a direct threat to public safety. When incarceration is used to respond to technical violations, the length of time served should be limited and proportionate to the harm caused by the non-criminal rule violation.
More information: See the Pew Charitable Trusts report To Safely Cut Incarceration, States Rethink Responses to Supervision Violations.
Ending electronic monitoring for individuals on parole
Problem: Individuals on parole face an array of conditions that may result in them being returned to prison even without committing another crime. Electronic monitoring imposes unnecessary, often contradictory, conditions on recently released individuals, hindering their movement, and creating serious barriers to successful reentry.
Solutions: States can introduce and enforce legislation that would outlaw the imposition of electronic monitoring devices for individuals on parole. Until then, individuals forced to wear electronic monitors should not be required to pay for those devices nor be fined or re-incarcerated for their inability to pay monitoring fees.
More information: Challenging E-Carceration provides details about the encroachment of electronic monitoring into community supervision, and fact sheets, case studies, and possible solutions are available from the Center for Media Justice.
Keep criminal justice, juvenile justice, and immigration processes separate
Decriminalize youth and stop prosecuting and sentencing them as adults
Problem: Research has shown that adolescent brain development affects youth decision-making in ways that make it impossible to hold youth fully culpable or deem them incapable of change; the Supreme Court has supported these arguments in a series of decisions. Yet in every state, youth under age 18 can be tried and sentenced in adult criminal courts, either because the state has a lower maximum age of juvenile court jurisdiction or through juvenile transfer laws. Some state laws specify that children as young as 10 years old can be transferred to adult courts for prosecution. Even the juvenile justice system can be shockingly punitive: Most states don’t specify a minimum age of juvenile court jurisdiction, so even elementary schoolers can be found delinquent and punished by the state, and children are punished for “status offenses” that aren’t law violations for adults, such as running away or truancy.
Solutions: State legislatures should “raise the age” of juvenile court jurisdiction to reflect our current understanding of brain development, if they haven’t already, and they should also “raise the floor” to stop criminalizing young children. States should end the transfer of youth to adult courts and systems of punishment, and move “status offenses” out of the court’s jurisdiction. Finally, as in the adult justice system, public funds should be redirected from systems that punish and confine youth to community-based services that have better outcomes for youth.
More information: For an overview of youth confinement, see our report Youth Confinement: The Whole Pie. The National Conference of State Legislatures has created a map and summary of Juvenile Age of Jurisdiction and Transfer to Adult Court Laws. The Campaign for Youth Justice has an array of resources, including summaries of legislative reforms to Raise the Age(link no longer available), limit youth transfers(link no longer available), and remove youth from adult jails(link no longer available), and more recent recorded webinars on these and other solutions. For
community-driven solutions, see Youth First Initative’s No Kids in Prison campaign, and for status offense reform, see the Vera Institute of Justice’s toolkit.
End immigration detention in jails and ICE transfers from jails
Problem: Local jails and sheriffs departments cooperate with federal immigration enforcement (ICE) in many ways. Two significant ways that local jails help ICE are by: 1) agreeing to rent jail beds to ICE for people whose immigration cases are pending, and 2) routinely honoring ICE detainer requests to hold people with alleged immigration violations. By renting jail space to ICE, jails expand federal capacity for unnecessary immigration detention, and by holding people on ICE detainers, they prolong the custody of people who would otherwise be released from jail. In fact, jail transfers are the primary driver of ICE detention: About 70% of people arrested by ICE are transferred directly from the criminal justice system.
Solutions: In all but a few states, holding people for transfer to ICE is voluntary, so state policymakers and especially local sheriffs have the power to end justice-system collaboration with immigration enforcement. Local and state officials can also end the Intergovernmental Service Agreements (IGSAs) that contract jail beds out to ICE, and terminate agreements with private prison companies.
More information: From the Immigrant Legal Resource Center, see ICE Detainers Are Illegal — So What Does That Really Mean?, Responsible Releases: Safeguards to Protect Immigrants Released from Jails and Prisons,and the videos Fighting Where We Can Win: Successful Local Campaigns Against Immigration Enforcement and Dismantling Detention (link no longer available).
Give all communities equal voice in how our justice system works
End felony disenfranchisement and allow all citizens to vote
Problem: Most states bar some or all people with felony convictions from voting, sometimes while they are in prison, sometimes for life, and in some states for various times in between. (The laws vary by state: 18 states bar people in prison; 3 states bar people in prison or on parole; 17 states bar people in prison, on parole, or on probation; and 11 states disenfranchise some or all people for life after a felony conviction. Only two states — Maine and Vermont — have no restrictions.) Given the racial disparities in the criminal justice system, these policies disproportionately exclude Black Americans from the ballot box. As of 2016, almost 8% of Black adults nationwide were disenfranchised because of a felony conviction.
Solutions: Change state laws and/or state constitutions to remove disenfranchising provisions. Additionally, most governors also have the power to immediately restore voting rights to disenfranchised people via commutation or other similar means.
More information: See Felony Disenfranchisement: A Primer from the Sentencing Project and 6 Million Lost Voters: State-Level Estimates of Felony Disenfranchisement (2016) by Uggen, Larson and Shannon.
Stop “prison gerrymandering” from giving people who live near prisons more political power
Problem: The Census Bureau’s practice of counting incarcerated people at correctional facility locations (rather than at their home addresses) leads state and local governments to draw skewed electoral districts that grant undue political clout to people who live near large prisons and dilute the representation of people everywhere else.
Solutions: States can pass legislation to count incarcerated people at home for redistricting purposes, as nine states — California, Colorado, Delaware, Maryland, Nevada, New Jersey, New York, Virginia, and Washington State — have done. Ideally, the Census Bureau would implement a national solution by agreeing to tabulate incarcerated people at home in the next Census, but time ran out for that change before the 2020 Census, so states must prepare their own fix to the redistricting data released in 2021. (And the Census Bureau should make this change for the 2030 Census.)
Legislator’s guide: See our guide to ending prison gerrymandering for state legislators, published jointly with SiX.
Model bill: See our Example bill.
More information: See our Prison Gerrymandering Project website.
For interesting reports that can help you make the case for criminal justice reform in your state, see our Publications. For our work on specific problems, see our Issues page. And for data about your state, see our State Profiles.