Research confirms that prison food is not just gross; it is often nutritionally inadequate. A recent report from Washington provides new evidence and our policy analyst examines the public health costs.
by Wendy Sawyer,
March 3, 2017
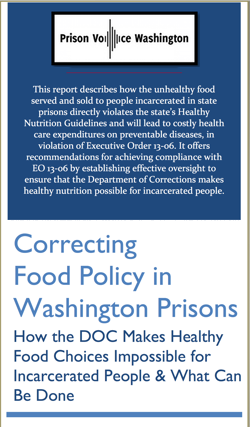 This past fall, a new report from Prison Voice Washington detailed the decline in food quality served in the state’s correctional facilities. While incarcerated people often voice complaints about (very real) quality-of-life issues related to food service, there is a broader public health concern here: the long-term health consequences of forcing incarcerated people to consume unhealthy food.
The Prison Voice Washington report
The report from Prison Voice Washington reveals how changes in food service at the Washington Department of Corrections violate the state’s own Healthy Nutrition Guidelines. Since turning over food service to the Department’s business arm, Correctional Industries, the quality of food has deteriorated and culinary job opportunities that require actual cooking skills have dried up. People incarcerated in Washington are now being forced to eat unhealthy, processed food from its central food factory.
The downturn in prison food quality can be blamed on larger trends toward industrialization and privatization. Industrialization, as exemplified by Washington state prisons, replaces cooking from scratch with processed foods that may only require reheating before serving. “When the Department of Corrections turned over responsibility for food services to Correctional Industries…, it substituted 95% industrialized, plastic-wrapped, sugar-filled ‘food products’ for locally prepared healthy food.”
Highly processed and hastily prepared food is typical of privatized food service as well. Nationally, much of prison food is outsourced to two large private corporations, Aramark Correctional Services and Trinity Services Group, the targets of increasing numbers of inmate grievances and embarrassing lawsuits. While under contract with Aramark, for example, kitchens in Michigan and Ohio prisons reportedly “served food tainted by maggots… rotten meat… food pulled from the garbage…[and] food on which rats nibbled.”
What’s especially disheartening about the state of food in Washington’s prisons is that not long ago, incarcerated people in each facility were preparing food fresh from scratch, using ingredients grown at the prisons or bought from local farmers. According to Prison Voice Washington, “Prisons grew their own food, maintained dairies and bakeries, and the food… was cooked locally.” Today, there is just one massive farm, which Correctional Industries touts as part of its “closed-loop grain-to-baker-to-prison food chain.” The most recent harvest it reports online is 200 acres’ worth of dry peas. There are still gardening programs at some facilities, but according to Prison Voice Washington, “a few small gardens… [present] a rosy veneer of sustainability and fresh produce to circumvent any real scrutiny of the bleak food reality.”
Their point? The Department is capable of doing a better job, and had done so as recently as 2009. Short-sighted administrators looking to save a few cents per meal have made a bad deal with Correctional Industries, trading a fresh, healthy food service program for highly processed foods that make incarcerated people sick.
To make their case, the authors of the Prison Voice Washington report include an incredible amount of evidence including invoices, nutrition labels, and four appendices of order forms and menus. They show that:
- Incarcerated people in Washington do not receive minimum requirements for fruits, vegetables, whole grains, lean protein, or milk.
- Incarcerated people are fed more than the recommended amounts of refined starches, added sugars and sodium.
- The DOC is fully aware of the nutritional shortcomings of its menu, so it supplements meals with fortified drink powders. These are often left untouched, so even those supplements do little to make up for the lack of nutrients in the actual food served.
- Besides the prison menu, the only other choices incarcerated people have are the products available through the commissary, where more than 90% of available products “are very unhealthy, and are categorized as ‘Avoid’ in the [State’s] Healthy Nutrition Guidelines for Vending Machines.” Even the instant oatmeal is the highly sweetened, low fiber variety on the “not recommended” list.
Again, this is all at odds with Washington’s ostensible commitment to improving nutrition. In most states, correctional agencies follow federal guidelines (or attempt to), without so much as lip-service to providing anything above a minimum standard. Washington, however, has the most comprehensive food standards of any state, although many other cities and states have adopted their own standards for food served or sold at other public agencies. The only other state with nutritional standards that apply to correctional facilities is Massachusetts; New York City and Philadelphia have sweeping city-wide nutritional standards that apply to correctional facilities as well. The Prison Voice Washington report should serve as a model to hold other agencies accountable and ensure healthy foods are available to people in correctional facilities.
Other studies of prison food show that Washington’s failings are not unique
Washington’s DOC is certainly not unique; prisons and jails are notorious for serving terrible food. Prison meals are a favorite subject for colorful photo projects and personal experiments — even Buzzfeed has made one of their trademark videos about it. And research confirms that prison food is not just gross; it is often nutritionally inadequate:
- A menu analysis from a large county jail in Georgia found incarcerated people there were served a diet too high in cholesterol, saturated fat, and sodium, and too low in fiber and several micronutrients — all factors linked to an increased risk of heart disease.
- An analysis in South Carolina found similar deficiencies, and like the Washington study, found the menu too stingy in fruits, vegetables, and milk, and too reliant on starches.
- In a Michigan report, correctional officers reported frequent deviations from the menu, especially watering down recipes and serving small portions, making it impossible for people to get the nutrients agreed upon by contract.
- The Centers for Disease Control and Prevention reports that sodium is off the charts in U.S. prisons: in 1989 (the most recent year of available data) federal prisons were serving a diet with 10,000 mg of sodium per day; by 1995, their goal was to reduce it to 6,520 mg per day — still almost three times the recommended upper limit.
So yes, prison food tastes bad. But more importantly, it’s really bad for you.
The links between chronic disease and nutrition mean that prison nutrition matters
Incarcerated people are at increased risk of chronic diseases, but rather than using Food Services to help control both health problems and the costs of medical treatment, prisons exacerbate illnesses by serving and selling unhealthy foods. Half of all incarcerated people in state and federal prisons report having had a chronic illness and are “potentially at risk for future medical problems.” Nearly as many — 40% — report a current chronic condition. Considering 1) the prevalence of chronic illness in prisons, 2) the documented impact of diet on these diseases, and 3) the much lower cost of food compared to medical treatment, it is irresponsible and shortsighted of correctional agencies to prioritize cost-cutting over nutrition.
The most problematic correlations between prison food and health include:
- Weight: The most obvious link between food services and health is weight. The Bureau of Justice Statistics reports that three quarters of people incarcerated in state and federal prisons are overweight or obese. Other researchers have found that each period of incarceration increases an individual’s Body Mass Index, which is a measure of overweight and obesity. Prison food is part of the reason why: as we’ve seen, menu analyses have found that prisons and jails serve highly processed, unwholesome food, and offer primarily high-fat and sugary options for purchase. Even when the menu fits nutritional guidelines on paper, it is often prepared in ways that make it less healthy: Prison Voice Washington reports that food service workers “attempt to fry” ingredients, so entrees like meatloaf end up “literally soaked in oil and margarine.”
- Chronic diseases: In addition to excess weight, incarcerated people suffer disproportionately from chronic health conditions. 30% of incarcerated people have hypertension, 10% heart problems, and 9% diabetes — all higher rates than the general population. As the American Heart Association’s diets for heart disease and hypertension make clear, conditions like these can be prevented or even reversed to some extent by a nutritious diet. Instead, they are made worse by menus with too much sodium and fat and not enough fiber and essential nutrients from fresh fruits, vegetables, and whole grains.
- Racial health disparities: African Americans are more likely to suffer from hypertension and diabetes, and research points to disproportionate incarceration of African American men as a cause of these health disparities. “Incarceration may help structure obesity disparities,” according to one study, and “part of the reason African American men suffer worse health is that they spend more time on average in prison, a place that undermines health,” concludes another. By ignoring the negative effects of the unhealthy prison diet on this vulnerable population, states are willingly putting them at greater risk for premature death. Each year of incarceration reduces life expectancy by two years, and this is especially true for black men.
To be sure, prisons do provide “therapeutic” or “medical” diets, prescribed by health services staff. Unfortunately, the Washington study reveals that even the “lighter fare” diet would do little to help someone with a chronic illness; it includes an extra serving of vegetables, but even less protein. In any case, when half of the incarcerated population has a chronic illness, it would make sense for a nutritious, health-services-approved diet to be the norm, not the exception. (Thankfully, some agencies have figured this out for themselves: Pennsylvania uses the Academy of Nutrition and Dietetics’ diabetic diet for its regular menu standards, and Massachusetts has created a healthier menu to minimize the number of special dietary menus needed.)
The budget is no excuse
The fact is, serving decent food is cheaper than serving unhealthy and unappetizing food in the long run. Considering the additional costs associated with poor food quality, the cost-cutting measures correctional agencies have taken around food services are fiscally short-sighted. For one thing, deteriorating food quality causes frequent security problems: when incarcerated people see that they are getting worse — or less — food than before, they protest in various ways — from dumping bad potatoes on the floor to strikes. Additional guards may be required to manage food service, not to mention the risks associated with large-scale protests like the coordinated prison strikes in the fall of 2016.
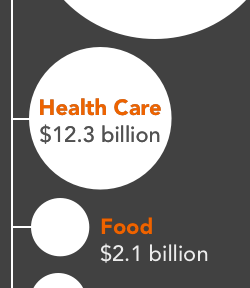 Food costs are also dwarfed by healthcare costs in prisons, so improving the nutritional quality of prison food would be a cost-effective way to improve inmate health. In our recent analysis of criminal justice costs, we found that correctional agencies spend almost six times more on health care than on food. Prison Voice Washington found that food costs make up less than 4% of the daily cost of incarcerating a prisoner — compared with healthcare, which accounts for 19% of the cost.
As the Washington authors note, even doubling the state food budget wouldn’t cost very much for the total budget and would be well worth it considering the additional healthcare costs related to chronic illness. The American Diabetes Association, for example, estimates that healthcare costs are 2.3 times higher for incarcerated people with diabetes. And overall, 86% of healthcare spending is for people with at least one chronic condition. As Prison Voice Washington concludes, “In the short run, healthy food does cost a little more — but unhealthy people cost a great deal more.”
Moreover, some states have begun to recognize that even “cost saving” moves toward industrialization and privatization aren’t worth the problems with food quality, security, and long-term health consequences. An audit of Florida’s Aramark contract found that its food costs were lower, quality was better, and more inmates actually ate the food when the Department operated its own food services program. And after struggling with a private contractor, Minnesota decided to return food services to in-house control in 2015, “providing real food for inmates even if it costs more money.”
Before long, incarcerated people’s health problems become community health problems
People who believe prison should be as punishing as possible may see little reason for facilities to serve much more than bread and water. But there is a practical reason to care about the food served in prisons: people incarcerated in state prison return to our communities sooner than you might think. As we found in an analysis last year, the median time served in state prison is 16 months and the average is 29 months. That’s more than enough time for a poor diet to cause long-term health effects. Research shows just four weeks of eating an unhealthy, high-calorie diet can lead to long-term increases in cholesterol and body fat.
When people are released from prison, their health problems become community health problems — and a financial burden on the local public health system. Preventing and helping treat chronic illnesses by serving nutritious food is cheaper than medical treatment, both during incarceration and after release.
As the Washington report demonstrates, prison food has managed to get even worse over time — and more and more people have been forced to subsist on it as the prison populations have exploded. And now, states and communities must face the long-term health consequences — and resulting healthcare costs — of feeding large numbers of incarcerated people unhealthy food. Far from a frivolous complaint, unhealthy prison food is actually a public health concern likely costing states and taxpayers far more than it saves.
 This warning suggests that Securus’s applet can potentially access unrelated information on a customer’s computer, like photos, emails, or other private files. This, in turn, raises several concerns, given the terms and conditions that customers must agree to.
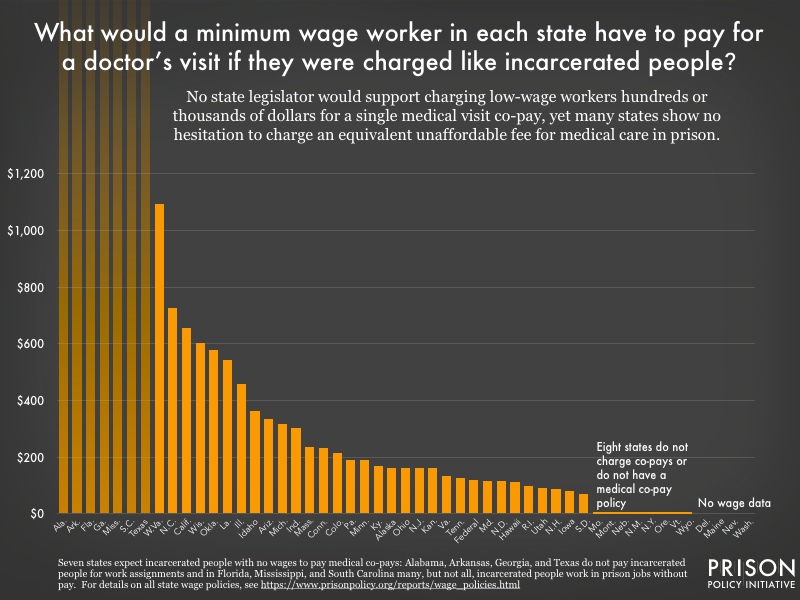 See the table below for co-pay fees and minimum wages in each state. Policy details and sourcing information can be found in the